

Summary
Background
Disturbances in emotion regulation are the hallmarks of major depressive disorder (MDD). The incapacity to control negative emotion in patients has been associated with abnormal hyperactivation of the limbic system and hypoactivation of the frontal cortex. The amygdala and orbital frontal cortex (OFC) are two critical regions of the emotion regulation neural systems.
Methods
This study investigated the anatomical basis of abnormal emotion regulation by tracking the fiber tracts connecting the amygdala and OFC. In addition, using dynamic casual modeling on resting‐state fMRI data of 20 MDD patients and equivalent controls, we investigated the exact neural mechanism through which abnormal communications between these two nodes were mediated in MDD.
Key Results
The results revealed disrupted white matter integrity of fiber tracts in MDD, suggesting that functional abnormalities were accompanied by underlying anatomical basis. We also detected a failure of inhibition of the OFC on the activity of the amygdala in MDD, suggesting dysconnectivity was mediated through “top‐down” influences from the frontal cortex to the amygdala. Following 8 weeks of antidepressant treatment, the patients showed significant clinical improvement and normalization of the abnormal OFC‐amygdala structural and effective connectivity in the left hemisphere.
Conclusions & Inferences
Our findings suggest that pathways connecting these two nodes may be core targets of the antidepressant treatment. In particular, it raised the intriguing question: Does the reversal of structural markers of connectivity reflect a response to antidepressant medication or activity‐dependent myelination following a therapeutic restoration of effective connectivity?
Keywords: dynamic causal modeling, effective connectivity, major depressive disorder, uncinate fasciculus, white matter integrity
1. INTRODUCTION
Major depressive disorder (MDD) is a serious psychiatric mood disorder and is typically characterized by a pervasive and persistent dysthymia, anhedonia,1 excessive fatigue,2 and a relative absence of positive affect.3 Abnormal emotion processing is a core feature of MDD. Many studies have suggested the involvement of the neural systems associated with emotion regulation in the pathophysiological basis of MDD.3, 4, 5, 6 These systems generally encompass the amygdala, orbital frontal cortex (OFC), anterior cingulate cortex, dorsomedial frontal cortex, etc.7, 8, 9 Unlike healthy controls, patients with MDD fail to demonstrate differences in the activation of the rostral anterior cingulate between happy and sad emotion regulation.9 In addition, significantly greater activation of right‐sided amygdala was observed in adults with MDD compared with healthy controls, when viewing angry and happy faces.7
The amygdala and the orbital frontal cortex (OFC) are two critical regions of the emotion regulation neural systems,10 for that they are suggested to support the generation, encoding, and regulation of affective values.11, 12 Recent studies using brain connectivity analyses techniques have revealed prominent abnormalities functional connectivity (generally measured as undirected correlation) between the amygdala and OFC. Reduced resting‐state amygdala‐OFC functional connectivity was observed in patients with MDD compared to healthy controls.8 Interestingly, during performance of emotion labeling tasks, subjects with depression demonstrated abnormally elevated amygdala‐OFC functional connectivity when response to sad stimuli, while decreased amygdala‐OFC functional connectivity was found when they were presented with happy stimuli.13
Although altered amygdala‐OFC functional connectivity has been generally associated with the neural substrates of MDD, it remains unclear whether such functional abnormalities are supported by underlying anatomical basis. It is possible that the functional disconnection between the amygdala and the PFC may arise from impaired integrity of white matter tracts that connect these two nodes. Conversely, it may reflect a consequence of impoverished neuronal communication, secondary to activity‐dependent changes in myelination. In other words, structural connectivity may cause or may be caused by underlying changes in effective connectivity. One candidate white matter tract is the uncinate fasciculus which connects the OFC with temporal lobes14 and has been suggested to be involved in emotion processing and regulation.14, 15, 16, 17 Recently, some attempts have been made to provide initial evidence of decreased white matter integrity of the uncinate fasciculus in MDD.18, 19 Decreased fractional anisotropy (FA) of part of this white matter tract that connects the subgenual ACC with amygdala was observed in adolescents with depression.18 In addition, increased radial diffusivity of the right uncinate fasciculus was also reported in patients with MDD.19 In this, we aimed to further investigate whether impaired white matter integrity between the amygdala and OFC may support abnormal functional connectivity between these two nodes in MDD as consistently reported in previous studies. Diffusion‐weighted images were collected, and the FA value of the fiber tracts connecting the amygdala and OFC was compared between the patients with MDD and controls.
Another critical question that remains unclear is the exact neural mechanism by which abnormal communications between the amygdala and OFC are modulated in MDD. Functional and structural dysconnectivity may arise from a “top‐down” mechanism supported by altered influences from the OFC to amygdala or from a “bottom‐up” mechanism modulated by abnormal influences from the amygdala, or even arising from disrupted bidirectional interactions between these two nodes. Thus, in this study, we attempted to further answer this question by investigating the directionality of the signal transmission within the neural pathways connecting the amygdala and OFC. We accomplished this aim with the help of recent advances in brain effective connectivity analysis methods which measured directed influences from one neural system to another.20 Dynamic causal modeling21 was used to study information flow between the amygdala and OFC in patients with MDD.
Finally, we tried to establish whether distracted structural and effective connectivity within this emotion regulation neural system would be normalized after antidepressant treatment with the improvement in clinical symptoms. As previous studies have suggested that activity of both the amygdala22 and frontal cortex23 was modulated by antidepressant treatment, we were interested to see whether similar effects could be observed in structural and effective connectivity in the patients. Thus, the patients with MDD in this study were scanned twice, first at baseline, and then after 8 weeks of antidepressant treatment with venlafaxine (75‐150 mg/day). We compared structural and effective connectivity between the amygdala and OFC in three different groups: MDD subjects at baseline, MDD subjects after treatment, and healthy controls. We hypothesized that: (i) abnormal amygdala‐OFC functional connectivity consistently observed in previous studies may be supported by impaired integrity of the white matter tracts connecting these two node; (ii) functional and structural dysconnectivity may be modulated by disrupted causal neural interactions within these neural pathways; and (iii) abnormalities in structural and effective connectivity in the patients may be restored by 8 weeks of antidepressant treatment with the improvement in clinical symptoms.
2. MATERIALS AND METHODS
2.1. Subjects
Twenty patients with a recent history of MDD were recruited from Xijing Hospital of the Fourth Military Medical University of China. All the patients were conformed to DSM‐IV criteria for major depressive disorder as diagnosed by the Structured Clinical Interview for DSM‐IV and completed the 17‐item Hamilton Rating Scale for Depression (HAMD‐17) and the Hamilton Anxiety Scale (HAMA). Each patient with MDD was first scanned at baseline before any antidepressant treatment. Then, the patients with MDD were treated with venlafaxine (75‐150 mg/day). After 8 weeks of antidepressant treatment, all the patients were given a second Structured Clinical Interview for DSM‐IV and completed HAMD‐17 and HAMA Scale. Twenty healthy subjects, without a history of neurological or psychiatric disorders, were also recruited in the study through advertising. All participants gave written informed consent, in accordance with the recommendations of the Ethics Committee of Xijing Hospital of the Fourth Military Medical University. Table 1 and Figure 1 show the demographical and clinical characteristics of the three groups, that is, the control subjects, the pretreatment (PreT), and posttreatment (PostT) MDD groups. Two‐sample t tests were performed to compare the clinical scores between the three groups (Figure 1).
Table 1.
The Demographical and Clinical Characteristics of the Pretreatment MDD Group (n = 20), the Posttreatment MDD Group (n = 20), and the Control Subjects (n = 20)
| Characteristic | Pretreatment MDD Mean(SD) | Posttreatment MDD mean (SD) | Control subjects mean (SD) |
|---|---|---|---|
| Gender (M/F) | 6/14 | 6/14 | 6/14 |
| Age(y) | 33.5 ± 12.2 | 33.5 ± 12.2 | 34 ± 11.7 |
| Education(y) | 10.9 ± 4.1 | 10.9 ± 4.1 | 16.8 ± 4.5 |
| Current episode duration (mo) | 40.4 ± 67.3 | 40.4 ± 67.3 | |
| HAMD_17 | 22.7 ± 3.5 | 7.7 ± 3.5 | 1.8 ± 2.1 |
| HAMA | 18.3 ± 3.2 | 6.5 ± 2.7 | 1.5 ± 1.8 |
F, female; HAMA, Hamilton Anxiety Scale; HAMD‐17, 17‐item Hamilton Rating Scale for Depression; M, male; MDD, major depressive disorder; control, healthy controls.
Figure 1.
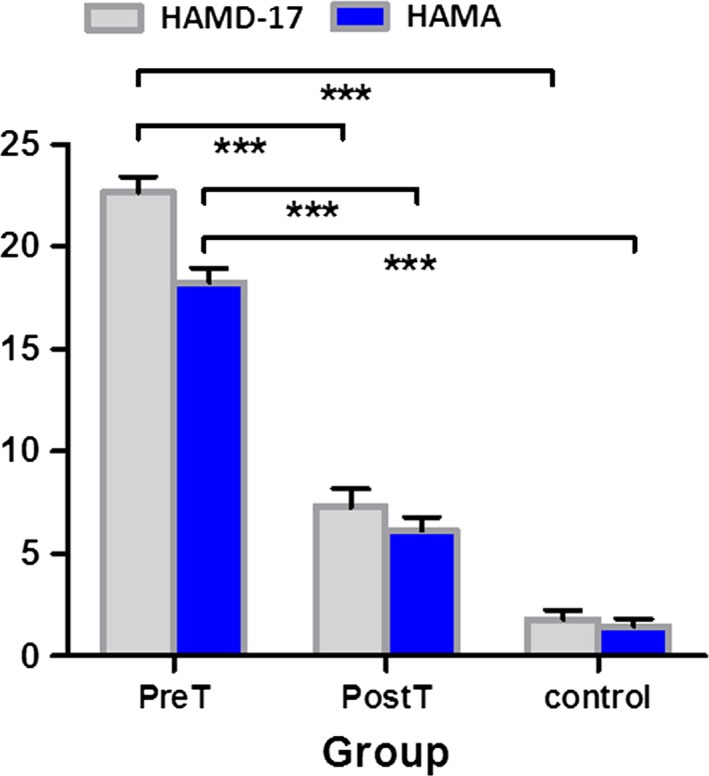
The 17‐item Hamilton Rating Scale for Depression (HAMD‐17) and the Hamilton Anxiety Scale (HAMA) scores of the three groups. There was significant (P < 0.001) clinical improvement in the MDD subjects after antidepressant treatment. The posttreatment MDD clinical scores are very similar to the control subjects. *** Significance at P < 0.001; PreT, pretreatment MDD; PostT, posttreatment MDD; control, healthy controls
2.2. Image acquisition
All MRI data were acquired using a 3.0 T GE 750 Medical Systems scanner in Xijing Hospital. The subjects were instructed to lie in the scanner, keep their eyes closed, and not to think of anything in particular. Foam pads were used to fix their head to prevent head movement. In addition, earplugs were given to the subjects to reduce the noise of machine. No stimuli were presented to the subjects during the scan.
Diffusion‐weighted images were collected with the following parameters: repetition time = 10 000 ms, field of view = 240 mm × 240 mm, number of slices = 70, slice thickness = 2.0 mm, spacing = 0.0 mm. In all, 70 contiguous axial slices aligned to the anterior commissure‐posterior commissure line were collected along 64 gradient directions with b = 1000s/mm2 and one minimally diffusion‐weighted scan (the b0 image).
Resting‐state functional MRI images were collected using T2‐weighted gradient echo, echo‐planar imaging sequence with the following parameters: repetition time = 2000 ms, echo time = 30 ms, field of view = 240 mm × 240 mm, matrix = 64 × 64, flip angle = 90°, number of slices = 45, slice thickness = 3.5 mm, spacing = 0.0 mm.
2.3. Data preprocessing
Diffusion MRI data were preprocessed using the TORTOISE software package (http://www.nitrc.org/projects/tortoise). Images were first corrected for bulk subject motion and eddy currents by aligning the diffusion‐weighted volumes to each subject's first b0‐volume. Diffusion Toolkit approaches (http://www.trackvis.org/dtk/) to DTI analysis were used to obtain individual subject diffusion tensors and their associated parameters (fractional anisotropy, principal directions, eigenvalues).
Functional data were preprocessed using the CONN (http://www.nitrc.org/projects/conn/) software package. The steps of functional data preprocessing include that discarding the first ten images for each subject, slice‐timing correction, functional realignment and normalization, outlier detection, functional segmentation, structural segmentation and normalization, smoothing.
2.4. Structural MRI connectivity: diffusion tensor imaging
To compare between‐group differences in white matter integrity of the uncinate fasciculus in both the right and left hemisphere, 4 seed regions (2 seeds for each hemisphere) representing the amygdala and OFC were defined as volumetric regions based on the anatomical automatic labeling atlas available within the FMRIB Software Library(FSL) software package (https://fsl.fmrib.ox.ac.uk/fsldownloads_registration). These seeds were selected to anchor the endpoint of tracks that constitute the uncinate fasciculus (Figure 2A).
Figure 2.
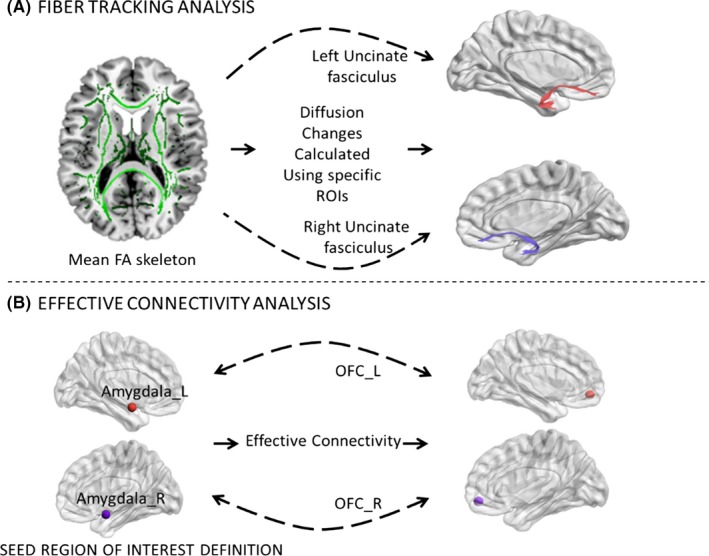
Overview of imaging and analysis methods used to assess (A) white matter integrity, and (B) effective connectivity in the three groups. A, A whole‐brain white matter (skeletonized) mean fractional anisotropy (FA) image is shown. White matter integrity was investigated by assessing group differences in diffusion metrics such as FA of specific regions of interest, including (red) the left uncinate fasciculus and (purple) the right uncinate fasciculus. B, Effective connectivity between the amygdala and OFC was assessed using a dynamic causal modeling approach. Both effective connectivity change between the left amygdala (amygdala_L, red) and the left OFC (OFC_L, red), and that between the right amygdala (amygdala_R, purple) and the right OFC (OFC_R, purple) were analyzed. ROIs, regions of interest
For each hemisphere and each subject/visit, the uncinate fasciculus mean summary values (fractional anisotropy, mean diffusivity, axial diffusivity, and radial diffusivity) were extracted using the software package of TrackVis (http://www.trackvis.org/). Finally, 2‐sample t tests were performed to investigate white matter integrity of the uncinate fasciculus within the three groups. The significant fractional anisotropy changes at baseline were correlated with neuropsychological data to investigate whether individual differences in white matter integrity were associated with the extent of depression.
Whole‐brain analyses were also performed for complementing the deterministic tractography analysis using FSL. Statistical analyses were performed using nonparametric permutation testing with the TBSS (tract‐based spatial statistics) method.
2.5. Functional MRI: resting‐state effective connectivity
Effective connectivity between the amygdala and OFC was investigated using dynamic causal modeling.21 Data were analyzed using DCM12 in SPM12 (http://www.fil.ion.ucl.ac.uk/spm/software/spm12/). After data preprocessing, four regions of interest (ROIs) were defined as 6 mm radius spheres to represent the amygdala and OFC. The centers of these ROIs are the same as the volumetric seed regions described in the section of structural MRI connectivity: diffusion tensor imaging. The MNI coordinates of the ROIs centers were as follows: the left amygdala (−24, −1, −18), left OFC (−31, 51, −10), right amygdala (28, 1, −18), and right OFC (34, 53, −11). Next, subject‐specific time courses for each ROI were summarized with their principal eigenvariate. The causal interactions among these ROIs were studied using a model with bilateral and recurrent connectivity between the OFC and amygdala in each hemisphere. We then used spectral DCM to estimate the extrinsic (between‐node) effective connectivity under a full model. In other words, we use the cross‐spectral density of the ROI time series to fit a dynamic causal model of connectivity (and the spectral parameters of endogenous fluctuations). Finally, the optimal model for each subject was identified using a network discovery scheme. Given the parameter estimates and model evidence of the full model, the network discovery scheme ranked all the reduced models nested within the full model according to the model evidence of each reduced model inferred from that of the full model. These connectivity estimates of the optimal reduced model which had the highest model evidence were used for classical inference at the between‐subject level. Specifically, the coupling parameters of different groups were compared using two‐sample t tests. Finally, the coupling parameters of each group were correlated with the clinical diagnostic scores for depression to investigate whether individual differences in effective connectivity between these two nodes were associated with the extent of depression impairment using Pearson's correlation. Note that we did not examine intrinsic or recurrent (within‐node) connections as we were primarily interested in the extrinsic (between‐node) connectivity—and whether it changed in parallel with the corresponding structural connectivity.
3. RESULT
As expected, DTI provided an evidence of white matter disruption in patients with MDD. A whole‐brain analysis showed widespread reductions and locally increased fractional anisotropy, a characteristic of diffuse axonal injury (Figure 3A).
Figure 3.
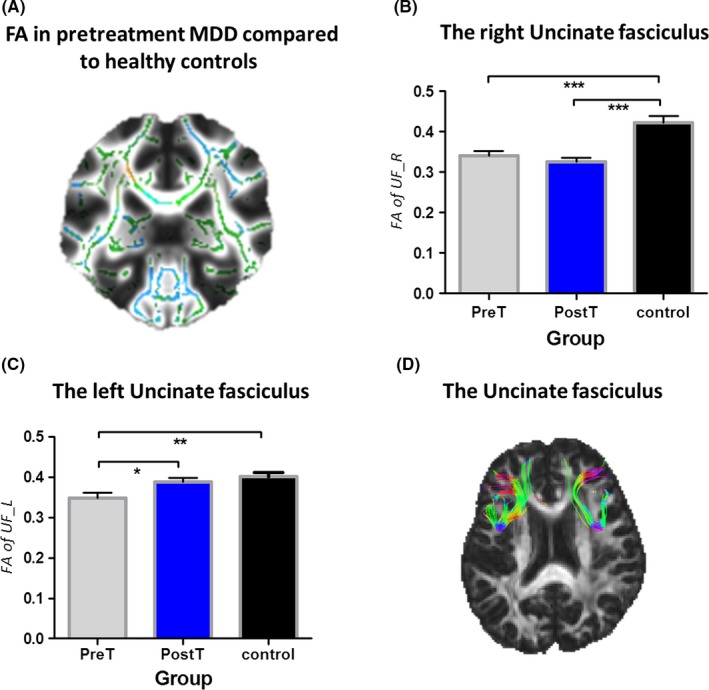
Comparison of white matter integrity of the uncinate fasciculus in the three groups. (A) Primarily fractional anisotropy (FA) reductions in whole‐brain white matter (skeletonized) from a direct contrast between the healthy controls and pretreatment patients with MDD. Green = normal white matter; red = damaged areas (high fractional anisotropy); blue = damaged areas (low fractional anisotropy). Fractional anisotropy changes within (B) the right uncinate fasciculus and (C) the left uncinate fasciculus. (D) Right and left of the uncinate fasciculus. * Significance at P < 0.05, *** Significance at P < 0.001, asterisk symbol indicates a trend. PreT, pretreatment MDD; PostT, posttreatment MDD; control, healthy controls. UF_L, the left uncinate fasciculus; UF_R, the right uncinate fasciculus
We specially examined factional anisotropy of the left and right uncinate fasciculus. Result demonstrated that the pretreatment MDD group shows significantly reduced fractional anisotropy within right (t = 4.013, P = 0.0003) and left (t = 3.059, P = 0.0041) uncinate fasciculus compared to healthy controls. However, 8‐week antidepressant treatment put different effects on different parts of the uncinate fasciculus in the posttreatment MDD group. For the left uncinate fasciculus, a significant increase in fractional anisotropy (t = 2.276, P = 0.0285) was observed in the posttreatment MDD group compared to that of the pretreatment MDD group, and returned to normal as that in healthy controls. For the right uncinate fasciculus, the significant difference (t = 5.010, P < 0.0001) in fractional anisotropy still existed between the posttreatment MDD group and healthy controls, and no much improvement on FA was detected after the treatment (Figure 3B, C).
In addition, correlation analyses indicate that FA of the left uncinate fasciculus was associated with Clinical diagnostic scores for depression. Individual differences in FA of the left uncinate fasciculus were significantly correlated with HAMA across all subjects (R = 0.0445, P = 0.06781), as well as when pretreatment patients with MDD were assessed alone (R = 0.4526, P = 0.0012). Additional correlation tests indicate that HAMD‐17 trended to correlate with FA of left uncinate fasciculus across all subjects (R = 0.1282, P = 0.0050) and in pretreatment patients with MDD alone (R = 0.006726, P = 0.7310). However, no significant association was found between Clinical diagnostic scores for depression and FA of the right uncinate fasciculus (Figure 4).
Figure 4.
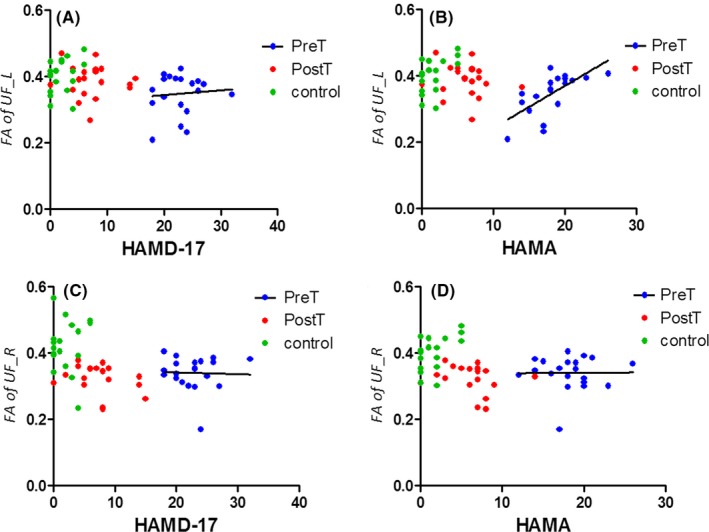
Correlation between clinical scores on the depression and the factional anisotropy of the uncinate fasciculus in the three groups. (A) Correlation between HAMD‐17 and FA of the left uncinate fasciculus in pretreatment MDD. (B) Correlation between HAMA and FA of the left uncinate fasciculus in pretreatment MDD. (C) Correlation between HAMD‐17 and FA of the right uncinate fasciculus in pretreatment MDD. (D) Correlation between HAMA and FA of the right uncinate fasciculus in pretreatment MDD. HAMA=Hamilton Anxiety Scale; HAMD‐17 = 17‐item Hamilton Rating Scale for Depression
Based on the abnormalities observed in white matter integrity, we examined the effective connectivity of the central nodes in the uncinate fasciculus, amygdala, and the orbital frontal cortex. For the left connection between the amygdala and the OFC, we found a decreasing trend of effective connectivity in pretreatment patients with MDD compared to healthy control (the top‐down connection from OFC_L to Amg_L: t = 1.577, P = 0.1230) (Figure 5).
Figure 5.
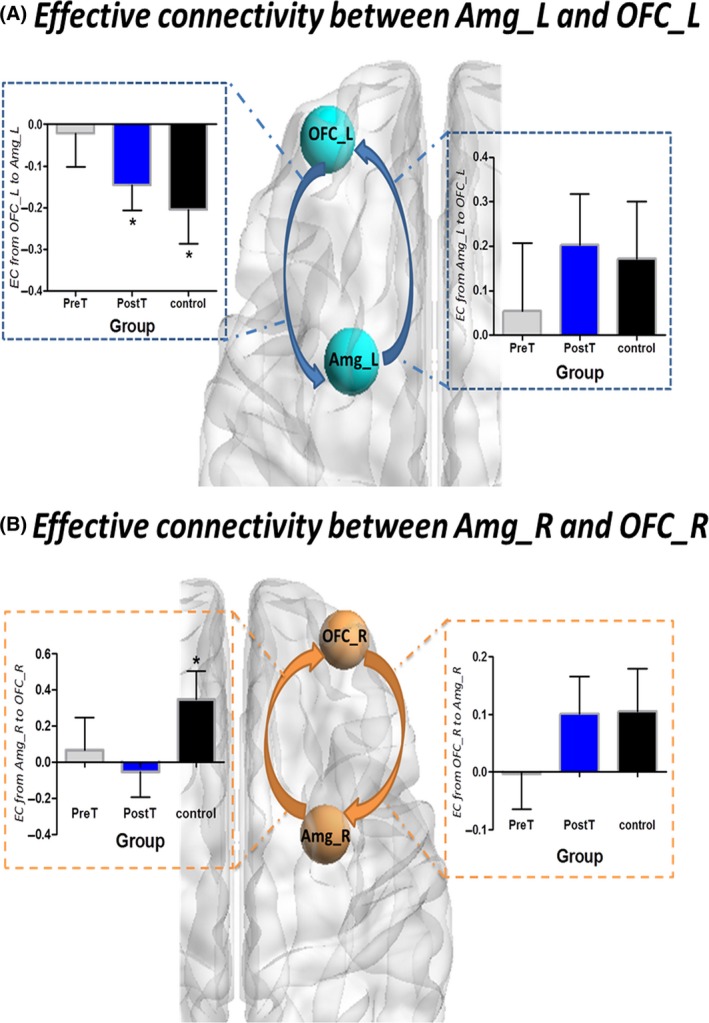
Effective connectivity between the amygdala and the OFC in the three groups (A) Effective connectivity between the left amygdala and the left OFC in the three groups. (B) Effective connectivity between the right amygdala and the right OFC in the three groups
Furthermore, we analyzed the correlations between Clinical diagnostic scores and effective connectivity between the amygdala and the OFC in the three groups. Although we did not find a significant correlation, there was a trend for a correlation between HAMD‐17 and effective connectivity from the left amygdala to the left OFC in pretreatment MDD (R = 0.1722, P = 0.0689) (Figures 6 and 7).
Figure 6.
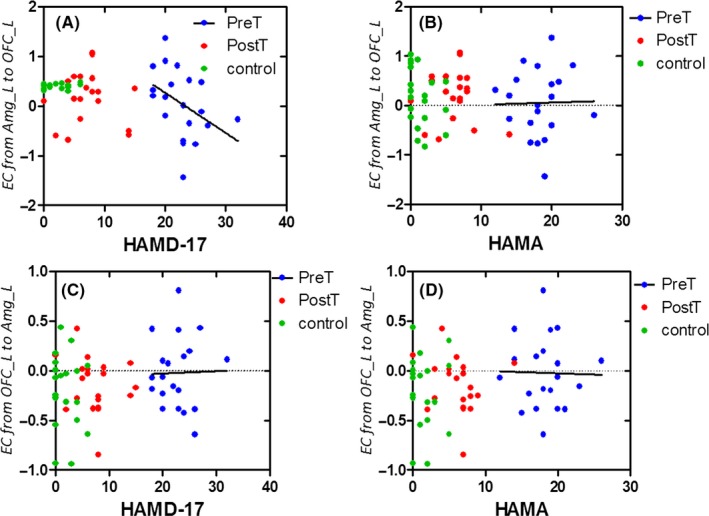
Correlation between clinical scores on the depression and effective connectivity between the left amygdala and the left OFC in the three groups. (A) Correlation between HAMD‐17 and effective connectivity from the left amygdala to left OFC in pretreatment MDD. (B) Correlation between HAMA and effective connectivity from the left amygdala to the left OFC in pretreatment MDD. (C) Correlation between HAMD‐17 and effective connectivity from the left OFC to the left amygdala in pretreatment MDD. (D) Correlation between HAMA and effective connectivity from the left OFC to the left amygdala in pretreatment MDD. HAMA, Hamilton Anxiety Scale; HAMD‐17 = 17‐item Hamilton Rating Scale for Depression
Figure 7.
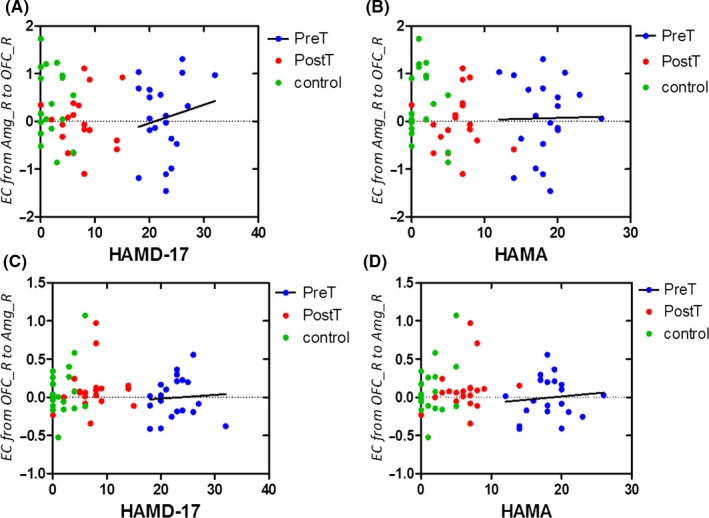
Correlation between clinical scores on the depression and effective connectivity between the right amygdala and the right OFC in the three groups. (A) Correlation between HAMD‐17 and effective connectivity from the right amygdala to the right OFC in pretreatment MDD. (B) Correlation between HAMA and effective connectivity from the right amygdala to the right OFC in pretreatment MDD. (C) Correlation between HAMD‐17 and effective connectivity from the right OFC to the right amygdala in pretreatment MDD. (D) Correlation between HAMA and effective connectivity from the right OFC to the right amygdala in pretreatment MDD.HAMA= Hamilton Anxiety Scale; HAMD‐17 = 17‐item Hamilton Rating Scale for Depression
4. DISCUSSION
As two critical regions of the emotion regulation neural systems, we studied structural and effective connectivity between the amygdala and OFC in patients with MDD at baseline and after 8 weeks of antidepressant treatment. Three principal findings emerge from this study. Firstly, we found disrupted structural connectivity of the UF in the patients with MDD, which connects the OFC and amygdala in patients with MDD. Furthermore, the FA value of these fiber tracts was correlated with the severity of the disorder. Secondly, our DCM analysis showed that the inhibition of the OFC on the activity of the amygdala was absent in patients with MDD, indicating that disrupted structural connectivity seems to be modulated through a top‐down mechanism. Finally, the right and left OFC‐amygdala connections may be affected differently by the treatment. We discovered that the abnormal contribution of the left structural and effective connectivity between the amygdala and the orbitofrontal cortex was normalized by antidepressant treatment, while the right structural and effective connectivity between the amygdala and the orbitofrontal cortex remain abnormal following the antidepressant treatment.
4.1. Impaired UF structural connectivity in major depression
We detected reduced FA of the UF in both hemispheres in patients with MDD before treatment. FA which “arises in part due to axonal and myelin barriers to water diffusion” provides valuable information to assess white matter integrity.24 Reduced FA in the patients may indicate impaired water diffusion along the left and right UF, suggesting impaired integrity of these fiber tracts. This finding is in line with previous studies, in which reduced FA in fronto‐temporal white matter tracts has been reported25 A recent meta‐analysis found that reduced FA in fronto‐temporal and fronto‐parietal white matter tracts was shared across emotional disorders.26 Adolescents with depression demonstrated reduced FA in bilateral UF, which has been suggested to be a predisposing risk factor for depression.25 In adults, carrier of the BDNF with MDD also exhibited smaller FA in the UF.27 Similar pattern of reduced FA in the UF was also observed in patients with late‐onset major depression.28 So far, more and more evidence has been accumulated for the improvement of the UF in emotion processing. An earlier study on amnestic mild cognitive impairment revealed a correlation between the FA values of the left UF and the subjects’ performance during a fearful facial expression recognition task.29 In patients with psychogenic nonepileptic seizures, UF connectivity may also be related to emotion processing.30 In the present study, we further explored the correlation between the FA of the UF and clinical severity scores of the patients. The results showed that abnormal FA values of the left UF were associated with the depression scores in pretreatment MDD, suggesting that the integrity of these fiber tracts is important for emotion regulation.
4.2. Failure of the OFC in top‐down regulating the activity of the amygdala
For the purpose to elucidate how the communication between the OFC and amygdala is affected by the impaired UF tracts, we further investigate directed information flow along these fiber tracts using spectral DCM. Distinct patterns of causal interactions between the OFC and amygdala were found in healthy controls and patients with MDD. Compared to healthy controls, the causal interactions between the OFC and amygdala were generally lower in patients, suggesting weaker influences between these two nodes.
In particular, there was a significant negative connection from OFC to amygdala in the control group, implicating the activity inhibition of the amygdala by the OFC. A negative connection in the dynamic causal model usually represents an inhibitory influence of the source node on the target region, resulting in reduction of the activation. Generally, two neural systems have been involved in emotion perception. One is a ventral system that is associated with the identification of the emotional significance of external stimuli and the production of an affective state, including the amygdala. The other is a dorsal system that is implicated in the regulation of the affective state, including the prefrontal cortex.31 The ability of frontal cortex in the dorsal system to effectively regulate the activity of limbic areas in the ventral system is crucial for adaptive emotion regulation in healthy subjects. When presented with sad films, the amygdala was activated when females were asked to react normally, while the OFC was activated during voluntarily suppression of any emotional reaction.32 Such a top‐down regulation by the OFC over the amygdala is indispensable for effective emotion regulation in healthy subjects, which has been supported by our DCM analyses on the control groups.
On the contrary, it is assumed that a failure of the frontal cortex on the regulation of the limbic system may result in dysfunctional emotion regulation observed in depression. In the current study, we found that the inhibitory regulation of the OFC on the activity of the amygdala was absent in patients with MDD, suggesting that a disrupted top‐down regulation from the OFC to the amygdala.
To recover the relationship between structural and functional abnormalities in MDD, a previous study found that the FA value of the left UF was positively correlated with resting‐state functional connectivity between the left ventrolateral PFC and the amygdala.33 Our results further demonstrated that impaired white matter integrity and reduced amygdala‐OFC functional connectivity observed in MDD may be mediated through the reduced inhibition of the OFC on the activity of the amygdala. In addition, our findings may also provide an explanation for excessive amygdala activation and negative emotion in MDD. The absence of such a top‐down regulation may lead to the patients’ incapacity to down‐regulate the activity of the amygdala, and finally result in excessive amygdala activation and strong production of negative emotion.
4.3. Asymmetric normalization effect of antidepressant treatment
Following 8 weeks of antidepressant treatment, the patients with MDD showed normalization of the abnormal OFC‐amygdala structural and effective connectivity in the left hemisphere, along with significant improvement on clinical symptoms. Our findings suggest that pathways connecting these two nodes may be core targets of the antidepressant treatment especially those in the left hemisphere. However, abnormalities in the right hemisphere persisted in MDD subjects after the antidepressant treatment regardless of symptom remission. These findings may simply implicate that the left and right hemisphere responded differently to the specific antidepressants (venlafaxine) used in the current study. To better reflect treatment response, current methods used to assess MDD remission may need to be expanded by integrating neuroimaging findings. Conditionally, the 17‐item HAMD 34, 35, 36 scale was generally used to evaluate depression severity and assess the outcomes of the antidepressant treatment. However, several neuroimaging studies have found that although many patients were clinically considered in remission, functional and structural abnormalities in their brain still persisted, indicating that using behavioral measures alone may not provide reliable definition of remission. A recent study found that anterior cingulate‐limbic white matter tracts alone—independent of clinical measures could serve as reliable predictor of treatment outcome with a high accuracy of 62%.37 In the future, with neuroimaging measures increased, combining both neuroimaging characteristics with the clinical HAMD scale may provide better assessment of treatment outcome.
Although it is evident in the current study that amygdala‐OFC structural and effective connectivity was impaired in patients with MDD at rest, we still need further to investigate whether these patients also demonstrate similar disturbances in “top‐down” influences from the OFC to amygdala in the execution of a typical emotion regulation task. In the future, we will collect fMRI data from the same subjects while they are presented with happy and sad faces. This will allow us to further confirm our findings that incapacity to control emotion may arise from OFC‐amygdala inhibition. A further limitation of this study is its sample size of the patients with MDD and matched control group, which might potentially limit the extent to which our findings can be generalized. However, the fact that we were able to detect significant group effects (and treatment) effects with a relatively small number of subjects suggests that the effect sizes are not trivial.
CONFLICTS OF INTEREST
The authors report no biomedical financial interests or potential conflicts of interest.
ACKNOWLEDGEMENTS
This study was funded by the National Nature Science Foundation of China (81301199) and supported by the National Nature Science Foundation of China (81230035), the National Clinical Research Center On Mental Disorders (2015BA13B02) and the National Key Research and Development Program of China (2017YFC0107400). We are indebted to our reviewers for guidance in clarifying and elaborating this report.
Zheng K‐Z, Wang H‐N, Liu J, et al. Incapacity to control emotion in major depression may arise from disrupted white matter integrity and OFC‐amygdala inhibition. CNS Neurosci Ther. 2018;24:1053–1062. 10.1111/cns.12800
The first two authors contributed equally to this work.
Contributor Information
Hong‐Bing Lu, Email: luhb@fmmu.edu.cn.
Bao‐Juan Li, Email: libjuan@163.com.
REFERENCE
- 1. Song Z, Zhang M, Huang P. Aberrant emotion networks in early major depressive disorder patients: an eigenvector centrality mapping study[J]. Transl Psychiat. 2016;6:e819. [DOI] [PMC free article] [PubMed] [Google Scholar]
- 2. Zhang B, Li M, Qin W, et al. Altered functional connectivity density in major depressive disorder at rest.[J]. Eur Arch Psychiatry Clin Neurosci. 2016;266:239. [DOI] [PubMed] [Google Scholar]
- 3. Joormann J, Stanton CH. Examining emotion regulation in depression: a review and future directions[J]. Behav Res Ther. 2016;86:35‐49. [DOI] [PubMed] [Google Scholar]
- 4. Wu H, Sun H, Wang C, et al. Abnormalities in the structural covariance of emotion regulation networks in major depressive disorder.[J]. J Psychiatr Res. 2017;84:237. [DOI] [PubMed] [Google Scholar]
- 5. Ehring T, Tuschencaffier B, Schnülle J, Fischer S, Gross JJ. Emotion regulation and vulnerability to depression: spontaneous versus instructed use of emotion suppression and reappraisal.[J]. Emotion. 2010;10:563‐572. [DOI] [PubMed] [Google Scholar]
- 6. Joormann J, Gotlib IH. Emotion regulation in depression: relation to cognitive inhibition[J]. Cogn Emot. 2010;24:281. [DOI] [PMC free article] [PubMed] [Google Scholar]
- 7. Fournier JC, Keener MT, Mullin BC, et al. Heterogeneity of amygdala response in major depressive disorder: the impact of lifetime subthreshold mania.[J]. Psychol Med. 2013;43:293. [DOI] [PMC free article] [PubMed] [Google Scholar]
- 8. Konduru N. Resting‐State Functional Connections of the Amygdala in Patients with Major Depressive Disorder[J]. Neuroscience. 2013. [Google Scholar]
- 9. Rive MM, Mocking RJ, Koeter MW, et al. State‐dependent differences in emotion regulation between unmedicated bipolar disorder and major depressive disorder[J]. Jama Psychiat. 2015;72:687. [DOI] [PubMed] [Google Scholar]
- 10. Miller CH, Hamilton JP, Sacchet MD, Gotlib IH. Meta‐analysis of functional neuroimaging of major depressive disorder in youth[J]. Jama Psychiat. 2015;72:1045. [DOI] [PMC free article] [PubMed] [Google Scholar]
- 11. Phillips ML, Ladouceur CD, Drevets WC. A neural model of voluntary and automatic emotion regulation: implications for understanding the pathophysiology and neurodevelopment of bipolar disorder[J]. Mol Psychiatr. 2008;13:829, 833. [DOI] [PMC free article] [PubMed] [Google Scholar]
- 12. Sladky R, Höflich A, Küblböck M, et al. Disrupted effective connectivity between the amygdala and orbitofrontal cortex in social anxiety disorder during emotion discrimination revealed by dynamic causal modeling for fMRI[J]. Cereb Cortex. 2015;25:895. [DOI] [PMC free article] [PubMed] [Google Scholar]
- 13. Versace A, Thompson WK, Zhou D, et al. Abnormal left and right amygdala‐orbitofrontal cortical functional connectivity to emotional faces: state versus trait vulnerability markers of depression in bipolar disorder.[J]. Biol Psychiatry. 2010;67:422‐431. [DOI] [PMC free article] [PubMed] [Google Scholar]
- 14. Catani M, Thiebaut DSM. A diffusion tensor imaging tractography atlas for virtual in vivo dissections[J]. Cortex. 2008;44:1105‐1132. [DOI] [PubMed] [Google Scholar]
- 15. Rj VDH, Skipper LM, Klobusicky E, Olson IR. Dissecting the uncinate fasciculus: disorders, controversies and a hypothesis.[J]. Brain. 2013;136:1692. [DOI] [PMC free article] [PubMed] [Google Scholar]
- 16. Gaffan D, Wilson CR. Medial temporal and prefrontal function: recent behavioural disconnection studies in the macaque monkey.[J]. Cortex. 2008;44:928‐935. [DOI] [PubMed] [Google Scholar]
- 17. Ross ED. Sensory‐specific amnesia and hypoemotionality in humans and monkeys: gateway for developing a hodology of memory[J]. Cortex. 2008;44:1010‐1022. [DOI] [PubMed] [Google Scholar]
- 18. Cullen KR, Klimesdougan B, Muetzel R, et al. Altered white matter microstructure in adolescents with major depression: a preliminary study.[J]. J Am Acad Child Adolesc Psychiatry. 2010;49:173‐183. [DOI] [PMC free article] [PubMed] [Google Scholar]
- 19. Zhang A, Leow A, Ajilore O, et al. Quantitative tract‐specific measures of uncinate and cingulum in major depression using diffusion tensor imaging[J]. Neuropsychopharmacology. 2011;37:959‐967. [DOI] [PMC free article] [PubMed] [Google Scholar]
- 20. Friston KJ. Functional and effective connectivity in neuroimaging: a[J]. Hum Brain Mapp. 1993;2:56‐78. [Google Scholar]
- 21. Friston KJ, Harrison L, Penny W. Dynamic causal modelling[J]. NeuroImage. 2003;19:1273‐1302. [DOI] [PubMed] [Google Scholar]
- 22. Szczepanik J, Nugent AC, Drevets WC, Khanna A, Zarate CA, Furey ML. Amygdala response to explicit sad face stimuli at baseline predicts antidepressant treatment response to scopolamine in major depressive disorder[J]. Psychiat Res. 2016;254:67‐73. [DOI] [PMC free article] [PubMed] [Google Scholar]
- 23. Fales CL, Barch DM, Rundle MM, et al. Antidepressant treatment normalizes hypoactivity in dorsolateral prefrontal cortex during emotional interference processing in major depression.[J]. J Affect Disorders. 2009;112:206. [DOI] [PMC free article] [PubMed] [Google Scholar]
- 24. Farrell JAD, Landman BA, Jones CK, et al. Effects of SNR on the accuracy and reproducibility of DTI‐derived fractional anisotropy, mean diffusivity, and principal eigenvector measurements at 1.5T[J]. J Magn Reson Imaging JMRI. 2007;26:756. [DOI] [PMC free article] [PubMed] [Google Scholar]
- 25. Lewinn KZ, Connolly CG, Wu J, et al. White matter correlates of adolescent depression: structural evidence for frontolimbic disconnectivity.[J]. J Am Acad Child Adolesc Psychiatry. 2014;53:899‐909. e7. [DOI] [PMC free article] [PubMed] [Google Scholar]
- 26. Jenkins LM, Barba A, Campbell M, et al. Shared white matter alterations across emotional disorders: a voxel‐based meta‐analysis of fractional anisotropy:[J]. Neuroimage Clin. 2016;12:1022‐1034. [DOI] [PMC free article] [PubMed] [Google Scholar]
- 27. Carballedo A, Amico F, Ugwu I, et al. Reduced fractional anisotropy in the uncinate fasciculus in patients with major depression carrying the met‐allele of the Val66Met brain‐derived neurotrophic factor genotype[J]. Eur Psychiat. 2013;28:1. [DOI] [PubMed] [Google Scholar]
- 28. Dalby RB, Frandsen J, Chakravarty MM, et al. Depression severity is correlated to the integrity of white matter fiber tracts in late‐onset major depression[J]. Psychiat Res. 2010;184:38‐48. [DOI] [PubMed] [Google Scholar]
- 29. Fujie S, Namiki C, Nishi H, et al. The Role of the uncinate fasciculus in memory and emotional recognition in amnestic mild cognitive impairment[J]. Dement Geriatr Cogn Disord. 2008;26:432‐439. [DOI] [PubMed] [Google Scholar]
- 30. Hernando KA, Szaflarski JP, Hoef LWV, Lee S, Allendorfer JB. Uncinate fasciculus connectivity in patients with psychogenic nonepileptic seizures: a preliminary diffusion tensor tractography study[J]. Epilepsy Behav. 2015;45:68‐73. [DOI] [PubMed] [Google Scholar]
- 31. Phillips ML, Drevets WC, Rauch SL, Lane R. Neurobiology of emotion perception I: the neural basis of normal emotion perception.[J]. Biol Psychiat. 2003;54:504. [DOI] [PubMed] [Google Scholar]
- 32. Lévesque J, Eugène F, Joanette Y, et al. Neural circuitry underlying voluntary suppression of sadness.[J]. Biol Psychiat. 2003;53:502‐510. [DOI] [PubMed] [Google Scholar]
- 33. Steffens DC, Taylor WD, Denny KL, Bergman SR, Wang L. Structural integrity of the uncinate fasciculus and resting state functional connectivity of the ventral prefrontal cortex in late life depression[J]. PLoS ONE. 2011;6:e22697. [DOI] [PMC free article] [PubMed] [Google Scholar]
- 34. Hamilton M. A rating scale for depression[J]. J Neurol Neurosurg Psychiatry. 1960;23:56. [DOI] [PMC free article] [PubMed] [Google Scholar]
- 35. Zung WW. A self‐rating depression scale.[J]. Arch Gen Psychiatry. 1965;12:63. [DOI] [PubMed] [Google Scholar]
- 36. Zung WW, Richards CB, Short MJ. Self‐rating depression scale in an outpatient clinic. Further validation of the SDS[J]. Arch Gen Psychiatry. 1965;13:508. [DOI] [PubMed] [Google Scholar]
- 37. Korgaonkar MS, Williams LM, Song YJ, Usherwood T, Grieve SM. Diffusion tensor imaging predictors of treatment outcomes in major depressive disorder[J]. Br J Psychiatry. 2014;205:321. [DOI] [PubMed] [Google Scholar]