Summary
Aims
Huntington's disease (HD) is a neurodegenerative disorder characterized by progressive abnormalities in cognitive function, mental state, and motor control. HD is characterized by a failure in brain energy metabolism. It has been proposed that monocarboxylates, such as lactate, support brain activity. During neuronal synaptic activity, ascorbic acid released from glial cells stimulates lactate and inhibits glucose transport. The aim of this study was to evaluate the expression and function of monocarboxylate transporters (MCTs) in two HD models.
Methods
Using immunofluorescence, qPCR, and Western blot analyses, we explored mRNA and protein levels of MCTs in the striatum of R6/2 animals and HdhQ7/111 cells. We also evaluated MCT function in HdhQ7/111 cells using radioactive tracers and the fluorescent lactate sensor Laconic.
Results
We found no significant differences in the mRNA or protein levels of neuronal MCTs. Functional analyses revealed that neuronal MCT2 had a high catalytic efficiency in HD cells. Ascorbic acid did not stimulate lactate uptake in HD cells. Ascorbic acid was also unable to inhibit glucose transport in HD cells because they exhibit decreased expression of the neuronal glucose transporter GLUT3.
Conclusion
We demonstrate that stimulation of lactate uptake by ascorbic acid is a consequence of inhibiting glucose transport. Supporting this, lactate transport stimulation by ascorbic acid in HD cells was completely restored by overexpressing GLUT3. Therefore, alterations in GLUT3 expression could be responsible for inefficient use of lactate in HD neurons, contributing to the metabolic failure observed in HD.
Keywords: glucose, MCT, monocarboxylate
1. INTRODUCTION
Huntington's disease (HD) is a neurodegenerative disorder which exhibits an autosomal dominant inheritance.1, 2 HD is characterized by widespread neurodegeneration with preferential deterioration of medium‐sized spiny neurons (MSNs) in the striatum. It is caused by an unusual expansion of the trinucleotide sequence cytosine‐adenosine‐guanosine (CAG) in exon 1 of the huntingtin gene.3 In affected people, the triplet is present more than 35 times.4 The huntingtin gene codes for a protein called huntingtin (Htt). This is a soluble 384‐kDa protein, essential for embryogenesis, and is ubiquitously expressed in moderate amounts in the nervous system as well as in other systems.5 Wild‐type (WT) Htt has an important role in the intracellular transport of vesicles, organelles, and trafficking of proteins to the cell surface. It also plays a role as a transcriptional regulatory element.6
Huntington's disease is characterized by a failure in brain energy metabolism. Positron emission tomography studies show drastic reductions in glucose metabolism in the basal ganglia and cerebral cortex of symptomatic HD patients.7 Reduced TCA cycle activity and oxidative phosphorylation,8 decreased glyceraldehyde 3‐phosphate dehydrogenase activity,9 impaired oxidative phosphorylation enzyme activity10 and downregulation of peroxisome proliferator‐activated receptor‐γ11 have also been described. Decreased expression of the neuronal glucose transporter GLUT3 also occurs in HD.12, 13
The brain is a metabolically active organ. Special attention has been focused on the role of monocarboxylates in supporting brain activity, in particular the Astrocyte‐Neuron Lactate Shuttle (ANLS).14 The ANLS proposes that under resting conditions, neurons consume glucose, whereas during synaptic activity, they preferentially consume lactate. The key to this energetic coupling is the metabolic activation that occurs in astrocytes. Glutamate released from neurons stimulates glucose uptake,15 glycolysis,16 lactate release,15 and ascorbic acid depletion in astrocytes.17 According to our data, ascorbic acid may function as a metabolic switch by inhibiting glucose consumption during episodes of glutamatergic synaptic activity18, 19 and stimulating lactate uptake in neurons.18, 20 The monocarboxylate transporter MCT2 is essential for neuronal lactate uptake.21, 22 In HD, the ascorbic acid metabolic switch and ANLS do not function correctly.23 Indeed, inhibited uptake of lactate and other monocarboxylates did not affect synaptic activity in neurons expressing mutant Htt.23 The first aim of this study was to examine the expression, function, and modulation of monocarboxylate transporters (MCTs) by ascorbic acid in mouse and cellular models of HD.
The MCTs correspond to gene SLC16 family.24 MCT1, MCT2, MCT3, and MCT4 show affinity for monocarboxylates.24, 25 MCT1 is highly expressed in postnatal periods in all cell types of the brain.26 In adult brain, the expression of MCT1 decreases in neurons and increases in astrocytes.27 MCT1 is also expressed in endothelial cells of the blood‐brain barrier, choroid plexuses, and ependymal cells.28 MCT2 is a high‐affinity lactate transporter, and its expression occurs mainly in neurons, increasing with neuronal maturation.29 MCT4 has been extensively characterized in muscle and testis, where it was involved with lactate efflux.30 In brain, MCT4 is localized exclusively in astrocytes.26
2. METHODS
2.1. Animals
All experiments were conducted in accordance with the Chilean Government's Manual of Bioethics and Biosafety (CONICYT: The Chilean Commission of Scientific and Technological Research, Santiago, Chile) and according to the guidelines established by the Animal Protection Committee of the Universidad Austral de Chile. R6/2 mice (male and female) were obtained from the breeding colony maintained at the University of California, Los Angeles (UCLA). All experimental procedures were carried out in accordance with the National Institute of Health Guide for the Care and Use of Laboratory Animals and were approved by the Institutional Animal Care and Use Committee at UCLA. Animals were maintained in a 12:12‐hour light: dark cycle and supplied with commercial food pellets and water ad libitum. Studies were performed on two age groups of R6/2 mice and with age‐matched WT control mice, based on the development of the overt motor phenotype. The first group of animals was tested before the appearance of overt behavioral symptoms at 3‐4 weeks. The second group was tested after the appearance of the full behavioral phenotype at 8‐12 weeks. Efforts were made to minimize the number of animals used for experimental purposes.
2.2. Cell cultures
Mouse striatal STHdhQ7 and STHdhQ111 cells (Q7 and Q111 cells;31 were grown using DMEM (Dulbecco's modified Eagle's medium; United States Biological) containing 10% fetal bovine serum (FBS: Hyclone, Logan, UT, USA), 50 U/mL penicillin, 50 mg/mL streptomycin, 50 ng/mL amphotericin B, and 2 mmol/L l‐glutamine (Nalgene, Rochester, NY, USA). Glioblastoma C6 cells (CCL‐107™ ATCCR) were cultured in DMEM‐F12 supplemented with 10% FBS, 50 U/mL penicillin, 50 mg/mL streptomycin, 50 ng/mL fungizone, and 2 mmol/L l‐glutamine. Cells were maintained at 70% confluence, washed with 0.1 mol/L phosphate buffer (PBS, pH 7.4, 320 mOsm), and treated with 0.25% trypsin‐EDTA (w/v) before being seeded at a density of 3‐4 × 10⁵ cells/cm2 for the respective experiments.
2.3. Uptake assays using radiolabeled lactate
Uptake assays were performed in 500 μL of incubation buffer (IB contains 15 mmol/L HEPES (pH 7.4), 135 mmol/L NaCl, 5 mmol/L KCl, 1.8 mmol/L CaCl2, 0.8 mmol/L MgCl2) containing 0.2‐0.5 μCi of 2‐deoxy‐D‐[1,2‐(N)3H]glucose (26.2 Ci/mmol, Dupont NEN, Boston, MA, USA), 0.2‐0.5 μCi of D‐3‐O‐ {methyl‐3H} – glucose (26.2 Ci/mmol, Dupont NEN, Boston, MA, USA) or 0.1‐0.2 μCi of L‐[U‐14C]‐lactic acid (50‐180 mCi/mmol, Amersham Biosciences, Piscataway, NJ, USA). Cells were dissolved in 200 mL of lysis buffer (10 mmol/L Tris–HCl (pH 8.0), 0.2% SDS), and the incorporated radioactivity was measured by liquid scintillation spectrometry. For ascorbic acid effect assays (intracellular ascorbic acid), cells were pre‐incubated in an IB containing ascorbic acid and 0.1 mmol/L dithiothreitol (DTT) for 40‐60 minutes. Finally, 0.5 mmol/L DOG uptake was measured over a 15‐second period at RT.
2.4. Biotinylation of surface proteins
Biotinylation assays were performed as previously was described by Covarrubias‐Pinto et al12 Surface proteins were labeled using Sulfo‐NHS‐LC‐Biotin (Thermo Fisher Scientific, Rockford, IL, USA). Labeled cells were homogenized in 200 μL of buffer RIPA (50 mmol/L Tris‐HCl, 150 mmol/L NaCl, 1% NP‐40, 12 mmol/L sodium deoxycholate, 1% SDS, 5 mmol/L EDTA, 0.3% Triton X‐100, pH 7.4) and protease inhibitors and then precipitated by continuous mixing with 40 μL of immobilized NeutrAvidin Protein (Thermo Fisher Scientific, Rockford, IL, USA) for 4 hours at 4°C. The resin‐bound complex was boiled in SDS‐PAGE sample buffer. Samples were resolved by 10% (w/v) SDS‐polyacrylamide gels, and Western blot analysis was performed.
2.5. Real‐time quantitative reverse transcription PCR
qPCR analyses were performed as previously described by Acuña et al23 Total RNA from each sample was extracted with the EZNA Total RNA Kit II (Omega Bio‐Tek, Norcross, GA, USA) according to the manufacturer's instructions. cDNA was synthesized using the Maxima Universal First Strand cDNA Synthesis Kit (Thermo Fisher Scientific, Rockford, IL, USA), and PCR was performed using the Maxima SYBR Green qPCR Master Mix (Thermo Fisher Scientific, Rockford, IL, USA). The primers used are described in Table 1.
Table 1.
Primers used in RT‐qPCR analyses
| Forward | Reverse | |
|---|---|---|
| MCT1 | 5′ gca acg acc agt gaa gta tc 3′ | 5′ gca acc aga cag aca acc a 3′ |
| MCT2 | 5′ ggg ctg ggt cgt agt ctg t 3′ | 5′ atc caa gcg atc tga ctg gag 3′ |
| MCT4 | 5′ cac ggg ttt ctc cta cgc c 3′ | 5′ gct gta gcc aat ccc aaa ctc 3′ |
| GAD67 | 5′ cca cca agg ttc tgg att tcc 3′ | 5′ gta ctt cag ggt gtc tct aca gt 3′ |
| β‐ACTIN | 5′ tac cac cat gta ccc agg ca 3′ | 5′ ctc agg agg agc aat gat ctt gat 3′ |
| GFAP | 5′ acc agc tta cgg cca aca g 3′ | 5′ cca gcg att caa cct ttc tct 3′ |
2.6. Western blot analysis
Total protein extracts were obtained from R6/2 mice striatum or cell cultures (STHdhQ7, STHdhQ111, C6). Biotinylated proteins were obtained from cell cultures (see above). Dissected striata were homogenized in buffer A, 2 mg/mL pepstatin A, 2 mg/mL leupeptin, and 2 mg/mL aprotinin) and sonicated three to five times for 10 seconds at 4°C. Proteins were resolved by SDS‐PAGE (70 mg per lane for total protein extract) in a 10% (w/v) polyacrylamide gel, transferred to polyvinylidene difluoride membranes (0.45‐mm pore; Amersham Pharmacia Biotech., Piscataway, NJ, USA), and probed with anti‐MCT1 (1:1000, ab3538P, Millipore, USA), anti‐MCT2 (1:1000, ab3542, Millipore, USA) anti‐MCT4 (1:1000, ab3314P formerly ab3546P, Millipore, USA) and anti‐β actin antibodies (1:1000, sc‐81178, Santa Cruz Biotechnology, Santa Cruz, CA, USA). The reaction was visualized using anti‐goat, anti‐mouse HRP‐conjugated antibodies (1:10 000, PA1‐86326 and 31430, Thermo Scientific, Rockford, IL, USA), and the enhanced chemiluminescence Western blot method (Amersham Biosciences, Pittsburgh, PA, USA).
2.7. Immunofluorescence analysis
Cells grown on poly‐L‐lysine‐coated coverslips were fixed with HistoChoice Tissue Fixative (Sigma‐Aldrich). Mouse brains were dissected and fixed immediately by immersion in 4% paraformaldehyde in 0.1 mol/L phosphate buffer (pH 7.4). Samples were dehydrated in graded alcohol solutions, embedded in paraffin, and incubated overnight with anti‐MCT1 (1:100, ab3538P, Millipore, USA), anti‐MCT2 (1:100, ab3542, Millipore, USA), anti‐MCT4 (1:100, ab3314P formerly ab3546P, Millipore, USA), anti‐Htt (1:100, MAB2166, Chemicon International, Inc.) Samples were washed and incubated with anti‐rabbit, anti‐goat, or anti‐mouse IgG‐Alexa Fluor 488, IgG‐Alexa Fluor 568 or IgG‐Alexa Fluor 633 (1:300, A‐11055, A‐21202, A11057, A21070, Invitrogen) and propidium iodide (1.7 mg/mL, Sigma‐Aldrich), TO‐PRO‐3 (1:1000, T3605, Lifetech) and then subsequently washed and mounted. An inverted Olympus FluoView 1000 confocal microscope was used to examine the samples.
2.8. Lactate uptake using live cell imaging
Lactate uptake was visualized using a H+ sensitive probe, BCECF, or lactate sensor, Laconic. Live cell recordings were performed at room temperature in incubation buffer (IB). Laconic experiments were carried out 24 to 48 hours post transfection. The sensor was excited at 440 nm, and emission was detected at 480/30 nm (mTFP) and 550/30 nm (Venus). The mTFP/Venus ratio was calculated for each time frame Ri and was normalized by the initial ratio Ri. The slope was obtained from the ratio during the first 60 seconds after 5 mmol/L l‐lactate was added to the buffer in the presence or absence of 1 μmol/L AR‐C155858 (AR‐C; Ki for MCT1: 2.3 nmol/L and Ki for MCT2: 10 nmol/L). BCECF‐AM was kindly provided by Dr. Rafael Burgos (Instituto de Farmacología, Facultad de Ciencias Veterinarias, Universidad Austral de Chile). BCECF experiments were performed after a 60‐minute incubation period in IB 0.1 mmol/L DTT in the presence or absence of 1 mmol/L ascorbic acid. BCECF‐AM was loaded 20 minutes prior to recording the final concentration of 100 nmol/L. The slope was calculated from BCECF signal decay during the first 100 seconds after 5 mmol/L l‐lactate addition.
2.9. Plasmids and transfection
Plasmid constructs, GLUT3‐EGFP, encoding full‐length rat GLUT3 fused at the C termini to EGFP were kindly provided by Dr. J.P. Bolaños (Departamento de Bioquímica y Biología Molecular, Universidad de Salamanca, Spain). GLUT3‐mCherry, encoding full‐length GLUT3 fused at the C termini to mCherry (red fluorescent protein) was subcloned from GLUT3‐EGFP to pcDNA 3.1‐mCherry using Xba and XhoI restriction enzymes. Laconic was acquired from Addgene (#44238). Cells maintained in Optimem defined media were transfected using Lipofectamine 2000 (Gibco Invitrogen Corporation, Grand Island, NY, USA).
2.10. Statistical analyses
Statistical comparison between two or more groups of data was respectively performed using Student's t test or analysis of variance (ANOVA) followed by the Bonferroni posttest. Linear and nonlinear regressions were calculated using SigmaPlot v9.0 software (only correlations >0.8 were accepted).
3. RESULTS
We examined MCT expression in R6/2 mice to determine why synaptically active striatal HD neurons are not dependent on monocarboxylate uptake.23 R6/2 is a transgenic mouse that carries the HD gene.32 Similar to other HD mouse models, R6/2 exhibits motor symptoms (symptomatic stage) and impaired brain energy metabolism which is detectable in presymptomatic stages.23, 33, 34 RT‐qPCR analyses did not show changes in MCT1 and 2 mRNA levels in symptomatic and presymptomatic R6/2 mice (Figure 1A,D). MCT1 was mainly localized in structures that appeared to be blood vessels (Figure 1B) and ependymal cells (Figure 1C) in immunofluorescence analyses. MCT2 was localized in striatal neurons (Figure 1E) and also in pyramidal neurons from CA1 hippocampus (Figure 1F). MCT1 expression has been described in ependymal cells, endothelial cells, and the end feet of astrocytes.25 Additionally, MCT2 expression has been detected in neuronal cells throughout the brain,22 corroborating the high specificity of our antibodies. Thus, before HD onset and during symptomatic stages, MCT expression in R6/2 mice would be similar to WT mice.
Figure 1.
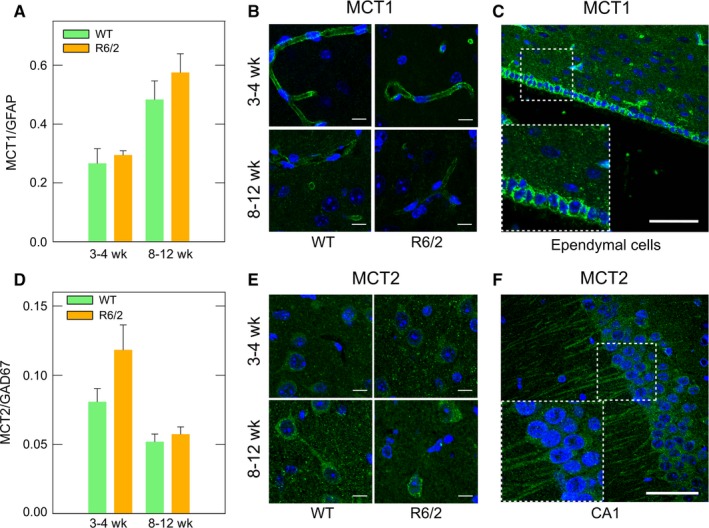
Monocarboxylate transporter expression is unaltered in R6/2 mice. (A,D) Real‐time qPCR analyses for MCT1 and MCT2 from mRNAs of striatum from presymptomatic (3‐4 wk old) and symptomatic (8‐12 wk old) R6/2 mice. Striatum samples from littermates (WT) were used as controls. Results were normalized using specific primers to amplify mRNAs coding for GAD67 (striatal neuronal marker) and GFAP (astroglial marker). Analysis of variance (ANOVA) followed by the Bonferroni posttest, n = 3. (B,E) Immunofluorescence analyses for MCT1 (green) and MCT2 (green) in the striatum of presymptomatic and symptomatic R6/2 mice. Representative images of four independent experiments. Nuclei were stained using TO‐PRO‐3. Scale bar is 10 μm. (C,F) Specific reactivity of MCT antibodies in ependymal cells and hippocampal neurons. Nuclei were stained using TO‐PRO‐3. Scale bar is 50 μm
To study the possibility that neuronal lactate transport is impaired in HD, we studied MCT expression and function in STHdhQ7 and STHdhQ111 cell lines. STHdhQ is an immortalized striatal neuron cell line obtained from HD knock‐in mouse embryos that accurately express endogenous levels of normal and mutant huntingtin (Htt). WT STHdhQ7 cells express an Htt containing 7 glutamine repeats, while mutant STHdhQ111 cells express an Htt containing 109 glutamine repeats.31 We will refer to WT and mutant cells as Q7 and Q111 cells, respectively. As for R6/2 mice, qPCR analyses showed no significant differences in MCT1 and MCT2 mRNA levels between Q111 and Q7 cells (Figure 2A,D). The same behavior was observed by Western blot analyses (Figure 2B,E). Immunofluorescence analyses showed immunoreactivity throughout the cell body (Figure 2C,F). MCT1 immunoreactivity was more abundant at the plasma membrane in both Q7 and Q111 cells (Figure 2C), while MCT2 exhibited cytoplasmic immunoreactivity (Figure 2F).
Figure 2.
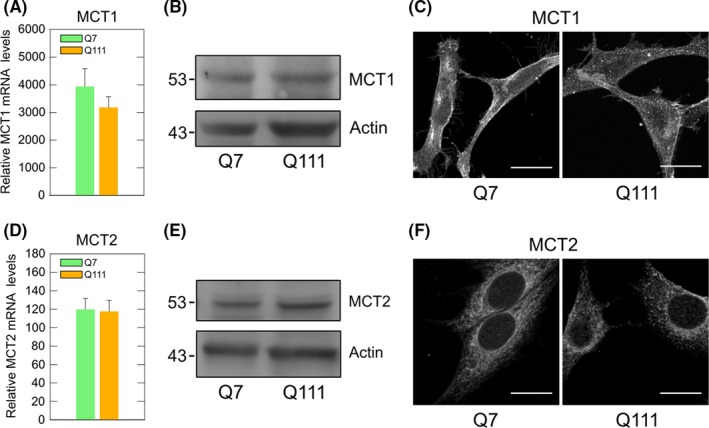
Monocarboxylate transporter expression is unaltered in cellular models of Huntington's disease. (A,D) Real‐time qPCR analyses for MCT1 and MCT2 from mRNA obtained from Q7 and Q111 cells. The results were normalized using specific primers to amplify mRNAs coding for β‐actin. Student's t test, n = 3. (B,E) Western blot assay for MCT1 and MCT2 from total protein extracts of Q7 and Q111 cells. Results were normalized using a specific antibody for β‐actin. (C,F) Immunofluorescence analyses for MCT1 (green) and MCT2 (green) in Q7 and Q111 cells. Representative images of four independent experiments. Scale bar is 20 μm
The expression of monocarboxylate transporters in Q7 and Q111 cells was confirmed by functional assays using radiolabeled lactate or the fluorescence lactate sensor Laconic (Figure 3). In both Q7 and Q111 cells, lactate transport was linear for the first 10 seconds, with a plateau being reached at 15 seconds (Figure 3C). The initial velocity for lactate transport was 14.64 pmol/min × 106 cells (Q7) and 14.58 pmol/min × 106 cells (Q111). Additional assays were performed to determine kinetic parameters (Figure 3A,B). Both Q7 and Q111 cells exhibited at least two kinetic components for lactate transport. The second component exhibited an apparent Vmax of 697.7 (Q7) and 528 (Q111) nmoles/106 cell × min. The apparent Kms for this kinetic component were 54.7 (Q7) and 32.5 (Q111) mmol/L which are comparable to MCT4 Km values.30, 35 Lactate transport in Q cells was almost completely abolished by AR‐C (Figure 3D‐F), an inhibitor for MCT1 and MCT2, indicating that MCT4 contributes poorly to lactate uptake in those cells. The first component showed an apparent Vmax of 34.4 (Q7) or 34.28 (Q111) nmoles/106 cell × min. Surprisingly, the apparent Km for the first component in Q111 cells (2.34 mmol/L) was lower than that for Q7 cells (3.52 mmol/L), implying an increased affinity for lactate in HD cells. Those Km values are attributable to MCT1 and MCT2.20, 30, 35, 36 The apparent Km for MCT1 expressed in Xenopus oocytes is 3.5 mmol/L36 and 0.5 mmol/L for MCT2.37 Therefore, an increased affinity (lower Km) could indicate an increased MCT2 activity in Q111 cells. Increased MCT2 activity could be explained by an increased number of transporters at the cellular surface or by an increase in transporter efficiency (kcat). In this case, we observed an increased Km without changes in Vmax. This can be interpreted as an increased efficiency without changes in the number of molecules at the cellular surface. This idea was corroborated by biotinylation assays. No changes were seen in MCT2 levels at the plasma membrane when comparing Q7 and Q111 cells (Figure 4). Therefore, the number of transporters at the cellular surface is not altered, implying increased MCT2 efficiency.
Figure 3.
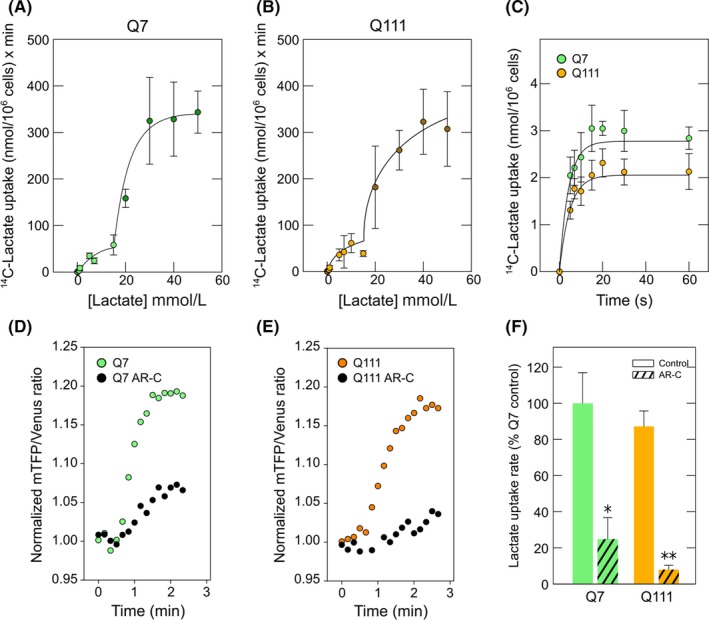
Kinetic properties of lactate transport revealed increased lactate transport efficiency in cellular models of Huntington's disease. (A) Dose‐response curve of 14C‐lactate transport in Q7 (10‐s uptake assay, 4°C). Double rectangular hyperbolas were fitted to the data using nonlinear regression, n = 3. (B) Dose‐response curve of 14C‐lactate uptake in Q111 (10‐s uptake assay, 4°C). Double rectangular hyperbolas were fitted to the data using nonlinear regression, n = 3. (C) Time course uptake for 14C‐lactate (0.1 mmol/L, 4°C) in Q cells. Simple exponential curve of two parameters was fitted to data using nonlinear regression (R > 0.99). (D) and (E) Time course of lactate uptake rate in cells expressing FRET‐based laconic sensor in the presence or absence of AR‐C155858 (AR‐C). Data correspond to a representative experiment in Q7 (D) and Q111 (E) cells. (F) Bar plots for lactate uptake rate in Q7 and Q111 cells expressing FRET‐based laconic sensor. The rate was obtained from the slope of mTFP/Venus ratio per minute during the application of 5 mmol/L lactate in the presence or absence of AR‐C155858 (AR‐C). Data represent the mean ± SD from 6 cells (Q7) and 13 cells (Q111) from 4 independent experiments. Student's t test, *P: 0.05, **P: 0.01
Figure 4.
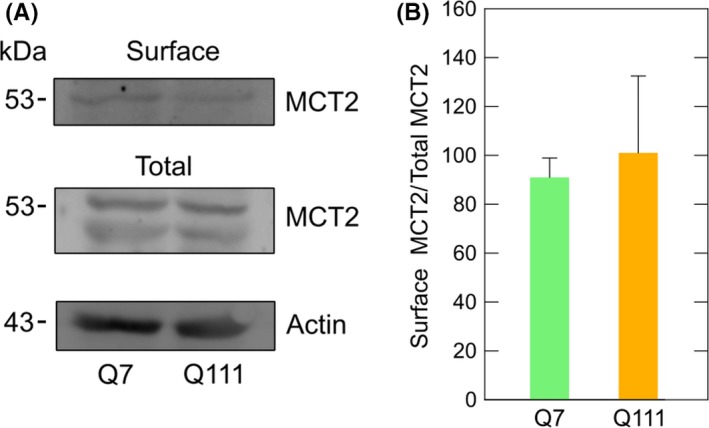
Monocarboxylate transporter type‐2 expression at the cellular surface is not altered in cellular models of Huntington's disease. (A) Western blot analyses for MCT2 from biotinylated and total proteins from Q7 and Q111 cells. Results were normalized using a specific antibody for β‐actin in total protein extracts obtained from Q7 and Q111 cells. (B) Bar plots for densitometric scanning analysis of the MCT2 Western blot shown in A. Student's t test, n = 3
ANLS does not seem to be working correctly in HD. Indeed, synaptic activity in neurons expressing mutant Htt is not affected when monocarboxylate uptake is inhibited.23 However, HD neurons could express a highly efficient MCT2. Lactate uptake and glucose uptake cannot occur simultaneously.18 In WT neurons, lactate uptake is possible because glucose uptake is inhibited by ascorbic acid during synaptic activity.19 Thus, ascorbic acid can stimulate lactate uptake in WT neurons (Figure 5A).20 This effect was not observed in cells expressing mutant Htt (Figure 5A). Lactate is transported across cell membranes by diffusional, saturable cotransport with protons, mediated by MCTs. We also observed an ascorbic acid‐stimulated increase in the proton concentration in Q7 cells without changes in Q111 cells (Figure 5B‐D). Ascorbic acid inhibits glucose uptake by a GLUT3‐dependent mechanism38 and HD neurons and Q111 cells exhibit a decrease in GLUT3 expression.12 Therefore, we reasoned that the failure in ascorbic acid‐dependent stimulation of lactate uptake could be a consequence of inhibited glucose transport. In other words, in HD cells ascorbic acid is unable to inhibit glucose uptake, and therefore, it is unable to stimulate lactate transport. To test this hypothesis, we used C6 cells (brain glioma) which endogenously express GLUT3.38 C6 cells also express MCT1 and MCT2, demonstrated by Western blot and immunofluorescence analyses (Figure 6A,B). MCTs expressed in C6 cells were functional, which was corroborated by kinetic analyses using radiolabeled lactate (Figure 6C,D). Lactate transport was linear for at least the first 10 seconds (Figure 6C). Lactate uptake in C6 cells was saturable and also exhibited two kinetic components (Figure 6D). The Vmax was 18.5 ± 2.4 pmol/106 cells × min for the first component and 110.4 ± 7 pmol/106 cell × min for the second component. The apparent Km for the first component was 2.4 ± 1 mmol/L which is comparable with MCT1 plus MCT2 activity. The second kinetic component Km was 56 ± 2 mmol/L indicating MCT4 activity. As mentioned above, intracellular ascorbic acid can inhibit glucose uptake in cells expressing GLUT338 (Figure 7A,B). Thus, the ablation of GLUT3 expression using a specific shRNA (fully characterized in Beltrán et al38) was sufficient to abolish ascorbic acid‐dependent glucose uptake inhibition. Accordingly, lactate uptake was stimulated by intracellular ascorbic acid only in cells expressing GLUT3 (Figure 7C‐F) suggesting that the effect of ascorbic acid on lactate uptake is a consequence of the effect of ascorbic acid on glucose transport. Thus, we reasoned that increasing GLUT3 expression in HD cells would correct the altered lactate uptake modulation. To test this hypothesis, experiments in Q7 and Q111 cells overexpressing GLUT3 (Q+GLUT3) were performed. Q111 + GLUT3 cells exhibited the same behavior as Q7 (Figure 5) and Q+GLUT3 indicating that GLUT3 expression is a key component of metabolic failure in HD.
Figure 5.
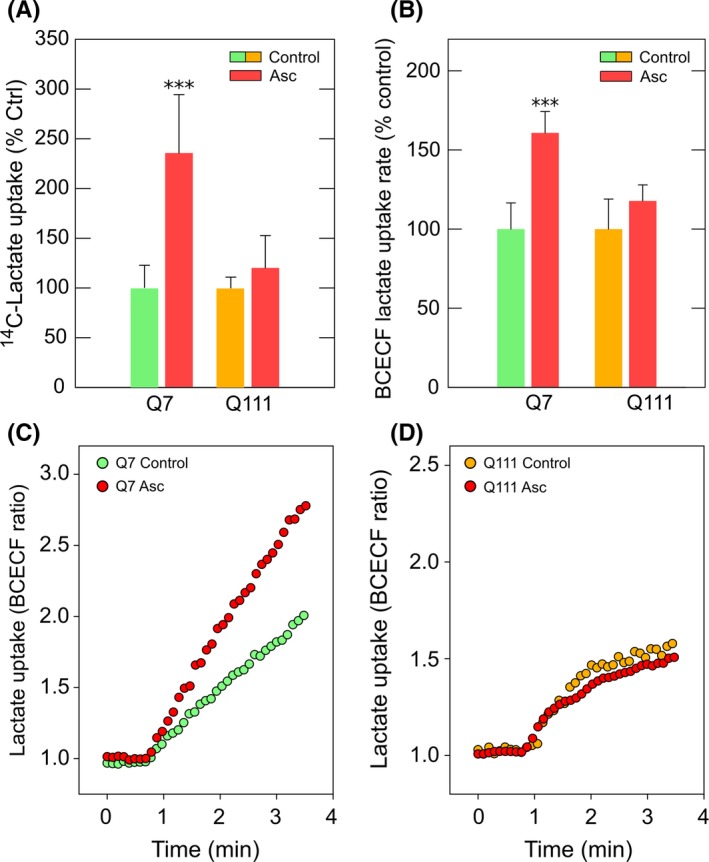
Ascorbic acid is unable to modulate lactate transport in cellular models of Huntington's disease. (A) Bar plot for 14C‐Lactate transport analysis using a 10‐s uptake assay (25°C) in Q7 and Q111 cells. Cells were treated with 0 mmol/L (control) or 1 mmol/L ascorbic acid prior the assay. The absolute values of 14C‐lactate uptake in controls were 553 (Q7 cells) and 554 (Q111 cells) pmol/min × 106 cells. (B) Bar plots for the lactate uptake rate using BCECF H+ probe in Q7 and Q111 cells preloaded with 1 mmol/L ascorbic acid/0.1 mmol/L DTT (Asc) or 0.1 mmol/L DTT (control) for 60 min. The rate was obtained from the slope during the first 100 s after application of 5 mmol/L lactate. Data represent the mean ± SD from 42 cells (Q7) and 18 cells (Q111). ANOVA followed by Bonferroni posttest, ***P < 0.001. (C) and (D) Time course of lactate uptake rate using BCECF H+ probe in Q7 (C) and Q111 (D) cells preloaded with 1 mmol/L ascorbic acid/0.1 mmol/L DTT (Asc) or 0.1 mmol/L DTT (control) for 60 min. Data correspond to a representative experiment in Q7 (C) and Q111 (D) cells
Figure 6.
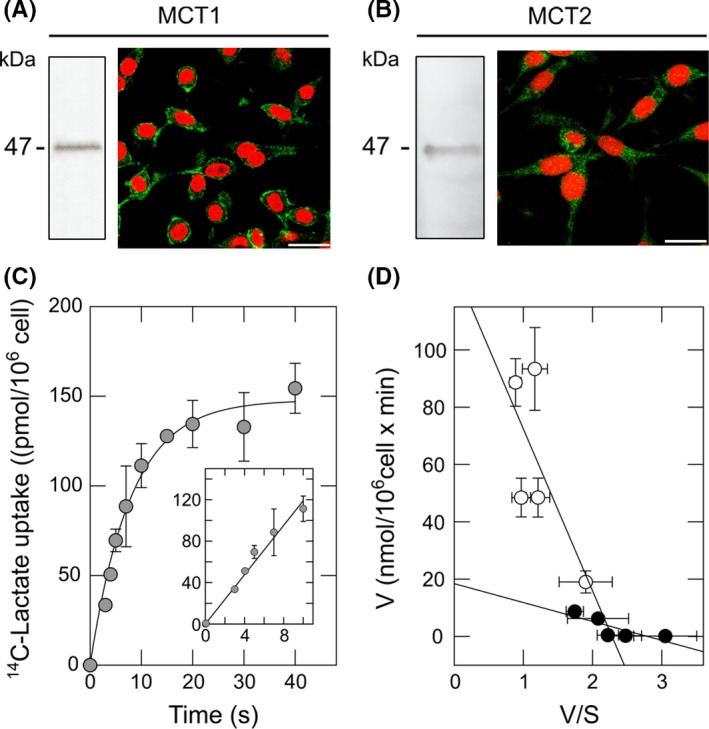
C6 cells express functional type‐1 and type‐2 monocarboxylate transporters. (A,B) Western blot and immunofluorescence analyses for MCT1 and MCT2 in C6 cells. Nuclei were stained using iodide propidium. Scale bar is 20 μm. (C) Time course uptake for 40 s and 10 s (inset) of 14C‐lactate (0.1 mmol/L, 4°C) in C6 cells. Simple exponential curve of two parameters was fitted to data using nonlinear regression (R > 0.99). (D) Eadie‐Hofstee plot for the dose‐response curve of 14C‐lactate transport in C6 cells (10‐s uptake assay, 4°C). Data represent the mean ± SD of four experiments. Lines were fitted using linear regression. Linear regressions were calculated using SigmaPlot v9.0 software (only correlations >0.9 were accepted)
Figure 7.
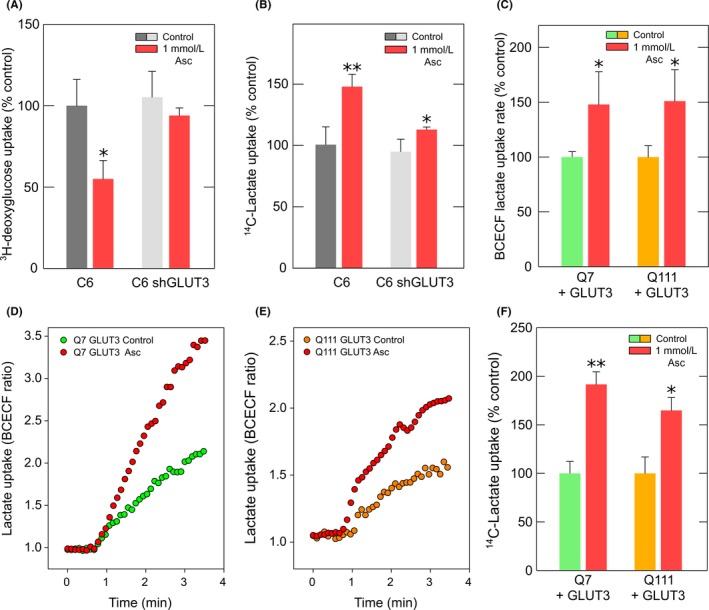
The modulation of lactate transport by ascorbic acid is dependent on GLUT3 expression. (A) Bar plot for the 3H‐deoxyglucose transport analysis using a 15‐s uptake assay (25°C) in C6 cells and shRNA‐treated C6 cells to knock down GLUT3 expression. Cells were treated with 0 mmol/L (control) or 1 mmol/L ascorbic acid prior the assay. The data represent the mean ± SD of four experiments. (B) 14C‐Lactate transport analysis using a 10‐s uptake assay (25°C) in C6 cells and shRNA‐treated C6 cells to knock down GLUT3 expression. Cells were treated with 0 mmol/L (control) or 1 mmol/L ascorbic acid prior the assay. The data represent the mean ± SD of three experiments. (C) Bar plots for the lactate uptake rate using a BCECF H+ probe in Q7 and Q111 cells expressing GLUT3‐mCherry. Cells were preloaded with 1 mmol/L ascorbic acid/0.1 mmol/L DTT (Asc) or 0.1 mmol/L DTT (control) for 60 min. The rate was obtained from the slope during the first 100 s after the application of 5 mmol/L lactate. Data represent the mean ± SD from 8 cells (Q7) and 6 cells (Q111). (D) and (E) Time course of lactate uptake rate using BCECF H+ probe in Q7 (D) and Q111 (E) cells expressing GLUT3‐mCherry. Cells were preloaded with 1 mmol/L ascorbic acid/0.1 mmol/L DTT (Asc) or 0.1 mmol/L DTT (control) for 60 min. Data correspond to a representative experiment. (F) Bar plot of the 14C‐lactate transport analysis using a 10‐s uptake assay (25°C) in Q7 and Q111 cells overexpressing GLUT3‐EGFP. Cells were treated with 0 mmol/L (control) or 1 mmol/L ascorbic acid prior to the assay. The data represent the mean ± SD of three experiments. ANOVA followed by Bonferroni, **P < 0.01, *P < 0.05
4. DISCUSSION
Monocarboxylates are essential for sustaining neuronal energy metabolism.39, 40 Lactate consumption is important for several neurophysiological mechanisms such as respiratory control,41 sexual impulse and appetite,42 recovery after cerebral hypoxia, resistance to oxygen and glucose deprivation,43 neuroprotection44 and learning and memory processes.45, 46 MCTs play a central role in lactate uptake in the brain. MCTs correspond to the gene family SLC16 including 14 members (MCT1‐14).24 MCT1‐4 expression and MCT14 expression have been described in the brain.25, 47 MCT1 expression is decreased in adult neurons, while it is highly expressed in whole embryonic and postnatal brain.26 This is consistent with MCT1 expression in Q cells. MCT2, a high‐affinity lactate transporter, is mainly expressed in neurons.29 It has been proposed that MCT2 and AMPA receptors could interact at postsynaptic densities. This would allow improved energetic adaptation to the demand of synaptic activity.48 MCT14 expression has been described in neuronal somas.47 However, phylogenetic analysis supports the idea that MCT14 should be a neuronal aromatic‐amino‐acid transporter.47
The anchorage and activity of MCTs at the plasma membrane requires interaction with a chaperone protein such as basigin/CD147 and embigin/gp70.49 The ancillary protein for MCT2 is embigin/gp70. Embigin is required to maintain MCT2 catalytic activity. Thus, changes in embigin expression or stability could be responsible for increased MCT2 efficiency. Further experiments should be performed to understand this molecular mechanism. The Huntingtin protein modulates transcription,50 and microarray analysis has established that a number of transcriptional pathways are impaired in HD, inducing both increases and decreases in mRNA profiles.51 Thus, it is possible to speculate that changes in embigin could explain changes in MCT2 activity.
Expression of MCT1, 2, and 4 (data not shown) is not altered in HD. This could be a compensatory mechanism to rectify altered glucose metabolism in HD.23 The expression of the neuronal glucose transporter, GLUT3, is decreased in HD.12 However, in HD the astrocyte‐neuron metabolic interactions are altered.23 Changes in neuronal metabolism also occur between the brain in resting state and periods of activity.18, 39 During conditions of glutamatergic synaptic activity, neurons preferentially use MCTs, such as lactate, to sustain synapse function.19 Under neuronal activity, lactate uptake is increased while glucose uptake is inhibited. This phenomenon occurs because neurons synaptically active induce an increase in ascorbic acid uptake, which is released from glial cells in response to extracellular glutamate.18 Intracellular ascorbic acid in neurons inhibited glucose uptake through GLUT3. As shown here, inhibition of glucose uptake is sufficient to induce increased lactate transport. Therefore, considering altered ascorbic acid uptake and altered MCT2 and GLUT3 expression profiles described in HD, during synaptic activity neuronal cells should meet their energetic requirements through glucose uptake. Meanwhile in resting conditions, neuronal energy should be produced from lactate uptake. Thus, energetic substrate preferences between the resting and the active brain are completely altered in HD. This would explain the altered metabolism which is characteristic of prodromal and early HD (for review, see Beltrán et al52).
The ascorbic acid metabolic switch is impaired in HD23 supporting the idea that correct modulation of neuronal metabolism is essential for proper functioning of neuronal circuitry. As discussed above, this impaired mechanism in HD is induced by (i) an altered flow of ascorbic acid from glial to neuronal cells without changes in their expression,23 (ii) a decreased expression of the high‐affinity and catalytic constant, GLUT3, in neurons,12 and (iii) an altered lactate uptake (as indicated in this study). Increasing GLUT3 expression and supplementing ascorbic acid would be sufficient to re‐establish the correct metabolic substrate preference between resting and activity periods. This idea could be relevant for developing therapeutic strategies for preventing the onset and slowing the progression of HD.
ACKNOWLEDGMENTS
We are indebted to T. Valencia and A. Gallastegui‐Arrigoni for assistance. This work was supported by Chilean FONDECYT grants 1151206 and 1110571 (MAC), 1141015 (LFB), Chilean CONICYT grants 21110592 (ACP) and 21100320 (FAB), DID‐UACh University Research Grant from the Universidad Austral de Chile, Valdivia, Chile (MAC) and International SfA Grant (MAC). MPM, AIA, ACP, and FAB were CONICYT fellows.
Solís‐Maldonado M, Miró MP, Acuña AI, et al. Altered lactate metabolism in Huntington's disease is dependent on GLUT3 expression. CNS Neurosci Ther. 2018;24:343–352. 10.1111/cns.12837
The first two authors contributed equally to this work.
REFERENCES
- 1. Fisher ER, Hayden MR. Multisource ascertainment of Huntington disease in Canada: prevalence and population at risk. Mov Disord. 2014;29:105‐114. [DOI] [PubMed] [Google Scholar]
- 2. Morrison P, Harding‐Lester S, Bradley A. Uptake of Huntington disease predictive testing in a complete population. Clin Genet. 2011;80:281‐286. [DOI] [PubMed] [Google Scholar]
- 3. The Huntington's Disease Collaborative Research Group . A novel gene containing a trinucleotide repeat that is expanded and unstable on Huntington's disease chromosomes. Cell. 1993;72:971‐983. [DOI] [PubMed] [Google Scholar]
- 4. Squitieri F, Jankovic J. Huntington's disease: how intermediate are intermediate repeat lengths? Mov Disord. 2012;27:1714‐1717. [DOI] [PubMed] [Google Scholar]
- 5. Cattaneo E, Rigamonti D, Goffredo D, Zuccato C, Squitieri F, Sipione S. Loss of normal huntingtin function: new developments in Huntington's disease research. Trends Neurosci. 2001;24:182‐188. [DOI] [PubMed] [Google Scholar]
- 6. Atwal RS, Xia J, Pinchev D, Taylor J, Epand RM, Truant R. Huntingtin has a membrane association signal that can modulate huntingtin aggregation, nuclear entry and toxicity. Hum Mol Genet. 2007;16:2600‐2615. [DOI] [PubMed] [Google Scholar]
- 7. Kuwert T, Lange HW, Langen KJ, Herzog H, Aulich A, Feinendegen LE. Cortical and subcortical glucose consumption measured by pet in patients with Huntington's disease. Brain. 1990;113:1405‐1423. [DOI] [PubMed] [Google Scholar]
- 8. Lim D, Fedrizzi L, Tartari M, et al. Calcium homeostasis and mitochondrial dysfunction in striatal neurons of Huntington disease. J Biol Chem. 2008;283:5780‐5789. [DOI] [PubMed] [Google Scholar]
- 9. Oláh J, Klivényi P, Gardián G, et al. Increased glucose metabolism and ATP level in brain tissue of Huntington's disease transgenic mice. FEBS J. 2008;275:4740‐4755. [DOI] [PubMed] [Google Scholar]
- 10. Browne SE, Bowling AC, MacGarvey U, et al. Oxidative damage and metabolic dysfunction in Huntington's disease: selective vulnerability of the basal ganglia. Ann Neurol. 1997;41:646‐653. [DOI] [PubMed] [Google Scholar]
- 11. Chiang MC, Chen CM, Lee MR, et al. Modulation of energy deficiency in Huntington's disease via activation of the peroxisome proliferator‐activated receptor gamma. Hum Mol Genet. 2010;19:4043‐4058. [DOI] [PubMed] [Google Scholar]
- 12. Covarrubias‐Pinto A, Moll P, Solís‐Maldonado M, et al. Beyond the redox imbalance: oxidative stress contributes to an impaired GLUT3 modulation in Huntington's disease. Free Radic Biol Med. 2015;89:1085‐1096. [DOI] [PMC free article] [PubMed] [Google Scholar]
- 13. Gamberino WC, Brennan WA. Glucose transporter isoform expression in Huntington's disease brain. Proteins. J Neurochem. 1994;63:1392‐1397. [DOI] [PubMed] [Google Scholar]
- 14. Magistretti PJ, Pellerin L, Rothman DL, Shulman RG. Energy on demand. Science. 1999;283:496‐497. [DOI] [PubMed] [Google Scholar]
- 15. Pellerin L, Magistretti P. Glutamate uptake into astrocytes stimulates aerobic glycolysis: a mechanism coupling neuronal activity to glucose utilization. Proc Natl Acad Sci USA. 1994;91:10625‐10629. [DOI] [PMC free article] [PubMed] [Google Scholar]
- 16. Pellerin L, Pellegri G, Martin JL, Magistretti PJ. Expression of monocarboxylate transporter mRNAs in mouse brain: support for a distinct role of lactate as an energy substrate for the neonatal vs. adult brain. Proc Natl Acad Sci USA. 1998;95:3990‐3995. [DOI] [PMC free article] [PubMed] [Google Scholar]
- 17. Wilson JX, Peters CE, Sitar SM, Daoust P, Gelb AW. Glutamate stimulates ascorbate transport by astrocytes. Brain Res. 2000;858:61‐66. [DOI] [PubMed] [Google Scholar]
- 18. Castro MA, Beltrán FA, Brauchi S, Concha II. A metabolic switch in brain: glucose and lactate metabolism modulation by ascorbic acid. J Neurochem. 2009;110:423‐440. [DOI] [PubMed] [Google Scholar]
- 19. Castro MA, Pozo M, Cortés C, García MDLA, Concha II, Nualart F. Intracellular ascorbic acid inhibits transport of glucose by neurons, but not by astrocytes. J Neurochem. 2007;102:773‐782. [DOI] [PubMed] [Google Scholar]
- 20. Castro MA, Angulo C, Brauchi S, Nualart F, Concha II. Ascorbic acid participates in a general mechanism for concerted glucose transport inhibition and lactate transport stimulation. Pflugers Arch. 2008;457:519‐528. [DOI] [PubMed] [Google Scholar]
- 21. Bergersen L, Waerhaug O, Hem J, et al. A novel postsynaptic density protein: the monocarboxylate transporter MCT2 is co‐localized with delta‐glutamate receptors in postsynaptic densities of parallel fiber‐Purkinje cell synapses. Exp Brain Res. 2001;136:523‐534. [DOI] [PubMed] [Google Scholar]
- 22. Cortes‐Campos C, Elizondo R, Carril C, et al. MCT2 expression and lactate influx in anorexigenic and orexigenic neurons of the arcuate nucleus. PLoS ONE. 2013;8:e62532. [DOI] [PMC free article] [PubMed] [Google Scholar]
- 23. Acuña AI, Esparza M, Kramm C, et al. A failure in energy metabolism and antioxidant uptake precede symptoms of Huntington's disease in mice. Nat Commun. 2013;4:1‐13. [DOI] [PMC free article] [PubMed] [Google Scholar]
- 24. Halestrap AP, Meredith D. The SLC16 gene family – from monocarboxylate transporters (MCTs) to aromatic amino acid transporters and beyond. Pflugers Arch Eur J Physiol. 2004;447:619‐628. [DOI] [PubMed] [Google Scholar]
- 25. Pierre K, Pellerin L. Monocarboxylate transporters in the central nervous system: distribution, regulation and function. J Neurochem. 2005;94:1‐14. [DOI] [PubMed] [Google Scholar]
- 26. Pellerin L, Halestrap AP, Pierre K. Cellular and subcellular distribution of monocarboxylate transporters in cultured brain cells and in the adult brain. J Neurosci Res. 2005;79:55‐64. [DOI] [PubMed] [Google Scholar]
- 27. Vannucci SJ, Simpson IA. Developmental switch in brain nutrient transporter expression in the rat. Am J Physiol Endocrinol Metab. 2003;285:E1127‐E1134. [DOI] [PubMed] [Google Scholar]
- 28. Koehler‐Stec EM, Simpson IA, Vannucci SJ, et al. Monocarboxylate transporter expression in mouse brain. Am J Physiol. 1998;275(Pt 1):E516‐E524. [DOI] [PubMed] [Google Scholar]
- 29. Bergersen LH, Magistretti PJ, Pellerin L. Selective postsynaptic co‐localization of MCT2 with AMPA receptor GluR2/3 subunits at excitatory synapses exhibiting AMPA receptor trafficking. Cereb Cortex. 2005;15:361‐370. [DOI] [PubMed] [Google Scholar]
- 30. Brauchi S, Rauch MC, Alfaro IE, et al. Kinetics, molecular basis, and differentiation of L‐lactate transport in spermatogenic cells. Am J Physiol Cell Physiol. 2005;288:C523‐C534. [DOI] [PubMed] [Google Scholar]
- 31. Trettel F, Rigamonti D, Hilditch‐Maguire P, et al. Dominant phenotypes produced by the HD mutation in STHdh(Q111) striatal cells. Hum Mol Genet. 2000;9:2799‐2809. [DOI] [PubMed] [Google Scholar]
- 32. Mangiarini L, Sathasivam K, Seller M, et al. Exon 1 of the HD gene with expanded CAG repeat is sufficient to cause a progressive neurological phenotype in transgenic mice. Cell. 1996;87:493‐506. [DOI] [PubMed] [Google Scholar]
- 33. Ciarmiello A, Giovacchini G, Orobello S, Bruselli L, Elifani F, Squitieri F. 18F‐FDG PET uptake in the pre‐Huntington disease caudate affects the time‐to‐onset independently of CAG expansion size. Eur J Nucl Med Mol Imaging. 2012;39:1030‐1036. [DOI] [PubMed] [Google Scholar]
- 34. Mochel F, N'Guyen TM, Deelchand D, et al. Abnormal response to cortical activation in early stages of Huntington disease. Mov Disord. 2012;27:907‐910. [DOI] [PubMed] [Google Scholar]
- 35. Juel C, Halestrap AP. Lactate transport in skeletal muscle – role and regulation of the monocarboxylate transporter. J Physiol. 1999;517:633‐642. [DOI] [PMC free article] [PubMed] [Google Scholar]
- 36. Bröer S, Rahman B, Pellerin L, et al. Comparison of lactate transport in astroglial cells and monocarboxylate Xenopus laevis oocytes: expression of two different transporters in astroglial cells and neurons. J Biol Chem. 1997;272:30096‐30102. [DOI] [PubMed] [Google Scholar]
- 37. Bröer S, Bröer A, Schneider HP, Stegen C, Halestrap AP, Deitmer JW. Characterization of the high‐affinity monocarboxylate transporter MCT2 in Xenopus laevis oocytes. Biochem J. 1999;342:529‐535. [DOI] [PMC free article] [PubMed] [Google Scholar]
- 38. Beltrán FA, Acuña AI, Miró MP, Angulo C, Concha II, Castro MA. Ascorbic acid‐dependent GLUT3 inhibition is a critical step for switching neuronal metabolism. J Cell Physiol. 2011;226:3286‐3394. [DOI] [PubMed] [Google Scholar]
- 39. Allaman I, Bélanger M, Magistretti PJ. Astrocyte‐neuron metabolic relationships: for better and for worse. Trends Neurosci. 2011;34:76‐87. [DOI] [PubMed] [Google Scholar]
- 40. Bélanger M, Allaman I, Magistretti PJ. Brain energy metabolism: focus on Astrocyte‐neuron metabolic cooperation. Cell Metab. 2011;14:724‐738. [DOI] [PubMed] [Google Scholar]
- 41. Erlichman JS, Leiter JC, Gourine AV. ATP, glia and respiratory control. Respir Physiol Neurobiol. 2010;173:305‐311. [DOI] [PMC free article] [PubMed] [Google Scholar]
- 42. Parsons MP, Hirasawa M. ATP‐sensitive potassium channel‐mediated lactate effect on orexin neurons: implications for brain energetics during arousal. J Neurosci. 2010;30:8061‐8070. [DOI] [PMC free article] [PubMed] [Google Scholar]
- 43. Gao C, Zhou L, Zhu W, et al. Monocarboxylate transporter‐dependent mechanism confers resistance to oxygen‐ and glucose‐deprivation injury in astrocyte‐neuron co‐cultures. Neurosci Lett. 2016;594:99‐104. [DOI] [PubMed] [Google Scholar]
- 44. Berthet C, Castillo X, Magistretti PJ, Hirt L. New evidence of neuroprotection by lactate after transient focal cerebral ischaemia: extended benefit after intracerebroventricular injection and efficacy of intravenous administration. Cerebrovasc Dis. 2012;34:329‐335. [DOI] [PubMed] [Google Scholar]
- 45. Jin C, Gao L, Li Y, et al. Lanthanum damages learning and memory and suppresses astrocyte–neuron lactate shuttle in rat hippocampus. Exp Brain Res. 2017;235:3817‐3832. [DOI] [PubMed] [Google Scholar]
- 46. Suzuki A, Stern SA, Bozdagi O, et al. Astrocyte‐neuron lactate transport is required for long‐term memory formation. Cell. 2011;144:810‐823. [DOI] [PMC free article] [PubMed] [Google Scholar]
- 47. Roshanbin S, Lindberg FA, Lekholm E, et al. Histological characterization of orphan transporter MCT14 (SLC16A14) shows abundant expression in mouse CNS and kidney. BMC Neurosci. 2016;17:1‐14. [DOI] [PMC free article] [PubMed] [Google Scholar]
- 48. Pierre K, Chatton JY, Parent A, et al. Linking supply to demand: the neuronal monocarboxylate transporter MCT2 and the α‐amino‐3‐hydroxyl‐5‐methyl‐4‐isoxazole‐propionic acid receptor GluR2/3 subunit are associated in a common trafficking process. Eur J Neurosci. 2009;29:1951‐1963. [DOI] [PubMed] [Google Scholar]
- 49. Wilson MC, Meredith D, Manning Fox JE, Manoharan C, Davies AJ, Halestrap AP. Basigin (CD147) is the target for organomercurial inhibition of monocarboxylate transporter isoforms 1 and 4: the ancillary protein for the insensitive MCT2 is embigin (gp70). J Biol Chem. 2005;280:27213‐27221. [DOI] [PubMed] [Google Scholar]
- 50. Benn CL, Sun T, Sadri‐Vakii G, et al. Huntingtin modulates transcription, occupies gene promoters in vivo, and binds directly to DNA in a polyglutamine‐dependent manner. J Neurosci. 2008;28:10720‐10733. [DOI] [PMC free article] [PubMed] [Google Scholar]
- 51. Hodges A, Strand AD, Aragaki AK, et al. Regional and cellular gene expression changes in human Huntington's disease brain. Hum Mol Genet. 2006;15:965‐977. [DOI] [PubMed] [Google Scholar]
- 52. Beltran FA, Acuña AI, Miró MP, Castro MA. Brain Energy Metabolism in Health and Disease, Neuroscience – Dealing With Frontiers. London: InTech; 2012:331‐362, ISBN 978‐953‐51‐0207‐6. [Google Scholar]


