

Abstract
Background
Our aim is to present average values and prevalence of electrocardiographic (ECG) abnormalities among the general Dutch population in the LifeLines Cohort.
Hypothesis
The ECG values previously studied in the Caucasian population of smaller cohorts will be confirmed with ECG data from LifeLines.
Methods
ECG data of 152 180 individuals age 18 to 93 years were available. Individuals with cardiovascular risk factors were excluded to analyze the healthy population. Average values of the ECG for the healthy population were presented as means with 95% and 99% confidence intervals and as medians with first and 99th percentiles.
Results
Median heart rate was highest in the youngest and oldest individuals of the healthy population. Median duration of P wave, PQ interval, and QRS duration were longer in males compared with females. In contrast, median QT interval corrected for heart rate was higher in females. In general, the above‐mentioned parameters increased with age. The prevalences of ECG abnormalities adjusted for the Dutch population were 0.9% for atrial fibrillation or flutter, 1.4% for premature atrial complexes, 0.5% for myocardial infarction, 2.1% for ventricular premature complexes, 1.0% for left ventricular hypertrophy, 8.1% for P‐R interval >200 ms, and 0.8% for bundle branch block.
Conclusions
Our study provides an overview of average values and ECG abnormalities and confirms data of previous smaller studies. In addition, we evaluate the age‐ and sex‐dependent normal limits of the P wave and QRS duration and confirm in detail the frontal plane QRS‐T angle on the ECG.
Keywords: Electrocardiography Ambulatory ECG, Average Values, Abnormalities, Epidemiology, Prevalences, LifeLines Cohort Study
1. INTRODUCTION
The electrocardiogram (ECG) is a globally used essential, inexpensive, and noninvasive technique to detect electric abnormalities of the heart. Information on ECG values in a healthy cohort is of major importance to distinguish between average ECG values and a (potential) cardiac condition. Several studies have evaluated average values of the ECG.1, 2, 3 Most of these studies focused on a specific subpopulation, such as athletes1 or an elderly population,3 or included only women.4 Previous studies showed that interpretation of the ECG should be corrected for age categories, sex, and ethnicity.2, 3, 5, 6
Our aim is to describe the average ECG values and the prevalence of ECG abnormalities in the general Dutch population in the LifeLines cohort (152 180 individuals), a unique observational follow‐up study covering 3 generations of a Caucasian population of the northern provinces of the Netherlands.7
2. METHODS
2.1. The LifeLines cohort and population
LifeLines is a facility that is open for all researchers. Information on application and data‐access procedures is summarized at http://www.lifelines.net. In short, LifeLines is a multidisciplinary, prospective, population‐based cohort study examining in a unique 3‐generation design the health and health‐related behaviors of 167 729 persons living in the 3 northern provinces of The Netherlands. Individuals who lived in this area and were age 25 to 50 were invited through their general practitioners for voluntary participation. In addition, inhabitants in this area who were not invited by their general practitioners could register themselves via the LifeLines website. The recruited participants represented the adult population of the north of the Netherlands.7 The LifeLines Cohort Study complies with the Declaration of Helsinki. The local ethics committee approved the research protocol, and informed consent was signed by every participant.
LifeLines employs a broad range of investigative procedures in assessing the biomedical, sociodemographic, behavioral, physical, and psychological factors that contribute to the health and disease of the general population, with a special focus on multimorbidity and complex genetics.8 At baseline, all LifeLines individuals were asked to complete a self‐administered questionnaire on medical history, including history and symptoms of cardiovascular disease (CVD), use of medication, and health behavior. Furthermore, a basic medical examination at a LifeLines research facility was performed. A 10‐second ECG is one of the standard measurements included in the examination.9
For this study, ECG data of all individuals age 18 to 93 years were available. Individuals who reported their ethnicity as other than Caucasian (n = 2377, obtained from questionnaire) were excluded from analyses, as ECG parameters differ in different ethnicities.5 Individuals with hypertension (HTN; n = 38 724), hypercholesterolemia (n = 22 505), diabetes mellitus (DM; n = 4811), myocardial infarction (MI; n = 1663), heart failure (HF; n = 792), pacemaker or implantable cardioverter‐defibrillator (n = 221), history of coronary artery bypass surgery (n = 2199), or heart transplant (n = 23) were excluded from the analyses of the healthy population. In addition, individuals with atrial fibrillation (AF) or flutter were excluded for analyzing average values of heart rate (HR).
2.2. Resting ECG
For all individuals, a resting baseline ECG was made in the period between November 2006 and January 2013. The ECGs were done using CardioPerfect software, version 1.6.2.1105 (Welch Allyn, Skaneateles Falls, NY) by a trained research assistant at one of the LifeLines facilities. The Welch Allyn automated algorithms were used to detect ECG abnormalities and are described elsewhere.10 The corrected QT interval (QTc) was calculated in Welch Allyn with the Hodges formula (QTc = QT + 1.75 × [HR − 60]). QRS‐T angles of the frontal plane were calculated subtracting the QRS‐axis of the T‐axis, as in previous literature.11, 12 AF, atrial flutter, sinus tachycardia >120/min, sinus bradycardia <40/min, MI, acute ischemia, ST‐segment elevation, Wolff‐Parkinson‐White syndrome, and total atrioventricular (AV) block were criteria for a LifeLines physician and/or a cardiologist to examine the ECG and medical history. If immediate intervention was necessary, the general practitioner was contacted within 48 hours. Other abnormalities of the ECGs than those mentioned above (see Supporting Information, Figure 1, in the online version of this article) were examined by a cardiologist within 2 weeks.
2.3. Definitions of ECG abnormalities
Abnormalities of the ECG were detected by Welch Allyn and confirmed by a cardiologist. Tachycardia and bradycardia were defined as HR >100 bpm and <50 bpm, respectively, in all individuals. PQ interval of >200 ms and <120 ms were scored in all individuals, as well as QTc interval of >450 ms in males and >460 ms in females. In addition, computer systems should use all criteria that are supported by valid evidence for identifying left ventricular hypertrophy (LVH) according to the American Heart Association recommendations for ECG, as Welch Allyn is.13 Welch Allyn assessed LVH according to the degree of abnormality in voltage and shape of the QRS complex, and repolarization. Voltage criteria were analyzed adjusted for age in leads V1, V5, V6, I, and II. When the voltage criteria were not met, no further analyses for diagnosing LVH were done. The shape of the QRS complex was determined in the plane where the highest voltage score was reached and is based on intrinsicoid deflection and the sequence of small r waves in the right and tall R waves in the left precordial leads. The repolarization was evaluated as presence and degree of ST‐segment depression and T negativity in the leads I, II, aVL, aVF, V5, and V6. ST slope and J‐ and T‐wave amplitudes in the frontal and horizontal planes determined strain scores.10
2.4. Definitions of cardiovascular risk factors and diseases
Cardiovascular risk factors in LifeLines were based on questionnaires and validated with medication use, biomarkers, or measurement abnormalities, and were described earlier.8, 14 HTN was defined as a systolic blood pressure ≥140 mm Hg, a diastolic blood pressure ≥90 mm Hg, or use of blood pressure–lowering drugs. Hypercholesterolemia was considered to be present if total cholesterol was ≥5.0 mmol/L in combination with self‐reported MI, or if total cholesterol was ≥6.5 mmol/L, or if an individual used cholesterol‐lowering medication. The definition of DM was based on self‐reported DM, fasting (8–14 hours) glucose value ≥126 mg/dL or nonfasting glucose value ≥200 mg/dL, or use of anti‐DM medication. Overweight was defined as a body mass index >25.0 kg/m2. Smoking was divided into current and former smoker groups and was obtained from the questionnaire. Active lifestyle was defined as being active for ≥30 min/d and obtained from the questionnaire as well. Family history of CVD was defined as the presence of a parent, sibling, or child with CVD acquired before age 60 years. For excluding individuals with CVD, MI was defined as self‐reported MI and the use of drug related to MI or ECG pathology. The definition of HF was self‐reported HF and was validated with treatment of HF (drug use related to HF, implantation of pacemaker or implantable cardioverter‐defibrillator, or heart transplantation). The presence of a pacemaker or implantable cardioverter‐defibrillator was obtained from questionnaire, as well as a history of coronary artery bypass surgery or heart transplantation.
2.5. Statistical analysis
For reporting baseline data and ECG abnormalities, the study population was divided into males and females, and in a middle and older age category (18–65 years and ≥65 years). Average values of the ECG were reported by sex and 8 age categories (18–19, 20–29, 30–39, 40–49, 50–59, 60–69, 70–79, and ≥80 years). Prevalence of cardiovascular risk factors and ECG abnormalities were presented as number of subjects (n) and percentages (%). The χ2 test was used to compare frequencies of ECG abnormalities in males and females and between age groups ≥18 and <65 years and ≥65 years. Cardiovascular risk factors and ECG abnormalities were standardized for the population distribution of age and sex of the Dutch adult population in 2010 with the dstdize command in Stata Statistical Software, an algebraically equivalent of the Cochran formula.15 Average values of the ECG for the healthy population were presented as mean with 95% and 99% confidence intervals (CIs) and as median with first and 99th percentiles. The Mann–Whitney Wilcoxon test was used to compare medians of the average values in males and females in age categories. Linear regression was performed to assess the association of HR, P‐wave duration, PQ interval, QRSd, and QTc interval with age and sex. Subsequently, age2 was added to the linear regression analyses to determine if there was an improvement of the fit of the model (rather a curvilinear than linear relationship). R2 was compared to determine the best‐fitted model. A P value of <0.05 was considered statistically significant. Analyses were performed with Stata/IC release 13.0 (StataCorp LP, College Station, TX).
3. RESULTS
3.1. Study population
In this research, ECG data was available for 149 803 adult individuals after exclusion. Of the remaining population, 42% (n = 62 303) were males and 58% (n = 87 500) were females, with an age range of 18 to 93 years (Table 1). Crude estimates of HTN, hypercholesterolemia, and DM were 26%, 15%, and 3%, respectively. Overweight was present in 55% of the population. Furthermore, 21% and 36% of the population were current or former smokers, respectively.
Table 1.
Demographics and CV risk factors in the LifeLines Cohort Study
| Characteristics | Age 18–65 y, n = 139 026 | Age ≥65 y, n = 10 777 | P Value | Male, n = 62 303 | Female, n = 87 500 | P Value | CE, % | SE, % |
|---|---|---|---|---|---|---|---|---|
| Age, y | 43 ± 11 | 71 ± 5 | <0.001 | 45 ± 13 | 44 ± 13 | <0.001 | — | — |
| Female sex | 83 330 (59.0) | 5720 (52.7) | <0.001 | — | — | — | — | |
| CV risk factors | ||||||||
| HTN | 31 294 (22.5) | 7430 (68.9) | <0.001 | 19 994 (32.1) | 18 730 (21.4) | <0.001 | 25.8 | 32.6 |
| Hypercholesterolemia | 17 791 (12.8) | 4714 (43.7) | <0.001 | 11 035 (17.7) | 11 470 (13.1) | <0.001 | 15.0 | 19.1 |
| DM | 3554 (2.6) | 1257 (11.7) | <0.001 | 2375 (3.8) | 2436 (2.8) | <0.001 | 3.2 | 4.4 |
| Overweight | 75 031 (54.0) | 7678 (71.2) | <0.001 | 39 090 (62.7) | 43 619 (49.9) | <0.001 | 55.2 | 56.2 |
| Current smoker | 29 779 (21.4) | 889 (8.3) | <0.001 | 13 989 (22.5) | 16 679 (19.1) | <0.001 | 20.6 | 19.0 |
| Former smoker | 45 294 (32.6) | 5656 (52.5) | <0.001 | 21 913 (35.2) | 29 037 (33.2) | <0.001 | 33.9 | 35.3 |
| Active lifestyle (30 min/d) | 10 838 (7.8) | 915 (8.5) | 0.010 | 5852 (7.8) | 6901 (7.9) | 0.482 | 7.8 | 7.6 |
| Family history of CVD | 12 348 (8.9) | 1076 (10.0) | <0.001 | 5463 (8.8) | 7961 (9.1) | 0.028 | 8.9 | 8.8 |
Abbreviations: CE, crude estimate; CV, cardiovascular; CVD, cardiovascular disease; DM, diabetes mellitus; HTN, hypertension; SD, standard deviation; SE, standardized estimate.
Data are presented as n (%) or mean ± SD.
3.2. Average values of the ECG
Figure 1 shows median and interquartile range (IQR) of HR, P‐wave duration, PQ interval, QRSd, and QTc interval in males and females in the healthy population. Figure 2 shows average values of ECG parameters by age. The duration of different parts of the ECG and the orientation of electrical axes in the healthy population are provided in Supporting Information, Table 1, in the online version of this article.
Figure 1.

Median and IQR of HR, QRSd, P wave, PQ interval, and QTc interval in males and females. Blue = males, red = females. Abbreviations: HR, heart rate; IQR, interquartile range; P, P‐wave duration; PQ, PQ interval duration; QRSd, QRS interval duration; QTc, corrected QT interval duration.
Figure 2.
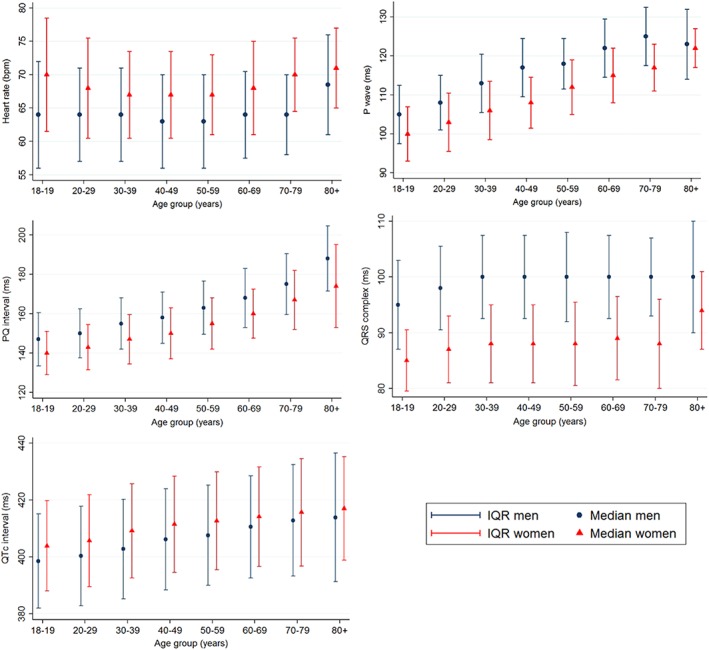
Average ECG values of males and females in the healthy population (median and IQR). Blue = males, red = females. Abbreviations: ECG, electrocardiographic; IQR, interquartile range; P, P‐wave duration; PQ, PQ interval duration; QRS, QRS interval duration; QTc, corrected QT interval duration.
In linear regression analyses, sex, age, and age2 were predictors of HR, P‐wave duration, PQ interval, QRSd, and QTc interval (P < 0.001). HR had a higher R2 in the nonlinear regression model (1.8% in linear regression and 2.2% in nonlinear regression). On the contrary, in the regression model of P‐wave duration (R2 = 18%), PQ interval (R2 = 5.1%), QRSd (R2 = 16%), and QTc interval (R2 = 4.8%), R2 did not improve after adding age2. The regression lines in males and females are presented in Supporting Information, Figure 2, in the online version of this article.
Median P‐axis was more rightward in males compared with females until age 50 years and rotated rightward until age 70 years. In contrast, QRS‐axis rotated leftward with age. T‐axis showed significant difference in rotation between males and females in the age categories <60 years, although without a consistent rotation direction in >60 years. In general, QRS‐T angle was wider in females compared with males. Before age 70 years, the QRS‐T angle narrowed in both sexes due to the leftward rotation of the QRS‐axis (see Supporting Information, Table 1, in the online version of this article).
3.3. Abnormalities of the ECG
Table 2 shows the particular ECG abnormalities in the middle and older age categories and sexes, as well as standardized for the population distribution of age and sex of the LifeLines cohort. The prevalences of ECG abnormalities adjusted for the Dutch population were 0.9% for AF/flutter, 1.4% for premature atrial complexes (PACs), 0.5% for MI, 2.1% for premature ventricular complexes, 1.0% for LVH, 8.1% for PR interval >200 ms, and 0.8% for bundle branch block (BBB).
Table 2.
Abnormalities of the ECG
| Findings on ECG | Age 18–65 y, n = 139 026 | Age ≥65 y, n = 10 777 | P Value | Male, n = 62 303 | Female, n = 87 500 | P Value | CE, % | SE, % |
|---|---|---|---|---|---|---|---|---|
| HR and rhythm | ||||||||
| Tachycardia, HR >100 bpm | 983 (0.71) | 117 (1.09) | <0.001 | 435 (0.70) | 665 (0.76) | 0.167 | 0.73 | 0.83 |
| Bradycardia, HR <50 bpm | 4715 (3.39) | 319 (2.96) | 0.017 | 3056 (4.91) | 1978 (2.26) | <0.001 | 3.36 | 3.55 |
| Sinus arrhythmia | 651 (0.46) | 52 (0.48) | 0.784 | 299 (0.47) | 404 (0.45) | 0.572 | 0.46 | 0.63 |
| AF/flutter | 174 (0.13) | 268 (2.49) | <0.001 | 326 (0.52) | 116 (0.13) | <0.001 | 0.30 | 0.87 |
| PACs | 1065 (0.75) | 325 (2.99) | <0.001 | 582 (0.92) | 808 (0.91) | 0.769 | 0.91 | 1.41 |
| PVCs | 1759 (1.24) | 511 (4.71) | <0.001 | 1049 (1.66) | 1221 (1.37) | <0.001 | 1.49 | 2.06 |
| Pacemaker rhythm | 66 (0.05) | 81 (0.75) | <0.001 | 94 (0.15) | 53 (0.06) | <0.001 | 0.10 | 0.27 |
| Conduction | ||||||||
| PQ interval >200 ms | 5744 (4.13) | 1993 (18.49) | <0.001 | 4397 (7.06) | 3340 (3.82) | <0.001 | 5.16 | 8.07 |
| PQ interval <120 ms | 4195 (3.02) | 73 (0.68) | <0.001 | 864 (1.39) | 3404 (3.89) | <0.001 | 2.80 | 2.48 |
| LBBB | 333 (0.24) | 190 (1.75) | <0.001 | 209 (0.33) | 314 (0.35) | 0.479 | 0.34 | 0.63 |
| RBBB | 825 (0.58) | 369 (3.4) | <0.001 | 817 (1.29) | 377 (0.42) | <0.001 | 0.78 | 0.13 |
| Nonspecific conduction delay | 8754 (6.19) | 753 (6.94) | 0.002 | 6873 (10.89) | 2634 (2.96) | <0.001 | 6.25 | 6.90 |
| Left anterior fascicular block | 2061 (1.46) | 792 (7.3) | <0.001 | 1860 (2.95) | 993 (1.12) | <0.001 | 1.87 | 2.86 |
| Left posterior fascicular block | 104 (0.07) | 15 (0.14) | 0.020 | 86 (0.14) | 33 (0.04) | <0.001 | 0.08 | 0.10 |
| WPW syndrome | 131 (0.09) | <10 (0.03) | 0.028 | 63 (0.10) | 71 (0.08) | 0.194 | 0.09 | 0.08 |
| LVH | 695 (0.50) | 237 (2.20) | <0.001 | 546 (0.88) | 386 (0.44) | <0.001 | 0.62 | 0.96 |
| QRS voltage | ||||||||
| Low voltage | 402 (0.28) | 79 (0.73) | <0.001 | 148 (0.23) | 2174 (3.44) | <0.001 | 0.32 | 0.36 |
| High voltage | 2773 (1.96) | 539 (4.97) | <0.001 | 333 (0.37) | 1138 (1.28) | <0.001 | 2.18 | 2.97 |
| Repolarization abnormalities | ||||||||
| ST‐segment depression | 1134 (0.80) | 219 (2.02) | <0.001 | 588 (0.93) | 765 (0.86) | 0.139 | 0.89 | 1.01 |
| Negative T | 1746 (1.24) | 310 (2.86) | <0.001 | 1142 (1.81) | 914 (1.03) | <0.001 | 1.35 | 1.57 |
| QTc interval (>450 in males, >460 in females) | 1654 (1.19) | 616 (5.72) | <0.001 | 1312 (2.13) | 942 (1.08) | <0.001 | 1.52 | 2.38 |
| MI | ||||||||
| Definite MI | 325 (0.23) | 163 (1.51) | <0.001 | 335 (0.54) | 153 (0.17) | <0.001 | 0.33 | 0.53 |
| Possible MI | 542 (0.38) | 159 (1.47) | <0.001 | 351 (0.56) | 350 (0.39) | <0.001 | 0.46 | 0.68 |
Abbreviations: AF, atrial fibrillation; CE, crude estimate; ECG, electrocardiogram; HR, heart rate; LBBB, left bundle branch block; LVH, left ventricular hypertrophy; MI, myocardial infarction; PAC, premature atrial complex; PVC, premature ventricular complex; RBBB, right bundle branch block; SE, standardized estimate; WPW, Wolff‐Parkinson‐White.
Data are presented as n (%).
4. DISCUSSION
We determined average values and prevalences of abnormalities of the ECG in the healthy and general Caucasian population of the LifeLines cohort, using computerized analyses of a large set of ECGs. Our unique large data source shows several similarities and differences from previous studies regarding average values and abnormalities of the ECG.
4.1. Average values of the ECG
Our study is, compared with previous studies, unique in its sample size. Median HR in healthy individuals was observed higher in females compared with males in several studies, in predominantly Caucasian cohorts, as in our study.2, 16, 17
The median duration of the P wave, the PQ interval, and the QRSd were higher in males compared with females and increased with each increase in age category in our study. Previously, a comparable ECG study was performed in a Caucasian (Dutch) population (n = 13 354) studied by Rijnbeek et al.2 Our results confirm their data; P‐wave and PQ interval duration were higher in males compared with females and increase with age.2 In our study, P‐wave duration <120 ms was defined as a normal value. Additionally, we found that from the age of 60 years to the oldest age categories, the P wave on average increased, >120 ms. This may indicate that in the healthy population, normal P‐wave durations >60 years can be higher than initially thought, up to approximately 130 ms, especially in males.
The PQ interval duration ranging between 120 ms and 220 ms is considered normal.18, 19, 20, 21, 22, 23 In our study, the average values of the PQ interval duration were within the previously established range; however, the PQ interval seems slightly longer in both males and females, especially in the older age categories.
The median QRSd only increased in the younger age categories, but remained steady in the other age categories. Males had longer QRSd than females through every age category, as earlier described.2, 16, 17 New normal values may also be suggested for the QRSd, as on average the QRSd in males is between 95 and 102 ms. The upper normal limit of 100 ms seems a little tight, especially in males age ≥40 years. Thus, a potential new upper limit of 105 ms may be of better clinical interpretation in males age ≥40 years.
The QTc measured in our cohort was longer in females compared with males, as in other studies observed. However, in general the values of the QTc seemed ~5 ms shorter in the youngest age categories than in Rijnbeek et al.
In Rijnbeek et al, similar to our data, rotation of the P‐axis, QRS‐axis, and T‐axis were observed. The median QRS‐axis starts to rotate to the left until it is almost horizontal in the oldest age category. Above the age of 70 years, the median frontal T‐axis rotates to the left, to an almost horizontal position, as in our study. Knowledge of axis rotation in certain age categories may be of clinical importance to predict risk of related abnormalities of the heart in certain age categories. Mason et al suggested that ECG changes over the years may be caused by the changing topography of the heart in relation to the thorax and diaphragm, as well as modifications in volume conductors. They observed a large influence of age and sex on normal values.
The QRS‐T angle in the frontal plane can provide information on cardiac risk.12 A recently performed a meta‐analysis of the QRS‐T angle included 22 studies (n = 164 171) and concluded that a wide frontal QRS‐T angle of >100° was a predictor of all‐cause mortality and cardiac death.24 Years ago, age‐ and sex‐related normal limits of the QRS‐T angle were published.12, 25 Age‐ and sex‐specific QRS‐T angles in the LifeLines cohort are in line with this article. However, Aro et al used a more arbitrarily threshold for abnormal planar QRS‐T angles of 100° in a middle‐aged Finnish population (n = 10 713), the Finnish Social Insurance Institution Coronary Heart Disease Study.11 In future studies, our data may help to set normal limits of the QRS‐T angle more precisely and predict cardiac death even more accurately.
Plausible explanations for differences between our findings and previous studies may lie in different ethnicity and lifestyle differences in the populations; different ECG assessment techniques, equipment and algorithms; and different health status of the individuals.
4.2. Abnormalities of the ECG
In the general population, prevalence of AF was estimated at 0.89% in the United States, and a prevalence of 0.95% was found in patients of Kaiser Permanente of Northern California, a health maintenance organization with nearly 3 million members.26, 27 In our cohort, 0.9% was detected with AF. However, our cohort only captures AF on a single 10‐second ECG, and the history of AF was not taken into account.
Because no exact information exists on the chance of finding PACs on a 10‐second ECG in the general Caucasian population, we were not able to compare our data in detail. A Japanese cohort, the Ibaraki Prefectural Health Study, showed an 8% prevalence of PACs in the included individuals (n = 63 197). The higher prevalence of PACs may be explained by the more narrow range and older average age of the population (40–79 years), and possibly also the ethnicity of the individuals of the large‐scale database from the Ibaraki Prefectural Health Study.28 However, ≥1 PAC was found on 24‐hour Holter monitoring in 99% of all white, middle‐aged individuals. The prevalence increased with age, from 0.8 PACs per hour to 2.6 per hour at age >70 years.29 A circadian rhythm is observed in individuals with frequent PACs (≥720 PACs/d), with a peak value at 3 pm.30 The standardized prevalence of 1.4% in LifeLines seems in line with that Holter data, when ethnicity, the age range of the population, the limited time of ECG data available, and the time of assessment are taken into account. Further study is needed to confirm the prevalence of PACs on a 10‐second ECG.
In our study, 0.53% of the individuals showed MI signs on a 10‐second ECG. In earlier epidemiological studies, the incidence of MI detected on the ECG was clearly described; however, the prevalence of MI in a community‐based population of only Caucasian individuals was not often described, because all individuals with a history of MI were excluded at baseline or the population included more ethnicities than solely Causacian.31, 32
LVH was prevalent in 1.0% of the general population of LifeLines. Difference in criteria of detecting LVH may influence the estimated prevalence, ranging from 19.4% to 0.7% according to the Hermex study, which included 2564 individuals with an age range between 25 and 79 years.33
However, the ECG cannot be used as a surrogate for echocardiogram in detecting LVH in the general population. The echocardiogram is more specific, and coexisting MI may interfere with surface potentials and may mask LVH on the ECG.34
In general, the prevalence of BBBs in the general population is not extensively studied. Right bundle branch block (RBBB) is more common than left bundle branch block (LBBB) in our study. The Copenhagen City Heart Study is a relatively recent prospective study that included 18 974 individuals age ≥20 years. They concluded that RBBB was associated with increasing age and was more prevalent in males. Our study confirms this finding. However, percentages are not comparable due to the prospective nature of the study and exclusion of individuals with previous MI, chronic HF, or LBBB.35
The PVCs are more common in the oldest age group, as data from earlier studies support.36, 37, 38 Of the general population, 1% to 4% is believed to have a high PVC burden (>60 PVCs per 24 hours).38, 39 We show 1.5% with ≥1 PVC per 10‐second ECG in the general population. The Framingham Heart Study reports more PVCs in males than in females, as in LifeLines. Our data confirm the data of studies with smaller sample sizes.
PQ interval >200 ms appeared to be the most common conduction abnormality. The Framingham Heart Study and the Finnish Social Insurance Institution Coronary Heart Disease Study both describe that a first‐degree block (PQ interval >200 ms) is more common in middle‐aged males.39, 40 Similarly, our data show the highest prevalence of PQ interval >200 ms in males age >65 years.
4.3. Study limitations
Strengths of the computerized ECG analyses in the LifeLines cohort include the large sample size (152 180 included individuals), the wide age range (18–93 years), the equal sex distribution (42%:58% males:females), and the consistent method of ECG assessment in all included individuals. The study also has its limitations. Despite strict exclusion criteria to ascertain cardiac health, some individuals may have had clinically silent conditions (eg, myocardial ischemia or MI, rhythm disorder). LifeLines represents the northern Dutch population, and it may not fully represent the Caucasian population in the world, considering possible lifestyle differences that may influence cardiac health and the ECG. The highest age category is relatively small, and, therefore, underpowered. In addition, the analyzed average values and abnormalities of the ECG are representative for the apparently healthy elderly, although most elderly people have a (silent) clinical condition. Errors by the computer program and electrodes were eliminated as far as possible by the ECG assessment model of LifeLines. However, small variations in systematic positioning of electrodes may have been of influence.
5. CONCLUSION
ECG values are analyzed in the most recent and detailed large data source of a Caucasian population. We provide an overview of the average of ECG values and the prevalence of ECG abnormalities. Our analyses underline that age and sex should be taken into account in the assessment of the ECG. In the healthy population, established normal upper limits of both P wave and QRSd may be revised to 130 ms and 105 ms in males age >60 years and >40 years, respectively. Our data of age‐ and sex specific averages of QRS‐T angles in the healthy population may help future researchers use QRS‐T angles more accurately. Our study confirms average values and abnormalities of ECG data analyzed in previous studies with smaller sample sizes.
Author contributions
M.Y. van der Ende and J.E. Siland contributed equally to this article. H. Snieder and P. van der Harst designed the study and performed the analysis. J.E. Siland, M.Y. van der Ende, and M. Rienstra interpreted the data and drafted the manuscript. All authors performed a critical revision of the manuscript.
Conflicts of interest
The authors declare no potential conflicts of interest.
Supporting information
Figure S1. Flowchart of ECG assessment Lifelines. * Criteria for assessing the algorithm of ECG's from the Welch Allyn computer program: atrial fibrillation, atrial flutter, tachycardia >120/min (ventricular and supraventricular), bradycardia <40/min, infarction, acute ischemia, ST‐elevation, Wolf Parkinson White, total AV‐block.
Figure S2. Age and sex as predictors of heart rate, P wave duration, PQ interval, QRS complex duration and QTc interval Blue = men, red = women. Abbreviations: bpm = beats per minute, ms = milliseconds
Table S1. Average values electrocardiogram in the healthy population.
van der Ende MY, Siland JE, Snieder H, van der Harst P, Rienstra M. Population‐based values and abnormalities of the electrocardiogram in the general Dutch population: The LifeLines Cohort Study. Clin Cardiol. 2017;40:865–872. 10.1002/clc.22737
Funding information The LifeLines Cohort Study, and generation and management of GWAS genotype data for the LifeLines Cohort Study, are supported by the Netherlands Organization of Scientific Research NWO (grant 175.010.2007.006); the Ministry of Economic Affairs; the Ministry of Education, Culture and Science; the Ministry for Health, Welfare and Sports; the Northern Netherlands Collaboration of Provinces (SNN); the Province of Groningen; University Medical Center Groningen; the University of Groningen; the Dutch Kidney Foundation; and the Dutch Diabetes Research Foundation.
REFERENCES
- 1. Machado Leite S, Freitas J, Campelo M, et al. Electrocardiographic evaluation in athletes: ‘normal’ changes in the athlete's heart and benefits and disadvantages of screening. Rev Port Cardiol. 2016;35:169–177. [DOI] [PubMed] [Google Scholar]
- 2. Rijnbeek PR, van Herpen G, Bots ML, et al. Normal values of the electrocardiogram for ages 16–90 years. J Electrocardiol. 2014;47:914–921. [DOI] [PubMed] [Google Scholar]
- 3. Dewhurst MJ, Di Marco LY, Dewhurst F, et al. Electrocardiographic reference values for a population of older adults in sub‐Saharan Africa. Ann Noninvasive Electrocardiol. 2014;19:34–42. [DOI] [PMC free article] [PubMed] [Google Scholar]
- 4. Rautaharju PM, Zhang ZM, Gregg RE, et al. Normal standards for computer‐ECG programs for prognostically and diagnostically important ECG variables derived from a large ethnically diverse female cohort: the Women's Health Initiative (WHI). J Electrocardiol. 2013;46:707–716. [DOI] [PMC free article] [PubMed] [Google Scholar]
- 5. Macfarlane PW, Katibi IA, Hamde ST, et al. Racial differences in the ECG—selected aspects. J Electrocardiol. 2014;47:809–814. [DOI] [PubMed] [Google Scholar]
- 6. Sachin Khane R, Surdi AD. Gender differences in the prevalence of electrocardiogram abnormalities in the elderly: a population survey in India. Iran J Med Sci. 2012;37:92–99. [PMC free article] [PubMed] [Google Scholar]
- 7. Klijs B, Scholtens S, Mandemakers JJ, et al. Representativeness of the LifeLines Cohort Study. PLoS One. 2015;10:e0137203. [DOI] [PMC free article] [PubMed] [Google Scholar]
- 8. van der Ende MY, Hartman MH, Hagemeijer Y, et al. The LifeLines Cohort Study: prevalence and treatment of cardiovascular disease and risk factors. Int J Cardiol. 2016;228:495–500. [DOI] [PubMed] [Google Scholar]
- 9. Scholtens S, Smidt N, Swertz MA, et al. Cohort profile: LifeLines, a three‐generation cohort study and biobank. Int J Epidemiol. 2015;44:1172–1180. [DOI] [PubMed] [Google Scholar]
- 10. Allyn Welch. MEANS ECG Physicians’ Manual for Welch Allyn CP Series Electrocardiographs https://www.welchallyn.com/content/dam/welchallyn/documents/sap‐documents/LIT/80011/80011564LITPDF.pdf. Revised July 2016. Accessed September 2016.
- 11. Aro AL, Huikuri HV, Tikkanen JT, et al. QRS‐T angle as a predictor of sudden cardiac death in a middle‐aged general population. Europace. 2012;14:872–876. [DOI] [PubMed] [Google Scholar]
- 12. Macfarlane PW. The frontal plane QRS‐T angle. Europace. 2012;14:773–775. [DOI] [PubMed] [Google Scholar]
- 13. Hancock EW, Deal BJ, Mirvis DM, et al. AHA/ACCF/HRS recommendations for the standardization and interpretation of the electrocardiogram: part V: Electrocardiogram changes associated with cardiac chamber hypertrophy: a scientific statement from the American Heart Association Electrocardiography and Arrhythmias Committee, Council on Clinical Cardiology; the American College Of Cardiology Foundation; and the Heart Rhythm Society . Endorsed by the International Society for Computerized Electrocardiology. J Am Coll Cardiol . 2009;53:992–1002. [DOI] [PubMed] [Google Scholar]
- 14. Meems LM, de Borst MH, Postma DS, et al. Low levels of vitamin D are associated with multimorbidity: results from the LifeLines Cohort Study. Ann Med. 2015;47:474–481. [DOI] [PubMed] [Google Scholar]
- 15. Cochran WG, ed. Sampling Techniques . 3rd ed. New York, NY: John Wiley & Sons; 1977. [Google Scholar]
- 16. Macfarlane PW. Comprehensive Electrocardiology: Theory and Practice in Health and Disease . Oxford, UK: Pergamon Press; 1989:407–457. [Google Scholar]
- 17. Mason JW, Ramseth DJ, Chanter DO, et al. Electrocardiographic reference ranges derived from 79 743 ambulatory subjects. J Electrocardiol. 2007;40:228–234. [DOI] [PubMed] [Google Scholar]
- 18. Clark AN, Craven AH. PR interval in the aged. Age Ageing. 1981;10:157–164. [DOI] [PubMed] [Google Scholar]
- 19. Levine SA. Clinical Heart Disease . Philadelphia, PA: W.B. Saunders; 1958:422. [Google Scholar]
- 20. Friedberg CK. Diseases of the Heart . London, UK: W.B. Saunders; 1966:37. [Google Scholar]
- 21. Stock JPP. Diagnosis and Treatment of Cardiac Arrhythmias . London, UK: Butterworth; 1970:32. [Google Scholar]
- 22. Marriott HJL. Practical Electrocardiography . Baltimore, MD: William Wilkins Co; 1972:18. [Google Scholar]
- 23. Barnes RM, Levy MN. Cardiovascular Physiology . St Louis, MO: C.V. Mosby Co; 1972:28. [Google Scholar]
- 24. Zhang X, Zhu Q, Zhu L, et al. Spatial/frontal QRS‐T angle predicts all‐cause mortality and cardiac mortality: a meta‐analysis. PLoS One. 2015;10:e0136174. [DOI] [PMC free article] [PubMed] [Google Scholar]
- 25. Macfarlane PW. Comprehensive Electrocardiology: Theory and Practice in Health and Disease . Oxford, UK: Pergamon Press; 1989;3:1459. [Google Scholar]
- 26. Feinberg WM, Blackshear JL, Laupacis A, et al. Prevalence, age distribution, and gender of patients with atrial fibrillation: analysis and implications. Arch Intern Med. 1995;155:469–473. [PubMed] [Google Scholar]
- 27. Go AS, Hylek EM, Phillips KA, et al. Prevalence of diagnosed atrial fibrillation in adults: National implications for rhythm management and stroke prevention: the Anticoagulation and Risk Factors in Atrial Fibrillation (ATRIA) study. JAMA. 2001;285:2370–2375. [DOI] [PubMed] [Google Scholar]
- 28. Murakoshi N, Xu D, Sairenchi T, et al. Prognostic impact of supraventricular premature complexes in community‐based health checkups: the Ibaraki Prefectural Health Study. Eur Heart J. 2015;36:170–178. [DOI] [PubMed] [Google Scholar]
- 29. Conen D, Adam M, Roche F, et al. Premature atrial contractions in the general population: Frequency and risk factors. Circulation. 2012;126:2302–2308. [DOI] [PubMed] [Google Scholar]
- 30. Larsen BS, Kumarathurai P, Nielsen OW, et al. The circadian variation of premature atrial contractions. Europace. 2016;18:1573–1580. [DOI] [PubMed] [Google Scholar]
- 31. Zhang ZM, Rautaharju PM, Prineas RJ, et al. Race and sex differences in the incidence and prognostic significance of silent myocardial infarction in the Atherosclerosis Risk In Communities (ARIC) study. Circulation. 2016;133:2141–2148. [DOI] [PMC free article] [PubMed] [Google Scholar]
- 32. Zhang ZM, Rautaharju PM, Prineas RJ, et al. Usefulness of electrocardiographic QRS/T angles with versus without bundle branch blocks to predict heart failure (from the atherosclerosis risk in communities study). Am J Cardiol. 2014;114:412–418. [DOI] [PMC free article] [PubMed] [Google Scholar]
- 33. Félix‐Redondo FJ, Fernández‐Bergés D, Calderón A, et al. Prevalence of left‐ventricular hypertrophy by multiple electrocardiographic criteria in general population: Hermex study. J Hypertens. 2012;30:1460–1467. [DOI] [PubMed] [Google Scholar]
- 34. Casiglia E, Schiavon L, Tikhonoff V, et al. Electrocardiographic criteria of left ventricular hypertrophy in general population. Eur J Epidemiol. 2008;23:261–271. [DOI] [PubMed] [Google Scholar]
- 35. Bussink BE, Holst AG, Jespersen L, et al. Right bundle branch block: prevalence, risk factors, and outcome in the general population: results from the Copenhagen City Heart Study. Eur Heart J. 2013;34:138–146. [DOI] [PubMed] [Google Scholar]
- 36. Southall DP, Johnston F, Shinebourne EA, et al. 24‐hour electrocardiographic study of heart rate and rhythm patterns in population of healthy children. Br Heart J. 1981;45:281–291. [DOI] [PMC free article] [PubMed] [Google Scholar]
- 37. Camm AJ, Evans KE, Ward DE, et al. The rhythm of the heart in active elderly subjects. Am Heart J. 1980;99:598–603. [DOI] [PubMed] [Google Scholar]
- 38. Latchamsetty R, Bogun F. Premature ventricular complexes and premature ventricular complex induced cardiomyopathy. Curr Probl Cardiol. 2015;40:379–422. [DOI] [PubMed] [Google Scholar]
- 39. Bikkina M, Larson MG, Levy D. Prognostic implications of asymptomatic ventricular arrhythmias: the Framingham Heart Study. Ann Intern Med. 1992;117:990–996. [DOI] [PubMed] [Google Scholar]
- 40. Aro AL, Anttonen O, Kerola T, et al. Prognostic significance of prolonged PR interval in the general population. Eur Heart J. 2014;35:123–129. [DOI] [PubMed] [Google Scholar]
Associated Data
This section collects any data citations, data availability statements, or supplementary materials included in this article.
Supplementary Materials
Figure S1. Flowchart of ECG assessment Lifelines. * Criteria for assessing the algorithm of ECG's from the Welch Allyn computer program: atrial fibrillation, atrial flutter, tachycardia >120/min (ventricular and supraventricular), bradycardia <40/min, infarction, acute ischemia, ST‐elevation, Wolf Parkinson White, total AV‐block.
Figure S2. Age and sex as predictors of heart rate, P wave duration, PQ interval, QRS complex duration and QTc interval Blue = men, red = women. Abbreviations: bpm = beats per minute, ms = milliseconds
Table S1. Average values electrocardiogram in the healthy population.