

Abstract
Background
Observational studies evaluating the relationship between ideal cardiovascular health (CVH) metrics and risk of cardiovascular (CV) events and mortality yielded inconsistent results.
Hypothesis
Improvement in CVH metrics can result in substantial reductions in the risk of cardiovascular disease (CVD), stroke, and mortality.
Methods
We examined associations between ideal CVH metrics and CV events and mortality by conducting a meta‐analysis of data from prospective cohort studies identified by searching PubMed and Web of Science from their inception to February 2017 and reviewing the reference lists of the retrieved articles.
Results
Thirteen prospective studies involving a total of 193 126 cohort members were included in this meta‐analysis. When comparing the most to the least category of ideal CVH metrics, the overall relative risks (RRs) were 0.54 (95% confidence interval [CI]: 0.41‐0.69) for all‐cause mortality, 0.30 (95% CI: 0.18‐0.51) for CV mortality, 0.22 (95% CI: 0.11‐0.42) for CVD, and 0.33 (95% CI: 0.20‐0.55) for stroke, respectively. A linear dose–response relationship was seen in all‐cause and CV mortality. The risk decreased by 11% and 19% for each increase in ideal CVH metrics. For the analyses of ideal health status in relation to all‐cause and CV mortality, significant results were obtained from smoking, diet, physical activity, plasma glucose levels, and blood pressure.
Conclusions
Ideal CVH status, or even 1 point increase in CVH metrics, can result in substantial reductions in the risk of CVD, stroke, and mortality. Improving metrics of smoking, diet, physical activity, plasma glucose levels, and blood pressure will achieve the highest benefits.
Keywords: Cardiovascular Events, Ideal Cardiovascular Health Metrics, Meta‐Analysis, Mortality
1. INTRODUCTION
Cardiovascular disease (CVD) is the leading cause of death worldwide and is a huge drain on public health expenditures.1 In 2010, the American Heart Association (AHA) proposed the construct of ideal cardiovascular health (CVH) for reducing the risk of cardiovascular (CV) mortality.2 This concept addressing CVH comprises 4 health‐related behaviors (smoking, diet, physical activity, and body mass index [BMI]) and 3 health factors (fasting plasma glucose [FPG] levels, total cholesterol [TC], and blood pressure [BP]).
Recent data have indicated that the presence of more ideal CVH metrics is inversely associated with the incidence of CVD, stroke, and mortality.3, 4, 5, 6, 7, 8, 9, 10, 11, 12, 13 According to a previous meta‐analysis,14 the aggregated risk estimate derived from 4 studies suggested 75% and 45% markedly lower risks for CV and all‐cause mortality, respectively. Although this meta‐analysis was strongly heterogeneous, it did not further examine the sources of this heterogeneity, such as subgroup analysis and a graph of dose–response relationship. Moreover, this meta‐analysis ignored some important cohort studies.15, 16
Currently, the beneficial effects of ideal CVH metrics have been widely supported by increasing scientific evidence. But the relationships between ideal CVH metrics and the risk of CV events or mortality are still not well measured. Moreover, meta‐analyses that explored the associations of ideal health status from individual CVH metrics with all‐cause and CV mortality are lacking. We therefore aimed to review current evidence from cohort studies on ideal CVH metrics in relation to the risk of CVD, stroke, and mortality. Furthermore, the potential dose–response patterns were evaluated.
2. METHODS
2.1. Search strategy
We performed a comprehensive, computerized literature search in PubMed and Web of Science from their inception to February 2017. The following search keywords were applied: (“cardiovascular health metrics” OR “ideal cardiovascular health” OR “Life's Simple 7”) AND (“mortality” OR “death” OR “cardiovascular disease” OR “stroke” OR “cerebrovascular disease” OR “coronary heart disease”) AND “prospective.” Moreover, the reference lists of retrieved papers were manually searched for the possible studies. In addition, we also manually searched the reference lists of relevant publications to identify additional studies.
2.2. Study selection
To be included in the meta‐analysis, studies had to (1) report CV events (CVD, coronary heart disease, stroke) or (CV mortality) or all‐cause mortality as the outcome of interest; (2) be conducted in a general healthy population or a specific disease‐related population; (3) use an observational, prospective cohort design; (4) present information on ideal CVH metrics as the exposure of interest; (5) provide estimates of relative risk (RR)/hazard ratio (HR) with confidence intervals (CI) or SEs; and (6) report adjusted risk estimates for the greatest attainment of ideal CVH metrics and CV events or all‐cause mortality, comparing the most to least ideal CVH metrics difference.
2.3. Data extraction and quality assessment
According to standardized protocol, 2 reviewers (LG and SZ) independently extracted these data from the included articles: authors, publication year, origin of the study, study design, sample size, percentage of males, population age at baseline, ideal CVH metrics comparison, number of CV events, the most fully adjusted risk estimate, duration of follow‐up, and adjustments for covariates. Discrepancies in the data extraction were resolved by discussion and consensus. Methodological quality of included studies was examined using the Newcastle‐Ottawa Scale (NOS) for cohort studies.17
2.4. Statistical analysis
The multivariate‐adjusted HR with 95% CI was pooled comparing the most ideal to the least ideal CVH metrics. Heterogeneity among studies was assessed with Cochrane Q test and I 2 statistic, and results were defined as heterogeneous for a P value <0.10 or an I 2 > 50%.18 We chose a random‐effects model in the pooled analysis when the substantial heterogeneity was observed; otherwise, a fixed‐effect model was selected.
We conducted stratified analysis by such specific study characteristics as duration of follow‐up, sample size, number of cases, population age at baseline, study location, and adjustment for confounders (eg, history of CVD and alcohol consumption). Furthermore, we performed sensitivity analyses by excluding 1 study at a time to test the influence of each individual study on the pooled estimate. Potential publication bias was evaluated by formal testing using Egger and Begg tests.
When comparing the most with the least category of ideal CVH metrics, people who achieved the most ideal CVH metrics were allocated to the optimal CVH category group, and people with the least (fewest) ideal CVH metrics were regarded as the poorest CVH group. Ideal CVH score ranged 0 to 14 for all metrics by assigning a value of 0 for poor health, 1 for intermediate health, and 2 for ideal health for each metric. People who the achieved highest scores were allocated to the optimal CVH category group, and people with the lowest scores were regarded as the poorest CVH group. When comparing the most with the least category of ideal CVH status from individual metrics, ideal health, intermediate health, and poor health were defined according to the categories of each metric presented by included studies.
To strengthen the findings and further evaluate the dose–response relationship between ideal CVH metrics and death, we conducted regression analysis using generalized least squares regression models. All statistical analyses were carried out with Stata version 13.0 (StataCorp LP, College Station, TX). P values were 2‐sided, with a significance level of 0.05 if not specified.
3. RESULTS
3.1. Literature search and study characteristics
Our systematic literature search yielded a total of 13 articles3, 4, 5, 6, 7, 8, 9, 10, 11, 12, 13, 15, 16 in which the associations between ideal CVH metrics and the risk of CVD, stroke, and mortality were reported. A flow chart for the search process is presented in Figure 1. Initially, 375 records were identified from the 2 databases; after a review of the titles and abstracts, 358 records were excluded because they were duplicates or not relevant. After reviewing the full text of the remaining 17 cohort studies, 5 studies were excluded (specific reasons listed in Figure 1). One study that was identified by checking the reference lists of retrieved articles was also included.15 Finally, a total of 13 studies were included in the final analysis (Table 1). Specially, 4 studies analyzed data from the same cohort, of which 3 studies addressed different outcomes including CVD, stroke, all deaths, or CV deaths and 1 study used ideal CVH score ranging from 0 to 14, assigning a value of 0 for poor health, 1 for intermediate health, and 2 for ideal health for each metric.
Figure 1.
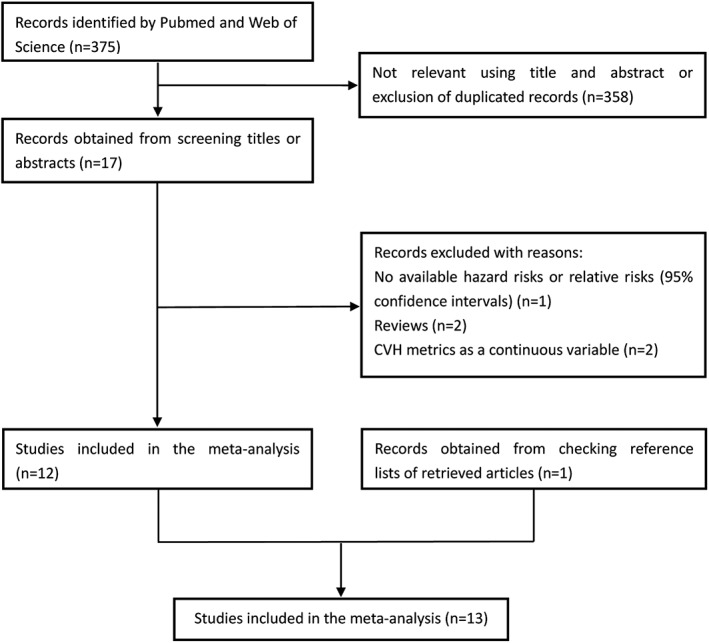
Flow chart of study‐selection process. Abbreviations: CVH, cardiovascular health
Table 1.
General characteristics of prospective studies of ideal CVH metrics and CV events or mortality
| Author/Year | Country | Cohort or Location | Subjects (% Male) | No. of Events | Baseline Age, y | Quantity | Events/Number, HR (95% CI) | Follow‐up, y | Adjustments | NOS Score |
|---|---|---|---|---|---|---|---|---|---|---|
| Artero et al, 20123 | US | ACLS | 14 572 (62.3) | 305 (all death); 70 (CV death) | 46 ± 9.9 | No. of ideal CVH metrics, 5–7 vs 0–2 | 0.77 (0.53‐1.12) all death; 0.37 (0.15‐0.95) CV death | 11.6 | Age, sex, examination year, alcohol use, family history of CVD | 7 |
| Ford et al, 20124 | US | NHANES | 7622 (62.5) | 439 (all death); 90 (CV death) | 43.0 | No. of ideal CVH metrics, 6–7 vs 0 | 0.21 (0.07‐0.59) all death; 0.10 (0.02‐0.47) CV death | 5.8 | Age, sex, race/ethnicity, education, self‐reported health status, health insurance, alcohol use, cancer history | 7 |
| Kim et al, 20135 | Korea | Seoul Male Cohort Study | 12 538 (100) | 1054 (all death); 171 (CV death) | 47.5 | No. of ideal CVH metrics, 6–7 vs 0–2 | 0.42 (0.31‐0.59) all death; 0.10 (0.03‐0.29) CV death | 18 | Age, educational attainment, alcohol use, family history of CVD | 8 |
| Liu et al, 20146 | China | Kailuan Study | 95 429 (79.75) | 1564 (all death); 458 (CV death) | 51.5 | No. of ideal CVH metrics, 5–7 vs 0–1 | 0.69 (0.54‐0.89) all death; 0.58 (0.37‐0.92) CV death | 4.0 | Age; sex; average income; education level; alcohol use; history of MI, stroke, and cancer | 7 |
| Folsom et al, 20117 | US | ARIC | 12 744 (NP) | 3063 (CVD) | 54.0 | No. of ideal CVH metrics, 6–7 vs 0 | 0.11 (0.07‐0.17) CVD | 18.7 | Age, race, sex | 8 |
| Kulshreshtha et al, 20138 | US | REGARDS | 22 914 (42) | 432 (stroke) | 65.0 | No. of ideal CVH metrics, 6–7 vs 0 | 0.34 (0.08‐1.52) stroke | 4.9 | Age, sex, socioeconomic status, alcohol use, education, geographic region | 7 |
| Lachman et al, 20159 | UK | EPIC–Norfolk cohort | 10 043 (44.1) | 1175 (CVD); 171 (stroke) | 57.0 | Ideal CVH score, 12–14 vs 0–2 | 0.07 (0.02‐0.23) CVD; 0.16 (0.02‐1.37) stroke | 10 | Age, sex | 8 |
| Miao et al, 201510 | China | Kailuan Study | 91 598 (79.5) | 3276 (CVD); 2579 (stroke) | 51.55 ± 12.36 | Ideal CVH score, 10–14 vs 0–4 | 0.29 (0.24‐0.35) CVD; 0.30 (0.24‐0.37) stroke | 6.8 | Age, sex, alcohol consumption, income, education, history of CVD, heart rate, uric acid, hs‐CRP | 7 |
| Ommerborn et al, 201611 | US | Jackson Heart Study | 4702 (NP) | 292 (CVD) | 40–67 | No. of ideal CVH metrics, 4–7 vs 0–1 | 0.53 (0.27‐1.08) male; 0.16 (0.06‐0.42) female; 0.29 (0.17‐0.52) overall | 8.3 | Age, income, education | 7 |
| Wu et al, 201212 | China | Kailuan Study | 91 698 (79.4) | 1811 (CVD) | 51.5 | No. of ideal CVH metrics, 6–7 vs 0 | 0.21 (0.09‐0.50) male; 0.04 (0.00‐0.42) female; 0.18 (0.08‐0.40) overall | 4.0 | Age, sex, average income, education | 7 |
| Zhang et al, 201313 | China | Kailuan Study | 91 698 (79.4) | 1486 (stroke) | 51.5 | No. of ideal CVH metrics, 6–7 vs 0 | 0.28 (0.12‐0.66) male; 0.14 (0.02‐1.03) female; 0.24 (0.11‐0.54) overall | 4.0 | Age, education, average monthly income of every family member, hospital | 7 |
| Dong et al, 201215 | US | NOMAS | 2981 (36.3) | 1123 (all death); 435 (CV death); 722 (CVD); 208 (stroke) | 69.0 | No. of ideal CVH metrics, 5–7 vs 0–1 | 0.59 (0.43‐0.81) all death; 0.48 (0.29‐0.80) CV death; 0.41 (0.26‐0.63) CVD; 0.43 (0.21‐0.91) stroke | 11 | Age, sex, race/ethnicity | 8 |
| Yang et al, 201216 | US | NHANES | 13 312 (NP) | 2673 (all death); 1085 (CV death) | 46.8 | No. of ideal CVH metrics, 6–7 vs 0–1 | 0.41 (0.28‐0.61) all death; 0.22 (0.11‐0.41) CV death | 14.5 | Age, sex, race/ethnicity | 8 |
Abbreviations: ACLS, Aerobics Center Longitudinal Study; ARIC, Atherosclerosis Risk In Communities; CV, cardiovascular; CVD, cardiovascular disease; CVH, cardiovascular health; EPIC, European Prospective Investigation into Cancer; HR, hazard ratio; hs‐CRP, high‐sensitivity C‐reactive protein; MI, myocardial infarction; NHANES, National Health and Nutrition Examination Survey; NOMAS, Northern Manhattan Study; NOS, Newcastle‐Ottawa Scale; NP, not provided; REGARDS, Reasons for Geographic and Racial Differences in Stroke; RR, risk ratio; UK, United Kingdom; US, United States.
The included studies were published between 2011 and 2017. The sample sizes of the included studies varied from 2981 to 95 429, and follow‐up duration ranged from 4.0 to 18.7 years. Overall, the methodological quality of the included studies was generally high according to the 9‐star NOS. Quality assessment by the NOS did not show low‐quality studies (≥6). Table 1 summarizes the characteristics of the individual studies.
3.2. Ideal CVH metrics and all‐cause or CV mortality risk
Six studies3, 4, 5, 6, 15, 16 reporting the outcomes of deaths among cohort members were included in the analysis, which indicated that achieving the greatest number of ideal CVH metrics was related to a significantly reduced risk of all‐cause mortality (HR for most vs least group: 0.54, 95% CI: 0.41‐0.69, I 2 = 65.1%, P = 0.014) and CV mortality (HR for most vs least group: 0.30, 95% CI: 0.18‐0.51, I 2 = 66.3%, P = 0.011) under a random‐effects model (Figure 2). In analysis of ideal CVH metrics and all‐cause mortality, visual inspection of Begg and Egger regression tests provided no evidence of publication bias (Begg test, P = 0.260; Egger test, P = 0.210). Similarly, no publication bias was observed by Begg rank correlation test (P = 0.133) in the meta‐analysis on the association between ideal CVH metrics and risk of CV mortality.
Figure 2.
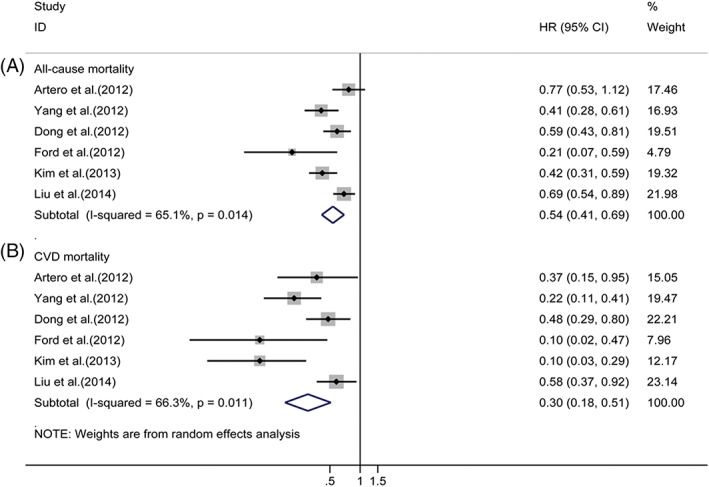
Relative risks of (A) all‐cause mortality or (B) CV mortality for most vs least category of ideal CVH metrics. Abbreviations: CI, confidence interval; CV, cardiovascular; CVD, cardiovascular disease; CVH, cardiovascular health; HR, hazard ratio
3.3. Subgroup and sensitivity analysis
In subgroup analyses, the associations between ideal CVH metrics and risk of all‐cause mortality did not differ substantially by duration of follow‐up, sample size, number of cases, population age at baseline, study location, and adjustment for alcohol consumption and history of CVD (see Supporting Information, Table 1, in the online version of this article). In general, results from the meta‐regression analysis indicated that no significant heterogeneity was observed between subgroups.
A random‐effects meta‐regression was performed to determine the sources of the >60% observed heterogeneity between the studies. Significant heterogeneity was associated with the population age at baseline for CV mortality (see Supporting Information, Table 2, in the online version of this article). The subgroup analysis showed that the risk of CV mortality was even lower in patients with lower mean age (<50 years; HR: 0.2, 95% CI: 0.11‐0.35, I 2 = 24%, P = 0.267) than in those with higher mean age (≥50 years; HR: 0.53, 95% CI: 0.38‐0.75, I 2 = 0%, P = 0.586).
Table 2.
Meta‐analysis of all‐cause and CV mortality associated with ideal health status of CVH metrics
| Ideal CVH metrics | All‐Cause Mortality | CV Mortality | ||||||
|---|---|---|---|---|---|---|---|---|
| RR | 95% CI | I 2, % | P Value for Heterogeneity | RR | 95% CI | I 2, % | P Value for Heterogeneity | |
| Smoking | 0.59 | 0.45–0.78 | 91.0 | 0.000 | 0.54 | 0.38–0.77 | 79.3 | 0.001 |
| BMI | 1.02 | 0.93–1.12 | 26.3 | 0.247 | 0.97 | 0.80–1.16 | 34.2 | 0.193 |
| Physical activity | 0.80 | 0.71–0.89 | 54.7 | 0.065 | 0.76 | 0.67–0.87 | 0.0 | 0.806 |
| Healthy diet score | 0.77 | 0.59–1.00 | 55.8 | 0.079 | 0.73 | 0.53–1.00 | 10.3 | 0.342 |
| TC | 1.05 | 0.90–1.22 | 70.2 | 0.009 | 0.95 | 0.84–1.08 | 0.0 | 0.683 |
| BP | 0.79 | 0.73–0.86 | 0.0 | 0.793 | 0.47 | 0.34–0.65 | 63.4 | 0.027 |
| FPG | 0.60 | 0.53–0.67 | 0.0 | 0.640 | 0.58 | 0.47–0.72 | 1.5 | 0.362 |
| HbA1c | 0.71 | 0.62–0.82 | 14.7 | 0.279 | 0.69 | 0.57–0.83 | 0.0 | 0.367 |
Abbreviations: BMI, body mass index; BP, blood pressure; CI, confidence interval; CV, cardiovascular; CVH, cardiovascular health; FPG, fasting plasma glucose; HbA1c, glycated hemoglobin; RR, risk ratio; TC, total cholesterol.
To explore the influence of multivariate adjustment, several sensitivity analyses were carried out. We removed 1 study at a time sequentially to reanalyze the data with the risk estimates for all‐cause mortality ranging from 0.50 (95% CI: 0.38‐0.66), when excluding the study by Artero et al, to 0.57 (95% CI: 0.43‐0.75) after omission of the study by Kim et al. None of the studies considerably affected the summary results. The sensitivity analyses results ranged from 0.25 (95% CI: 0.14‐0.45) to 0.37 (95% CI: 0.23‐0.59) for CV mortality.
3.4. Ideal CVH metrics and CVD
The relationship between ideal CVH metrics and risk of CV events was evaluated in 6 studies (see Supporting Information, Figure 1, in the online version of this article).7, 9, 10, 11, 12, 15 In the stratified analysis by the categorization of ideal CVH, the pooled RR and 95% CI of ideal CVH metrics was 0.22 (95% CI: 0.11‐0.42) with high heterogeneity (I 2 = 80.4%, P = 0.000) and no publication bias (Begg test, P = 0.734; Egger test, P = 0.970). Moreover, the pooled RR of ideal CVH score was 0.16 (95% CI: 0.04‐0.64), with significant heterogeneity (I 2 = 80.3%, P = 0.024) and no publication bias according to Begg testing (P = 1.000).
3.5. Ideal CVH metrics and stroke risk
The pooled RRs (95% CI) of these studies8, 9, 10, 12, 13, 15 for the most vs least category of ideal CVH metrics are listed in the Supporting Information, Figure 2, in the online version of this article. A pooled analysis yielded the findings that ideal CVH metrics were significantly linked with the occurrence of stroke in a random‐effects model, and the RR was 0.33 (95% CI: 0.20‐0.55) without heterogeneity (I 2 = 0%, P = 0.713). Additionally, the combined RR for ideal CVH score was 0.30 (95% CI: 0.24‐0.37) with no heterogeneity (I 2 = 0%, P = 0.562).
3.6. Ideal CVH status and all‐cause or CV mortality risk
Among individual CVH metrics, the association between ideal CVH status (for the ideal vs poor category) and mortality was examined in 5 studies.3–6,16 For diet, we only included 4 studies because 1 study used low salt intake as a surrogate of ideal diet without precise data, which might distort the effects of diet on mortality. Table 2 summarizes the detailed results of the meta‐analysis. Our analysis showed that ideal CVH status was associated with decreased risk of all‐cause mortality and CV mortality, respectively, for smoking (RR for all‐cause mortality: 0.59, 95% CI: 0.45‐0.78 and RR for CV mortality: 0.54, 95% CI: 0.38‐0.77), diet (RR: 0.77, 95% CI: 0.59‐1.00 and RR: 0.73, 95% CI: 0.53‐1.00), physical activity (RR: 0.80, 95% CI: 0.71‐0.89 and RR: 0.76, 95% CI: 0.67‐0.87), FPG (RR: 0.60, 95% CI: 0.53‐0.67 and RR: 0.58, 95% CI: 0.47‐0.72), glycated hemoglobin ([HbA1c] RR: 0.71, 95% CI: 0.62‐0.82 and RR: 0.69, 95% CI: 0.57‐0.83), and BP (RR: 0.79, 95% CI: 0.73‐0.86 and RR: 0.47, 95% CI: 0.34‐0.65). No association was found with TC (RR: 1.05, 95% CI: 0.90‐1.22 and RR: 0.95, 95% CI: 0.84‐1.08) and BMI (RR: 1.02, 95% CI: 0.93‐1.12 and RR: 0.97, 95% CI: 0.80‐1.16).
Moderate heterogeneity was observed across studies (see Supporting Information, Figure 3, in the online version of this article). Heterogeneity found for smoking was mainly due to 1 study, by Liu et al.; after this study was excluded, heterogeneity was reduced with no substantial changes in risk estimates (I 2 = 0.0%, P = 0.529 for all‐cause mortality and I 2 = 0.0%, P = 0.886 for CV mortality). No evidence of publication bias was detected except for TC and BP (see Supporting Information, Table 3, in the online version of this article).
Figure 3.
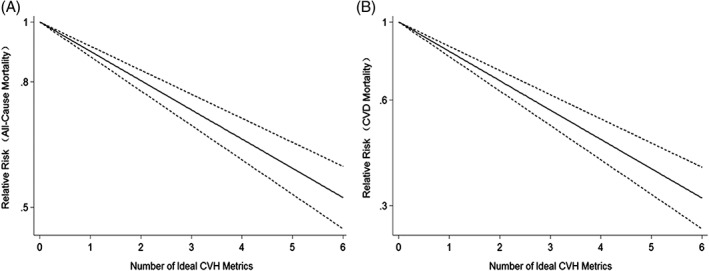
Dose–response analysis of ideal CVH metrics and risks of (A) all‐cause mortality and (B) CVD mortality. Solid line indicates best‐fitting restricted cubic spline; dotted lines indicate 95% CI. Abbreviations: CI, confidence interval; CVD, cardiovascular disease; CVH, cardiovascular health
3.7. Dose–response analysis
Six prospective cohort studies3, 4, 5, 6, 15, 16 were included. The test for nonlinearity (P = 0.263) supported a linear model and indicated that each increase in ideal CVH metrics was associated with a 11% lower risk of all‐cause mortality (RR: 0.89, 95% CI: 0.86‐0.93; Figure 3A).
For CV mortality, the test for nonlinearity was not significant (P = 0.650) and the results indicated that per‐unit increase in ideal CVH metrics was associated with a 19% lower risk of CV mortality (RR: 0.81, 95% CI: 0.76‐0.86; Figure 3B).
4. DISCUSSION
Our meta‐analysis of 13 studies based on 10 cohorts showed that subjects having the highest number of ideal CVH metrics had 78% lower risk of overall CVD, 67% lower risk of stroke, as well as 70% and 46% markedly lower risks for CV and all‐cause mortality, respectively. In addition, the analysis indicated a linear relationship that each increase in ideal CVH metrics was associated with a 19% and 11% lower risk for CV and all‐cause mortality. Additionally, the associations were markedly consistent in the sensitivity analyses. Mostly the results of our subgroup analyses were quite similar and robust, but we found that the population age at baseline may be the source of heterogeneity for CV mortality.
It was biologically plausible that favorable ideal CVH metrics were linked with lower risk of CVD events. Higher numbers of ideal CVH factors have been associated with a reduced risk of coronary artery calcification19 and pulse wave velocity,20 some well‐established risk predictors in the development of CVD. Furthermore, the vigorous role of ideal CVH protecting against the incidence of acute myocardial infarction,10, 15 heart failure,21 atrial fibrillation,22 and hypertension23 has been recognized. This convincing evidence indicated that ideal CVH, as described in the AHA 2020 Impact Goal, protects populations from mortality.
Notably, among individual CVH metrics, smoking, diet, physical activity, FPG levels, and BP contributed to the reduction in risk of both all‐cause and CV mortality. Previous quantitative reviews suggested that smoking, an established risk factor, has been proven to exert adverse effects on mortality.24, 25 In addition, physical activity and diet quality have been associated with reduced risk of CVD and mortality.26, 27 Levels of HbA1c have been recognized as predictors of all‐cause mortality.28 Both high and low levels of HbA1c were associated with an increased risk of all‐cause mortality in patients with diabetes mellitus.29 Similarly, FPG level was a well‐known risk factor for death.30 Low FPG levels (<70 or 80 mg/dL) had a high risk of CVD and all‐cause mortality.31 In contrast to our results, individual studies have reported a systolic BP of 120 to 139 mm Hg was associated with the lowest risk of CV mortality in middle‐aged and elderly adults.32
However, BMI and TC status were not significantly related to mortality from CV and all causes. A recent meta‐analysis indicated that BMI did not increase the risk of CVD when traditional CV risk factors exist, such as diabetes mellitus history and cholesterol measures.33 In addition, long follow‐up time may have blunted some risks associated with BMI. Currently, the value of serum TC as a predictor of CV and all‐cause mortality remains controversial. In elderly populations, low serum TC has often been seen as a marker of frailty, which is associated with an enhanced risk of death.34 Additionally, cholesterol‐reduction treatment is considered the mainstay of CVD prevention. Evidence from 3 prospective studies showed that elevated serum TC was associated with increased all‐cause and CV mortality in middle‐aged adults.35 Of note, most of the cohorts included in our meta‐analysis reported that an average age > 40 years; it was possible that age may be a contributing factor. So the difference of age groups should be more pronounced, suggesting that the effects of serum TC on mortality may not become apparent. Specifically, due to the limited data retrieved from the analyses, we failed to explore the association between ideal CVH status and CVD or stroke.
Recently, the potential role of favorable CVH status as a protector against mortality has aroused much controversy. Our findings received some support from observational studies, but the definition of ideal CVH metrics may not be exhaustive. This classification did not take into account some potential biases such as age and sex. Additionally, some new indicators, such as the variability of FPG and interarm differences in BP measurements, have emerged to be predictors of CV events or mortality. Based on current evidence, further investigation will be required to redefine ideal CVH profiles.
4.1. Study limitations
The current study has several advantages compared with the previous published meta‐analyses. More studies are included to clarify the associations between ideal CVH metrics and the risk of CVD or mortality. And we assessed and compared the individual CVH metrics and their relationships with all‐cause and CV mortality. In addition, the subgroup analysis and meta‐regression were employed to assess the probability of heterogeneity. Furthermore, a dose–response analysis was also conducted to see the possible associations; therefore, the results are more reliable.
Some limitations of our meta‐analysis should be considered. First, there are some between‐study variances in the measurements of ideal CVH metrics. This is most pronounced with different reference standard. Second, there is a considerable difference in the populations assessed across studies in terms of age, sex, distribution of socioeconomic status, genetic background, lifestyle, and dietary patterns. Third, some studies merely adjusted for age and sex and failed to adjust for other potential risk factors, such as alcohol consumption and history of CVD. Fourth, CVH was defined based on the baseline assessments. Given the long period of follow‐up, it is very likely that the levels of CVH metrics may change over time, leading to the underestimation of true associations.
5. CONCLUSION
Our findings suggest that ideal CVH status, and even a 1‐point increase in CVH metrics, can result in substantial reductions in CVD risk and mortality. In light of current evidence, we highlight the need to improve the metrics of smoking, diet, physical activity, FPG levels, and BP. More research efforts are needed to fully understand the extent of protection that ideal CVH status confers on CVD outcomes and mortality. Ongoing efforts need to improve current policies for enhancing CVH and focus on metrics that will achieve the highest benefits.
Author contributions
Leilei Guo and Shangshu Zhang contributed equally to this work.
Conflicts of interest
The authors declare no potential conflicts of interest.
Supporting information
Figure S1. Relative risks of cardiovascular disease for most versus least category of ideal CVH metrics
Figure S2. Relative risks of stroke for most versus least category of ideal CVH metrics
Figure S3. Relative risks of all‐cause mortality (A) and CVD mortality (B) for the ideal versus poor health category of each cardiovascular health metric
Table S1. Stratified pooled relative risks and 95% confidence intervals for highest versus lowest category of ideal CVH metrics and all‐cause mortality
Table S2. Stratified pooled relative risks and 95% confidence intervals for highest versus lowest category of ideal CVH metrics and CVD mortality
Table S3. Publication bias of different meta‐analysis analytically at Begg's test and Egger's test among ideal CVH metrics
Guo L, Zhang S. Association between ideal cardiovascular health metrics and risk of cardiovascular events or mortality: A meta‐analysis of prospective studies. Clin Cardiol. 2017;40:1339–1346. 10.1002/clc.22836
REFERENCES
- 1. Mozaffarian D, Benjamin EJ, Go AS, et al. Heart Disease and Stroke Statistics—2016 Update: a report From the American Heart Association. Circulation. 2016;133:e38–e360. [DOI] [PubMed] [Google Scholar]
- 2. Lloyd‐Jones DM, Hong Y, Labarthe D, et al; American Heart Association Strategic Planning Task Force and Statistics Committee. Defining and setting national goals for cardiovascular health promotion and disease reduction: the American Heart Association's strategic Impact Goal through 2020 and beyond. Circulation. 2010;121:586–613. [DOI] [PubMed] [Google Scholar]
- 3. Artero EG, España‐Romero V, Lee DC, et al. Ideal cardiovascular health and mortality: Aerobics Center Longitudinal Study. Mayo Clin Proc. 2012;87:944–952. [DOI] [PMC free article] [PubMed] [Google Scholar]
- 4. Ford ES, Greenlund KJ, Hong Y. Ideal cardiovascular health and mortality from all causes and diseases of the circulatory system among adults in the United States. Circulation. 2012;125:987–995. [DOI] [PMC free article] [PubMed] [Google Scholar]
- 5. Kim JY, Ko YJ, Rhee CW, et al. Cardiovascular health metrics and all‐cause and cardiovascular disease mortality among middle‐aged men in Korea: the Seoul male cohort study. J Prev Med Public Health. 2013;46:319–328. [DOI] [PMC free article] [PubMed] [Google Scholar]
- 6. Liu Y, Chi HJ, Cui LF, et al. The ideal cardiovascular health metrics associated inversely with mortality from all causes and from cardiovascular diseases among adults in a Northern Chinese industrial city. PLoS One. 2014;9:e89161. [DOI] [PMC free article] [PubMed] [Google Scholar]
- 7. Folsom AR, Yatsuya H, Nettleton JA, et al; ARIC Study Investigators. Community prevalence of ideal cardiovascular health, by the American Heart Association definition, and relationship with cardiovascular disease incidence. J Am Coll Cardiol. 2011;57:1690–1696. [DOI] [PMC free article] [PubMed] [Google Scholar]
- 8. Kulshreshtha A, Vaccarino V, Judd SE, et al. Life's Simple 7 and risk of incident stroke: the reasons for geographic and racial differences in stroke study. Stroke. 2013;44:1909–1914. [DOI] [PMC free article] [PubMed] [Google Scholar]
- 9. Lachman S, Peters RJ, Lentjes MA, et al. Ideal cardiovascular health and risk of cardiovascular events in the EPIC‐Norfolk prospective population study. Eur J Prev Cardiol. 2016;23:986–994. [DOI] [PMC free article] [PubMed] [Google Scholar]
- 10. Miao C, Bao M, Xing A, et al. Cardiovascular health score and the risk of cardiovascular diseases. PLoS One. 2015;10:e0131537. [DOI] [PMC free article] [PubMed] [Google Scholar]
- 11. Ommerborn MJ, Blackshear CT, Hickson DA, et al. Ideal cardiovascular health and incident cardiovascular events: the Jackson Heart Study. Am J Prev Med. 2016;51:502–506. [DOI] [PMC free article] [PubMed] [Google Scholar]
- 12. Wu S, Huang Z, Yang X, et al. Prevalence of ideal cardiovascular health and its relationship with the 4‐year cardiovascular events in a northern Chinese industrial city. Circ Cardiovasc Qual Outcomes. 2012;5:487–493. [DOI] [PubMed] [Google Scholar]
- 13. Zhang Q, Zhou Y, Gao X, et al. Ideal cardiovascular health metrics and the risks of ischemic and intracerebral hemorrhagic stroke. Stroke. 2013;44:2451–2456. [DOI] [PubMed] [Google Scholar]
- 14. Fang N, Jiang M, Fan Y. Ideal cardiovascular health metrics and risk of cardiovascular disease or mortality: a meta‐analysis. Int J Cardiol. 2016;214:279–283. [DOI] [PubMed] [Google Scholar]
- 15. Dong C, Rundek T, Wright CB, et al. Ideal cardiovascular health predicts lower risks of myocardial infarction, stroke, and vascular death across whites, blacks, and Hispanics: the Northern Manhattan study. Circulation. 2012;125:2975–2984. [DOI] [PMC free article] [PubMed] [Google Scholar]
- 16. Yang Q, Cogswell ME, Flanders WD, et al. Trends in cardiovascular health metrics and associations with all‐cause and CVD mortality among US adults. JAMA. 2012;307:1273–1283. [DOI] [PMC free article] [PubMed] [Google Scholar]
- 17. Cook DA, Reed DA. Appraising the quality of medical education research methods: the Medical Education Research Study Quality Instrument and the Newcastle‐Ottawa Scale–Education. Acad Med. 2015;90:1067–1076. [DOI] [PubMed] [Google Scholar]
- 18. Higgins JP, Thompson SG. Quantifying heterogeneity in a meta‐analysis. Stat Med. 2002;21:1539–1558. [DOI] [PubMed] [Google Scholar]
- 19. Alman AC, Maahs DM, Rewers MJ, et al. Ideal cardiovascular health and the prevalence and progression of coronary artery calcification in adults with and without type 1 diabetes. Diabetes Care. 2014;37:521–528. [DOI] [PMC free article] [PubMed] [Google Scholar]
- 20. Yan N, Zhou Y, Wang Y, et al. Association of ideal cardiovascular health and brachial‐ankle pulse wave velocity: a cross‐sectional study in Northern China. J Stroke Cerebrovasc Dis. 2016;25:41–48. [DOI] [PubMed] [Google Scholar]
- 21. Nayor M, Enserro DM, Vasan RS, et al. Cardiovascular health status and incidence of heart failure in the Framingham Offspring Study. Circ Heart Fail. 2016;9:e002416. [DOI] [PMC free article] [PubMed] [Google Scholar]
- 22. Yang Y, Han X, Chen Y, et al. Association between modifiable lifestyle and the prevalence of atrial fibrillation in a Chinese population: Based on the cardiovascular health score. Clin Cardiol. 2017;40:1061–1067. [DOI] [PMC free article] [PubMed] [Google Scholar]
- 23. Zhao HY, Liu XX, Wang AX, et al. Ideal cardiovascular health and incident hypertension: the longitudinal community‐based Kailuan study. Medicine (Baltimore). 2016;95:e5415. [DOI] [PMC free article] [PubMed] [Google Scholar]
- 24. Inoue‐Choi M, Liao LM, Reyes‐Guzman C, et al. Association of long‐term, low‐intensity smoking with all‐cause and cause‐specific mortality in the National Institutes of Health–AARP Diet and Health Study. JAMA Intern Med. 2017;177:87–95. [DOI] [PMC free article] [PubMed] [Google Scholar]
- 25. Pan A, Wang Y, Talaei M, et al. Relation of smoking with total mortality and cardiovascular events among patients with diabetes mellitus: a meta‐analysis and systematic review. Circulation. 2015;132:1795–1804. [DOI] [PMC free article] [PubMed] [Google Scholar]
- 26. Brown JC, Harhay MO, Harhay MN. Physical activity, diet quality, and mortality among sarcopenic older adults. Aging Clin Exp Res. 2017;29:257–263. [DOI] [PMC free article] [PubMed] [Google Scholar]
- 27. Schwedhelm C, Boeing H, Hoffmann G, et al. Effect of diet on mortality and cancer recurrence among cancer survivors: a systematic review and meta‐analysis of cohort studies. Nutr Rev. 2016;74:737–748. [DOI] [PMC free article] [PubMed] [Google Scholar]
- 28. Havakuk O, Banai S, Halkin A, et al. HbA1c levels and long‐term mortality in patients undergoing coronary angiography. Cardiology. 2016;134:101–106. [DOI] [PubMed] [Google Scholar]
- 29. Li W, Katzmarzyk PT, Horswell R, et al. HbA1c and all‐cause mortality risk among patients with type 2 diabetes. Int J Cardiol. 2016;202:490–496. [DOI] [PMC free article] [PubMed] [Google Scholar]
- 30. Dai J, Krasnow RE, Liu L, et al. The association between postload plasma glucose levels and 38‐year mortality risk of coronary heart disease: the prospective NHLBI Twin Study. PLoS One. 2013;8:e69332. [DOI] [PMC free article] [PubMed] [Google Scholar]
- 31. Wei M, Gibbons LW, Mitchell TL, et al. Low fasting plasma glucose level as a predictor of cardiovascular disease and all‐cause mortality. Circulation. 2000;101:2047–2052. [DOI] [PubMed] [Google Scholar]
- 32. Koh AS, Talaei M, Pan A, et al. Systolic blood pressure and cardiovascular mortality in middle‐aged and elderly adults—the Singapore Chinese Health Study. Int J Cardiol. 2016;219:404–409. [DOI] [PMC free article] [PubMed] [Google Scholar]
- 33. Wormser D, Kaptoge S, Di Angelantonio E, et al; Emerging Risk Factors Collaboration. Separate and combined associations of body‐mass index and abdominal adiposity with cardiovascular disease: collaborative analysis of 58 prospective studies. Lancet. 2011;377:1085–1095. [DOI] [PMC free article] [PubMed] [Google Scholar]
- 34. Takata Y, Ansai T, Soh I, et al. Serum total cholesterol concentration and 10‐year mortality in an 85‐year‐old population. Clin Interv Aging. 2014;9:293–300. [DOI] [PMC free article] [PubMed] [Google Scholar]
- 35. Stamler J, Daviglus ML, Garside DB, et al. Relationship of baseline serum cholesterol levels in 3 large cohorts of younger men to long‐term coronary, cardiovascular, and all‐cause mortality and to longevity. JAMA. 2000;284:311–318. [DOI] [PubMed] [Google Scholar]
Associated Data
This section collects any data citations, data availability statements, or supplementary materials included in this article.
Supplementary Materials
Figure S1. Relative risks of cardiovascular disease for most versus least category of ideal CVH metrics
Figure S2. Relative risks of stroke for most versus least category of ideal CVH metrics
Figure S3. Relative risks of all‐cause mortality (A) and CVD mortality (B) for the ideal versus poor health category of each cardiovascular health metric
Table S1. Stratified pooled relative risks and 95% confidence intervals for highest versus lowest category of ideal CVH metrics and all‐cause mortality
Table S2. Stratified pooled relative risks and 95% confidence intervals for highest versus lowest category of ideal CVH metrics and CVD mortality
Table S3. Publication bias of different meta‐analysis analytically at Begg's test and Egger's test among ideal CVH metrics