

Abstract
Background
Chronic kidney disease is a worldwide public health concern due to the increased prevalence the high fatalities related to heart disease in this population. Among novel cardiovascular risk markers, the coronary artery calcification score (CAC) emerged as an independent predictor of cardiovascular events.
Hypothesis
We aimed to test if glomerular filtration rate or albuminuria are independently associated with coronary calcification.
Methods
The Brazilian Longitudinal Study of Adult Health is a cohort of men and women aged 35 to 74 years old addressing cardiovascular diseases. We analyzed the association of CAC, estimated glomerular filtration rate (eGFR), albumin‐to‐creatinine ratio (ACR) according to stages of eGFR (1 = ≥90; 2 = 60–89; 3 = <60 mL/min/1.73 m2), and ACR (<30; 30 to 300; >300 mg/g). These associations were estimated by logistic regression with a model including age, sex, race, income, and cardiovascular risk factors.
Results
Among 4189 persons (median age = 51 years, 54% women), 1183 had CAC. The odds ratio (OR) and the 95% confidence interval (95% CI) in the multivariate model was 0.86 (0.58‐1.29) for the category of eGFR <60 mL/min/1.73 m2 compared to people with eGFR >90 mL/min/1.73m2. On the other hand, the OR (95% CI) for individuals with ACR >300 mg/g was 4.31 (1.27‐14.64) compared to people with ACR <30 mg/g. A discrete interaction factor for the association with CAC between eGFR and ACR were analyzed as continuous variable.
Conclusions
Albuminuria was independently associated with coronary calcification, but the reduction of the glomerular filtration rate was not associated with CAC score in this sample of apparently healthy adults.
Keywords: Albuminuria, Glomerular Filtration Rate, Isquemic Coronary Disease, Subclinical Atherosclerosis, Vascular Calcification
1. INTRODUCTION
Chronic kidney disease (CKD) defined as a high albumin‐to‐creatinine ratio (ACR) or low estimated glomerular filtration rate (eGFR) affects 8% to 16% of people worldwide with increasing incidence, prevalence, and mortality rates in recent years.1, 2 It is well known that those with end‐stage renal disease are at higher risk of fatal and nonfatal cardiovascular death compared to the general population.3, 4, 5 The CKD Prognosis Consortium analyzed pooling data from several cohorts assembled according to characteristics of the participants from a general population and people with high risk for cardiovascular disease. For both situations, the results were relatively similar, showing that stages of low glomerular filtration rates less than 60 mL/min and albuminuria were risk factors for all‐cause and cardiovascular mortality, independently of each other and the concomitance of cardiovascular risk factors.6, 7
Coronary artery calcification (CAC) measured by computed tomography is a highly sensitive test to detect vascular calcification and a well‐validated marker of future cardiovascular events and all‐cause mortality.8, 9 The CAC score proved to be better than other subclinical markers for predicting coronary heart disease and heart failure, regardless of the presence or absence of CKD.9 The association between low glomerular filtration rate and/or albuminuria and coronary artery calcification has been clearly defined for individuals undergoing hemodialysis, though this is probably also true among those who present with mild or moderate renal impairment.9 Nevertheless, epidemiological studies with a large sample revealed contradictory results for this setting for people without end‐stage renal disease.9, 10, 11, 12, 13, 14, 15, 16, 17, 18, 19, 20
To better understand the importance of vascular calcification in moderate renal impairment, we sought to analyze the CAC score in an asymptomatic Brazilian population free of cardiovascular disease, and to assess whether there is an independent association of CAC with 2 markers of renal function in the early phase of CKD. The Brazilian Longitudinal Study of Adult Health (ELSA‐Brasil), a cohort of 15 105 people aged 35 to 74 years old, provided a unique opportunity to verify the association of high ACR and low eGFR with CAC in a racially mixed population.21, 22, 23, 24, 25
2. METHODS
The design and the concepts of ELSA‐Brasil have been detailed elsewhere.21, 22, 23, 24 Briefly, 15 105 civil servants aged 35 to 74 years from 6 cities in Brazil (Belo Horizonte, Porto Alegre, Rio de Janeiro, Salvador, São Paulo, and Vitoria), were enrolled between August 2008 and December 2010 for baseline examination.21 CAC score was performed only in the São Paulo site. All internal review boards of the 6 sites approved the ELSA‐Brasil protocol, and all enrollees granted informed consent. For our study, from the 5061 participants at the São Paulo site, we did not include 606 subjects who did not undergo CAC examination and/or did not have data about albuminuria, and 266 persons who reported previous medical diagnosis such as previous acute coronary syndrome, coronary artery bypass graft surgery, percutaneous angioplasty, stroke, and cardiomyopathy, with a final sample of 4189 subjects.
2.1. Data collection
Trained personnel under strict quality control carried out interviews and examinations.22, 23 Race was self‐defined as black, mixed, white, Asian, or native. Annual household income was converted to US dollars from Brazilian reals at the time of the initial interview. The participants were categorized according to smoking status as never, former, or current smokers. Information about the prior cardiovascular disease was self‐reported. Blood pressure (BP) measurements were taken using the validated Omron HEM 705CPINT oscillometric device (Omron Healthcare, Inc., Lake Forest, IL). Three measurements were taken at 1‐minute intervals, and the mean of the second and third measurements defined the final blood pressure of the participant.22 Diabetes was defined as a previous medical history of diabetes, use of medication to treat diabetes, fasting plasma glucose ≥126 mg/dL, 2‐hour plasma glucose ≥200 mg/dL, or glycated hemoglobin (HbA1C) ≥6.5%. All prescription and over‐the‐counter pill bottles were examined to confirm that drugs were taken during the 15‐day period preceding the interview. Blood samples were collected after a 12‐hour overnight fast,23 and the following laboratory data were analyzed: plasma glucose (fasting and after a 2‐hour glucose load), HbA1C, and total cholesterol.
2.2. Assessment of kidney function
The baseline serum creatinine was measured in serum specimens by the kinetic Jaffé method (Advia 1200; Siemens, Munich, Germany) after applying a conversion factor derived from calibration samples traceable to isotope dilution mass spectrometry as recommended by the National Kidney Disease Education Program.26 ACR was calculated from the 12‐hour urine samples obtained from urine albumin and creatinine concentrations.
The definition and classification of eGFR and albuminuria follows Kidney Disease: Improving Global Outcomes staging nomenclature.27 The eGFR was calculated using the equations from the Chronic Kidney Disease Epidemiology consortium28 without correction for race, which has not added useful information for Brazilians.29 In our analysis, the eGFR was categorized into 3 levels: stage G1 = normal (eGFR ≥90 mL/min/1.73 m2), stage G2 = mildly decreased (eGFR between 60 and 89 mL/min/1.73 m2), and stage G3–G5 = moderately to severely decreased (eGFR <60 mL/min/1.73 m2). ACR was classified in 3 categories: normal = <30 mg/g, moderately increased = 30 to 300 mg/g, and severely increased = >300 mg /g.
2.3. Coronary artery calcification score
Computed tomography scans to assess CAC scores were performed using a 64‐detector Philips Brilliance scanner (Philips Healthcare, Andover, MA) using standard protocols adjusted for the research subject biotype.
Participants were submitted to a prospective electrocardiogram (ECG) test, with a potential of 120‐kV tube and current in milliamps adjusted for the biotype of the research subject, which can vary from 100 to 150 mA. The reconstruction of the images occurred through axial cuts of the heart with a thickness of 2.5 mm, standard cardiac filter, tube rotation speed of 0.8 seconds, field of vision adjusted for the cardiac area, in the percentile 75 of the cardiac cycle (diastole), and ECG triggered within 100 ms during the inspiratory pause. The evaluation was performed by a blinded cardiologist using semiautomatic software (calcium scoring, Philips workstation; Philips Healthcare). A limitation of the CAC exam is that it does not differentiate the calcification in the intima and middle arterial layer, and the examination detects the only phase of atherosclerosis with calcification.
The CAC was calculated by the Agatston method, multiplying the calcification area in square millimeters per coefficient classified according to the density: 1 (130–199 HU), 2 (200–299 HU), 3 (300–399 HU) or 4 (>399 HU).25
2.4. Statistical Analysis
We compared the sociodemographic and clinical characteristics of the participants according to eGFR categories and separately for the ACR categories. Continuous normally distributed variables are presented as mean and standard deviation, and the difference in mean between the groups of eGFR was calculated by univariate analysis of variance with Bonferroni‘s post hoc test corrected for multiple comparisons. For the non‐normally distributed variables, median and interquartile range were calculated, and the values were compared between groups using the Kruskal‐Wallis test. Categorical variables were compared between groups using the χ2 test, and the comparisons of proportions between groups were performed in pairs and the P value adjusted by the Bonferroni method. In the second step, we analyzed the frequency of CAC altered between the renal function groups using the χ2 test.
First, we analyzed separately for categories of renal glomerular function and ACR. A crude model was applied, followed by a multivariate model adjusted for age, sex, race, body mass index, annual family income, smoking, systolic blood pressure, antihypertensive use, diabetes, low‐density lipoprotein cholesterol, and use of lipid‐lowering agents. In model 2, we added an adjustment for eGFR or albuminuria, except for itself. Second, we ran the same multivariate model but including eGFR and ACR as continuous variables, identifying a possible interaction term for both variables.
ELSA‐Brasil comprised a cohort of apparently healthy people, but many participants had high eGFR and lowered ACR. We tested an alternative, finer categorization for eGFR (≥105, 90–104, 75–89, and 60–74) and for ACR (<10, 10–29, 30–29, 30–300, and >300) relation with CAC ≥0, but the results did not change materially.
The magnitude of the associations was estimated by the odds ratio (OR), and the 95% confidence interval (95% CI) was calculated for each OR. The significance level was set at 0.05. All statistical analyses were performed using SPSS version 20 (IBM, Armonk, NY).
3. RESULTS
The mean age of participants was 50.8 years, 54.1% were women, most participants were white, and one‐quarter were obese (Table 1). The study population is predominantly composed of patients with normal or mildly reduced eGFR, as the clear majority of them were rated at stage G1 and stage G2, and only 4.1% at stages G3 to G5. The reduction in the eGFR was more frequent among older, male, poorer, and obese participants, and those with a higher frequency of cardiovascular risk factors and the presence of albuminuria. Table 2 shows that 95.6% of participants had nonaltered ACRs. People with the higher values of albuminuria were older, more obese, and with a higher frequency of cardiovascular risk factors and lower eGFR rates.
Table 1.
Clinical and demographic characteristics stratified according to glomerular filtration rate
| eGFR ≥90 | eGFR 60–89 | eGFR <60 | Overall | P Value | |
|---|---|---|---|---|---|
| No. (%) | 1683 (40.2%) | 2333 (55.7%) | 173 (4.1%) | 4189 (100%) | |
| Age, yr | 47.0 ± 7.1 | 52.8 ± 8.6a | 60.6 ± 9.1 a,b | 50.8 ± 8.8 | <0.001 |
| Male | 695 (41.3)c | 1138 (48.8)d | 90 (52.0) d | 1923(45.9) | <0.001 |
| Race | 0.15 | ||||
| White | 965 (58.0) | 1368 (59.5) | 104 (60.8) | 2437 (58.9) | |
| mixed | 387 (23.2) | 487 (21.1) | 30 (17.5) | 904 (21.9) | |
| Black | 221 (12.7) | 334 (14.5) | 28 (16.4) | 574 (13.9) | |
| Other | 101 (6.1) | 112 (4.9) | 9 (5.3) | 222 (5.3) | |
| Annual household income | <0.001 | ||||
| ≤$20.000 | 641 (38.2)c | 1058 (45.6)d | 101 (58.4)e | 1800 (43.2) | |
| Smoking | <0.001 | ||||
| Never | 926 (55.0) | 1230 (52.7) | 91 (52.6) | 2247 (53.6) | |
| Former | 450 (26.7)c | 761 (32.6)d | 62 (36.8)d | 1273 (30.4) | |
| Current | 307 (18.3)c | 342 (14.7 d | 20 (11.6)d | 669 (16.0) | |
| Current alcohol use (%) | 1130 (67.1) | 1622 (69.5) | 113 (65.3) | 2865 (68.4) | 0.47 |
| Body mass index ≥30 kg/m2 | 352 (20.9)c | 606 (26.0)d | 57 (32.9)d | 1015 (24.2) | <0.001 |
| Systolic blood pressure, mm Hg | 116.5 ± 15.2 | 120.6 ± 16.3a | 127.8 ± 16.1a,b | 119.2 ± 16.1) | <0.001 |
| Use of antihypertensive (%) | 241 (14.3)c | 603 (25.8)d | 91 (52.6)e | 935 (22.3) | <0.001 |
| Diabetes (%) | 254 (15.1) | 501 (21.5)a | 63 (36.4)a,b | 818 (19.5) | <0.001 |
| LDL cholesterol, mg/dL | 127.9 ± 33.2 | 132.6 ± 34.7a | 132.9 ± 35.0) | 130.7 ± 34.2 | <0.001 |
| Use of lipid‐lowering agents | 121 (7.2) | 324 (13.9)a | 43 (24.9)a,b | 488 (11.6) | <0.001 |
| CAC >0 (%) | 333 (19.8)c | 760 (32) d | 90 (52)e | 1183 (28.2) | <0.001 |
| CAC median (IQR) | 0 (0–0) | 0 (0–9.7) | 3 (0–91) | 0 (0–4) | <0.001 |
Abbreviations: CAC, coronary artery calcification; eGFR, estimated glomerular filtration rate; HbA1c, glycated hemoglobin; IQR, interquartile range; LDL, low‐density lipoprotein; SD, standard deviation.
Categorical variables are shown as number (percentage) and continuous variables as mean ± SD.
Statistically significant after Bonferroni's correction for multiple comparisons P < 0.05 vs group of eGFR >90 mL/min/1.73 m2;
P < 0.05 vs. group of eGFR 60‐89 mL/min/1.73 m2.
P value was adjusted by Bonferroni test for categorical variables and represents a subset of eGFR categories whose column proportions do not differ significantly from each other at the 0.05 level.
Table 2.
Clinical and demographic characteristics stratified by levels of ACR in milligrams per gram
| Characteristics | ACR <30 | ACR 30–300 | ACR >300 | Overall | P Value |
|---|---|---|---|---|---|
| No. (%) | 4004 (95.6) | 168 (4.0) | 17 (0.4) | 4189 (100) | |
| Age, yr | 50.6 ± 8.7 | 53.9 ± 9.9 a | 52.0 ± 9.6 | 50.7 ± 8.7 | <0.001 |
| Male | 1823 (45.5) | 90 (53.6) | 10 (58.8) | 1923 (45.9) | 0.69 |
| Race/skin color, n = 4137 | 0.15 | ||||
| White | 2344 (59.2) | 85 (52.1) | 8 (47.1) | 2437 (58.9) | |
| Brown | 858 (21.7) | 41 (25.2) | 5 (29.4) | 904 (21.9) | |
| Black | 539 (13.6) | 31 (19.0) | 4 (23.5) | 574 (13.9) | |
| Other | 216 (5.5) | 6 (3.7) | 0 (0,0) | 222 (5.3) | |
| Annual household income | 0.016 | ||||
| ≤$20.000 | 1739 (43.6) b | 56 (33.3) c | 5 (29.4) b,c | 1800 (43.2) | |
| Smoking | 0.99 | ||||
| Never | 2151 (53.7) | 87 (51.8) | 9 (52.9) | 2247 (53.6) | |
| Former | 1215 (30.4) | 53 (31.5) | 5 (29.5) | 1273 (30.4) | |
| Current | 638 (15.9) | 28 (16.7) | 3 (17.6) | 669 (16.0) | |
| Current alcohol use (%) | 2746 (68.6) | 110 (65.5) | 9 (52.9) | 2865 (68.4) | 0.41 |
| Body‐mass Index ≥30 kg/m2 | 942 (23.5)b | 65 (38.7)c | 8 (47.1)b,c | 1015 (24.2) | <0.001 |
| Systolic blood pressure, mm Hg | 118.7 ± 15.7 | 129.8 ± 20.0a | 135.2 ± 21.8a | 119.2 ± 16.1 | <0.001 |
| Use of antihypertensive (%) | 853 (21.3)b | 71 (42.3)c | 11 (64.7)c | 935 (22.3) | <0.001 |
| Diabetes (%) | 736 (18.4)b | 73 (43.5)c | 9 (52.9)c | 818 (19.5) | <0.001 |
| Use of lipid‐lowering agents | 454 (11.3)b | 31 (18.5)c | 3 (17.6)b,c | 488 (11.6) | 0.01 |
| LDL cholesterol, mg/dL | 130.9 ± 33.9 | 124.2 ± 36.8a | 146.5 ± 64.5d | 130.7 ± 34.2 | 0.008 |
| eGFR | 85.9 ± 14.7 | 81.0 ± 18.5 a | 65.6 ± 34.6a,d | 85.7 ± 15.0 | <0.001 |
| CAC >0 (%) | 1105 (27.6)b | 67 (39.9)c | 11 (64.7)c | 1183 (28.2) | <0.001 |
| CAC median (IQR) | 0 (0–3) | 0 (0–64) | 11.4 (0–199) | 0 (0–4) | <0.001 |
Abbreviations: ACR, albumin‐to‐creatinine ratio; CAC, coronary artery calcification; eGFR, estimated glomerular filtration rate; IQR, interquartile range; LDL, low‐density lipoprotein; SD, standard deviation.
Categorical variables are shown as number (percentage) and continuous variables as mean ± SD.
Statistically significant after Bonferroni's correction for multiple comparisons P < 0.05 vs. group of eGFR >90 mL/min/1.73 m2.
P < 0.05 vs. group of eGFR 60–89 mL/min/1.73 m2.
P value adjusted by Bonferroni test for categorical variables representing a subset of ACR categories whose column proportions do not differ significantly from each other at the 0.05 level.
We found an inverse association between eGFR and CAC (Figure 1) (see Supporting Table 1 in the online version of this article). The CAC score > 0 was 1.5 and 2.5 times more frequent in stage G2 and about 2.5 times higher in stage G3 to G5 compared to stage G1. We observed a significant increase in the frequency even in the group with eGFR between 60 and 89 mL/min/1.73m2, where there is no rise in serum creatinine. The proportion of people with CAC >400 was 6 times higher among subjects with eGFR <60 compared to those who presented a normal eGFR value. Similarly, the presence of albuminuria was associated with high CAC scores. The frequency of subjects with CAC >0 was 2.3 times greater in those who had an ACR greater than 300 mg/g compared to people with no albuminuria (Figure 2).
Figure 1.
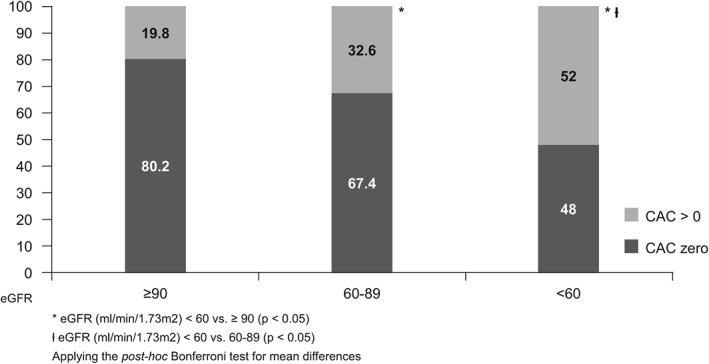
Frequency of coronary artery calcification (CAC) >0 according to estimated glomerular filtration rate (eGFR) among 4189 participants of the Brazilian Longitudinal Study of Adult Health examined during the baseline (2008–2010)
Figure 2.
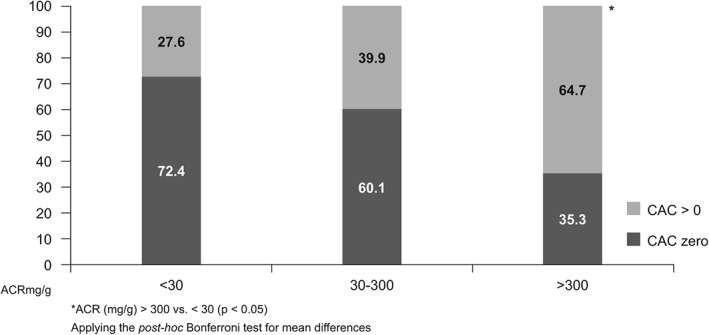
Frequency of coronary artery calcification (CAC) >0 according to albumin‐to‐creatinine ratio (ACR) among 4189 participants of the Brazilian Longitudinal Study of Adult Health examined during the baseline (2008–2010)
Table 3 presents the odds ratio of the logistic regression analysis for CAC >0 according to the categories of glomerular renal function and albumin‐to‐creatinine. In the unadjusted model, we found an OR of 1.96 for eGRF (95% CI: 60‐89 mL/min) and an OR of 4.40 for eGFR lower than 60 mL/min when compared with people with eGFR greater than 90 mL/min. However, for the multivariate adjustment, no significant association between CAC and eGFR was discovered. Adding, albumin‐to‐creatinine to this model did not change the results.
Table 3.
Odds ratios and 95% confidence intervals for the association between estimated eGFR and ACR and coronary artery calcium score ≥ 0
| Crude | Multivariate Model | ||
|---|---|---|---|
| Model 1, OR (95% CI) | Model 2, OR (95% CI) | ||
| eGFR, mL/min/1.73m2 | |||
| ≥90, n = 1683 | Reference | Reference | Reference |
| 60‐89, n = 2333 | 1.96 (1.69‐2.27) | 0.96 (0.81‐1.15) | 0.96 (0.81‐1.15) |
| <60, n = 173 | 4.40 (3.19‐6.06) | 0.86 (0.58‐1.29) | 0.82 (0.55‐1.23) |
| ACR, mg/g | |||
| <30, n = 4004 | Reference | Reference | Reference |
| 30‐300, n = 168 | 1.74 (1.27‐2.39) | 1.01 (0.68‐1.51) | 1.01 (0.68‐1.52) |
| >300, n = 17 | 4.81 (1.77‐13.04) | 4.12 (1.22‐13.99) | 4.12 (1.29‐14.67) |
Abbreviations: ACR, albumin‐to‐creatinine ratio; CI, confidence interval; eGFR, estimated glomerular filtration rate; OR, odds ratio.
Values shown are odds ratio (95% confidence interval).
Model 1: adjusted for age, gender, race, annual household income, body mass index ≥30 kg/m2, smoking, systolic blood pressure, treatment with antihypertensive, low density lipoprotein cholesterol, use of lipid‐lowering agents, and presence of diabetes. Model 2: model 1 plus adjusted for eGFR or ACR, except for itself.
Participants with ACR >300 mg/g presented a greater chance of calcification in both the crude model and the multivariate adjusted model, achieving an OR of 4 compared to participants without albuminuria. Adding eGFR to this model did not change the results.
We tested eGFR and ACR as continuous variables despite a high proportion of 0 values for the ACR variable. We were able to identify a slightly positive association for the eGFR (P = 0.046) and a negative association for ACR (P < 0.001). We found a significant interaction term of ACR with eGFR (P < 0.014).
4. DISCUSSION
Our study evaluated the association of CAC with eGFR and albuminuria in a large and apparently healthy Brazilian population. The association between CAC and reduced eGFR was not observed after adjustment for age, sex, race, and cardiovascular risk factors. When analyzed as a continuous variable, eGFR showed a slight positive association with CAC score. In contrast, albuminuria was associated with coronary calcification as a categorical or continuous variable. For both situations, a reduced eGFR and a high ACR were observed as high burdens of cardiovascular risk compared to people without renal alterations.
Considering a public health perspective of reduction of the case fatality of people with CKD, the relationship between renal dysfunction should prioritize people in early stages of renal disease, because during the late stage of the disease, the disturbed calcium and phosphate metabolism become the primary determinant of coronary calcification.13 Moreover, autopsy studies revealed that the calcification pattern for people who died due to renal disease is different according to the level of kidney failure. Patients with eGFR below 30 mL/min/1.73 m2 presented a higher quantity of intimal calcification and greater frequency of medial calcification compared with subjects with an eGFR >60 mL/min/1.73 m2. Unfortunately, the computed tomography resolution does not permit identification of the area of vascular calcification.30
In the cross‐sectional studies that addressed the CAC association among people with mild/moderate CKD as we did, the results were contradictory. The Dallas Heart Study evaluated 2660 participants aged 30 to 65 years, with a mean age of 43 years, of whom 5.9% had CKD, and found a strong association between CAC >400 and stage 3 to 5 CKD in patients with diabetes.11 The Chronic Renal Insufficiency Cohort (CRIC) studied 1908 participants, with a median age of 60 years and eGFR <60 mL/min, and reported a graded association between lower eGFR and increasing CAC that remained significant after adjustment for cardiovascular risk factors.11 Furthermore, CRIC was able to identify mineral metabolic dysregulation and insulin resistance as a mediator of the associated lower eGFR and CAC.12
Contrary to those results, other studies agree with our data showing no association between low glomerular filtration and coronary calcification. In the Rotterdam Study of 1703 participants with a mean eGFR of 75 mL/min/1.73 m2, the association occurred only among participants over 70 years old categorized in 2 age groups, older and younger than 70 years.14 In the Framingham Heart Study Offspring, of the 1174 participants (mean age 59 years), 6.3% had CKD and 8.3% had albuminuria. Neither low eGFR nor albuminuria were associated with CAC after the adjustment for cardiovascular risk factors.15 During the baseline of the Multi‐Ethnic Study of Atherosclerosis (MESA), of the 6749 participants with eGFR around 80 mL/min/1.73 m2, there was no association between low eGFR in a multivariate adjustment model.9, 16, 17 However, the baseline MESA study was able to verify only a positive relationship between microalbuminuria and high CAC score,17 and after a mean follow‐up of 2.4 ± 0.8 years, those with microalbuminuria and no CAC at baseline were more than twice as likely to develop CAC after multivariate adjustment.18 In South Korea, 2 worksite health screening programs evaluated the association of renal function and coronary calcification.19, 20 In the Seoul National University Bundang Hospital, 4297 people aged 35 to 74 years old were evaluated, and only albuminuria and not low eGFR was associated with a high CAC score.19 In the Kangbuk Samsung Hospital study, 23 617 patients, with a mean age of 40 years, had significant CAC scores that increased through CKD stages, and remained significant after adjustment for traditional cardiovascular factors but not after adjusting for age.20
Albuminuria is a well‐established risk factor for cardiovascular morbidity and renal disease.31, 32 Meta‐analysis studies have shown that there is a linear relationship between albuminuria and cardiovascular events regardless of cardiovascular risk factors.6,7 However, the pathophysiological mechanism that binds albuminuria and cardiovascular disease has not yet been fully elucidated. Studies point to possible endothelial dysfunction caused by degradation of the glycocalyx gel that lines the endothelium surface,33 leading to the breaking of the barrier. As a consequence, it allows the passage of inflammatory cells and deposits of lipoproteins, triggering systemic vascular inflammation and increased formation of atherosclerotic plaque.33
Another point is related to vitamin D metabolism. Because the ELSA‐Brasil is composed of a racially mixed population, there is a possibility that racial differences in bone structure and regulation of bone mineral metabolism determine the association eGFR and CAC.34, 35 Blacks have lower urinary calcium excretion and higher intestinal calcium absorption.34, 36 Also, there is another factor to be considered in that the ELSA‐Brasil subjects live around the Tropic of Capricorn, with a higher lifetime sunlight exposure than observed in the other studies analyzed.
Our study has limitations that are similar to most of the other studies. First is the cross‐sectional design. Second, only creatinine and albuminuria were considered for the definition of the renal function. Third, an estimated formula was used to evaluate renal function and not a direct measure of GFR. Fourth, we used a CAC score that only detects atherosclerosis plaque with the presence of calcium; therefore, the burden of subclinical atherosclerosis was not completely screened. One of the strengths of our study was that we evaluated CAC with the same computed tomography equipment and used a systematic protocol following international recommendations. We excluded from our analysis patients who had a history of cardiovascular disease and/or heart surgery to avoid selection bias. The renal classification was performed according to KDIGO 2012 guidelines, which are suitable for the general population. Lastly, the strongest point of our study was comparison of the relationship of calcification to high ACR and low eGFR.
5. CONCLUSION
The present study found no association between the reduction of eGFR and CAC; the higher frequency of CAC >0 found in these participants was due to the greater association with cardiovascular risk factors and age. We showed that the risk of coronary calcification increases with greater intensity due to albuminuria, and the presence of albuminuria may reflect the high CAC score in an asymptomatic individual.
Supporting information
Supplementary Table 1: Association between estimated Glomerular Filtration Rate (Egfr) and Coronary Artery Calcification (CAC) in 04 categories
Supplementary Table 2: Associations between Albumin‐to‐Creatinine ratio (ACR(and Coronary Artery Calcium (CAC) in 04 categories
ACKNOWLEDGMENTS
The authors thank the ELSA‐Brasil participants who agreed to collaborate in this study. The authors also thank the research team of the ELSA‐Brasil study for their contributions.
Conflicts of interest
Dr. Lotufo received honoraria from AbbVie Brazil and Amgen Brazil for lectures.
Suh‐Chiou C, Moysés RM, Bittencourt MS, Bensenor IM, Lotufo PA. Chronic kidney disease and coronary artery calcification in the Brazilian Longitudinal Study of Adult Health (ELSA‐Brasil). Clin Cardiol. 2017;40:1309–1315. 10.1002/clc.22829
Funding information The ELSA‐Brasil baseline study was supported by the Brazilian Ministry of Health (Science and Technology Department) and the Brazilian Ministry of Science and Technology (Financiadora de Estudos e Projetos and CNPq National Research Council) (grants 01 06 0010.00 RS, 01 06 0212.00 BA, 01 06 0300.00 ES, 01 06 0278.00 MG, 01 06 0115.00 SP, 01 06 0071.00 RJ).
REFERENCES
- 1. Jha V, Garcia‐Garcia G, Iseki K, Li Z, Naicker S, Plattner B, et al. Chronic kidney disease: global dimension and perspectives. Lancet. 2013;382:260–272. [DOI] [PubMed] [Google Scholar]
- 2. Thomas B, Matsushita K, Abate KH, et al; Global Burden of Disease 2013 GFR Collaborators; CKD Prognosis Consortium; Global Burden of Disease Genitourinary Expert Group. Global cardiovascular and renal outcomes of reduced GFR. J Am Soc Nephrol. 2017;28:2167–2179. [DOI] [PMC free article] [PubMed] [Google Scholar]
- 3. Wen CP, Cheng TY, Tsai MK, et al. All‐cause mortality attributable to chronic kidney disease: a prospective cohort study based on 462 293 adults in Taiwan. Lancet. 2008;371:2173–2182. [DOI] [PubMed] [Google Scholar]
- 4. Roberts MA, Polkinghorne KR, McDonald SP, Ierino FL. Secular trends in cardiovascular mortality rates of patients receiving dialysis compared with the general population. Am J Kidney Dis. 2011;58:64–72. [DOI] [PubMed] [Google Scholar]
- 5. Flores‐Blanco PJ, López‐Cuenca Á, Januzzi JL, et al. Comparison of risk prediction with the CKD‐EPI and MDRD equations in non‐ST‐segment elevation acute coronary syndrome. Clin Cardiol. 2016;39:507–515. [DOI] [PMC free article] [PubMed] [Google Scholar]
- 6. Matsushita K, van der Velde M, Astor BC, et al. Association of estimated glomerular filtration rate and albuminuria with all‐cause and cardiovascular mortality in general population cohorts: a collaborative meta‐analysis. Lancet. 2010;375:2073–2081. [DOI] [PMC free article] [PubMed] [Google Scholar]
- 7. van der Velde M, Matsushita K, Coresh J, et al. Lower estimated glomerular filtration rate and higher albuminuria are associated with all‐cause and cardiovascular mortality. A collaborative meta‐analysis of high‐risk population cohorts. Kidney Int. 2011;79:1341–1352. [DOI] [PubMed] [Google Scholar]
- 8. Greenland P, Bonow RO, Brundage BH, et al. ACCF/AHA 2007 clinical expert consensus document on coronary artery calcium scoring by computed tomography in global cardiovascular risk assessment and in evaluation of patients with chest pain: a report of the American College of Cardiology Foundation Clinical Expert Consensus Task Force (ACCF/AHA Writing Committee to Update the 2000 Expert Consensus Document on Electron Beam Computed Tomography). Circulation. 2007;115:402–426. [DOI] [PubMed] [Google Scholar]
- 9. Matsushita K, Sang Y, Ballew SH, et al. Subclinical atherosclerosis measures for cardiovascular prediction in CKD. J Am Soc Nephrol. 2015;26:439–447. [DOI] [PMC free article] [PubMed] [Google Scholar]
- 10. Bashir A, Moody WE, Edwards NC, Ferro CJ, Townend JN, Steeds RP. Coronary artery calcium assessment in CKD: utility in cardiovascular disease risk assessment and treatment? Am J Kidney Dis. 2015;65:937–948. [DOI] [PubMed] [Google Scholar]
- 11. Kramer H, Toto R, Peshock R, Cooper R, Victor R. Association between chronic kidney disease and coronary artery calcification: the Dallas Heart Study. J Am Soc Nephrol. 2005;16:507‐513. [DOI] [PubMed] [Google Scholar]
- 12. Budoff MJ, Rader DJ, Reilly MP, et al. Relationship of estimated GFR and coronary artery calcification in the CRIC (Chronic Renal Insufficiency Cohort) Study. Am J Kidney Dis. 2011;58:519–526. [DOI] [PMC free article] [PubMed] [Google Scholar]
- 13. He J, Reilly M, Yang W, et al. Risk factors for coronary artery calcium among patients with chronic kidney disease (from the Chronic Renal Insufficiency Cohort Study). Am J Cardiol. 2012;110:1735–1741. [DOI] [PMC free article] [PubMed] [Google Scholar]
- 14. El Barzouhi A, Elias‐Smale S, Dehghan A, et al. Renal function is related to severity of coronary artery calcification in elderly persons: the Rotterdam study. PLoS One. 2011;6:e16738. [DOI] [PMC free article] [PubMed] [Google Scholar]
- 15. Parikh NI, Hwang SJ, Larson MG, et al. Indexes of kidney function and coronary artery and abdominal aortic calcium (from the Framingham Offspring Study). Am J Cardiol. 2008;102:440–443. [DOI] [PMC free article] [PubMed] [Google Scholar]
- 16. Ix JH, Katz R, Kestenbaum B, et al. Association of mild to moderate kidney dysfunction and coronary calcification. J Am Soc Nephrol. 2008;19:579–585. [DOI] [PMC free article] [PubMed] [Google Scholar]
- 17. Kramer H, Jacobs DR Jr, Bild D, et al. Urine albumin excretion and subclinical cardiovascular disease. The Multi‐Ethnic Study of Atherosclerosis. Hypertension. 2005;46:38–43. [DOI] [PubMed] [Google Scholar]
- 18. DeFilippis AP, Kramer HJ, Katz R, et al. Association between coronary artery calcification progression and microalbuminuria: the MESA study. JACC Cardiovasc Imaging. 2010;3:595–604. [DOI] [PMC free article] [PubMed] [Google Scholar]
- 19. Cho I, Min HS, Chun EJ, et al. Coronary atherosclerosis detected by coronary CT angiography in asymptomatic subjects with early chronic kidney disease. Atherosclerosis. 2010;208:406–411. [DOI] [PubMed] [Google Scholar]
- 20. Chae HB, Lee SY, Kim NH, et al. Age is the strongest effector for the relationship between estimated glomerular filtration rate and coronary artery calcification in apparently healthy Korean adults. Endocrinol Metab (Seoul). 2014;29:312–319. [DOI] [PMC free article] [PubMed] [Google Scholar]
- 21. Lotufo PA. Setting up the longitudinal study for adult health (ELSA‐Brasil) [in Portuguese]. Rev Saude Publica. 2013;47(suppl 2):3–9. [DOI] [PubMed] [Google Scholar]
- 22. Bensenor IM, Griep RH, Pinto KA, et al. Routines of organization of clinical tests and interviews in the ELSA‐Brasil investigation center [in Portuguese]. Rev Saude Publica. 2013;47(suppl 2):37‐47. [DOI] [PubMed] [Google Scholar]
- 23. Fedeli LG, Vidigal PG, Leite CM, et al. Logistics of collection and transportation of biological samples and the organization of the central laboratory in the ELSA‐Brasil [in Portuguese]. Rev Saude Publica. 2013;47(suppl 2):63–71. [DOI] [PubMed] [Google Scholar]
- 24. Barreto SM, Ladeira RM, Duncan BB, et al. Chronic kidney disease among adult participants of the ELSA‐Brasil cohort: association with race and socioeconomic position. J Epidemiol Community Health. 2016;70:380–389. [DOI] [PubMed] [Google Scholar]
- 25. Pereira AC, Gomez LM, Bittencourt MS, et al. Age, gender, and race‐based coronary artery calcium score percentiles in the Brazilian Longitudinal Study of Adult Health (ELSA‐Brasil). Clin Cardiol. 2016;39:352–359. [DOI] [PMC free article] [PubMed] [Google Scholar]
- 26. Coresh J, Astor BC, McQuillan G, et al. Calibration and random variation of the serum creatinine assay as critical elements of using equations to estimate glomerular filtration rate. Am J Kidney Dis. 2002;39:920–929. [DOI] [PubMed] [Google Scholar]
- 27. KDIGO 2012 Clinical Practice Guideline for the Evaluation and Management of Chronic Kidney Disease. Kidney Int Suppl. 2013;3:1–150. [DOI] [PubMed] [Google Scholar]
- 28. Levey AS, Stevens LA, Schmid CH, et al. A new equation to estimate glomerular filtration rate. Ann Intern Med. 2009;150:604–612. [DOI] [PMC free article] [PubMed] [Google Scholar]
- 29. Lotufo PA. Renal disease screening: a potential tool for reducing health inequity. Sao Paulo Med J. 2016;134:1–2. [DOI] [PMC free article] [PubMed] [Google Scholar]
- 30. Nakamura S, Ishibashi‐Ueda H, Niizuma S, Yoshihara F, Horio T, Kawano Y. Coronary calcification in patients with chronic kidney disease and coronary artery disease. Clin J Am Soc Nephrol. 2009;4:1892–1900. [DOI] [PMC free article] [PubMed] [Google Scholar]
- 31. Arnlov J, Evans JC, Meigs JB, et al. Low‐grade albuminuria and incidence of cardiovascular disease events in nonhypertensive and nondiabetic individuals: the Framingham Heart Study. Circulation. 2005;112:969–975. [DOI] [PubMed] [Google Scholar]
- 32. Gansevoort RT, Matsushita K, van der Velde M, et al. Lower estimated GFR and higher albuminuria are associated with adverse kidney outcomes. A collaborative meta‐analysis of general and high‐risk population cohorts. Kidney Int. 2011;80:93–104. [DOI] [PMC free article] [PubMed] [Google Scholar]
- 33. Garsen M, Rops AL, Rabelink TJ, Berden JH, van der Vlag J. The role of heparanase and the endothelial glycocalyx in the development of proteinuria. Nephrol Dial Transplant. 2014;29:49–55. [DOI] [PubMed] [Google Scholar]
- 34. Bachrach LK, Hastie T, Wang MC, Narasimhan B, Marcus R. Bone mineral acquisition in healthy Asian, Hispanic, black, and Caucasian youth: a longitudinal study. J Clin Endocrinol Metab. 1999;84:4702–4712. [DOI] [PubMed] [Google Scholar]
- 35. Bell NH, Greene A, Epstein S, Oexmann MJ, Shaw S, Shary J. Evidence for alteration of the vitamin D‐endocrine system in blacks. J Clin Invest. 1985;76:470–473. [DOI] [PMC free article] [PubMed] [Google Scholar]
- 36. van den Berg BM, Spaan JA, Rolf TM, Vink H. Atherogenic region and diet diminish glycocalyx dimension and increase intima‐to‐media ratios at murine carotid artery bifurcation. Am J Physiol Heart Circ Physiol. 2006;290:H915–H920. [DOI] [PubMed] [Google Scholar]
Associated Data
This section collects any data citations, data availability statements, or supplementary materials included in this article.
Supplementary Materials
Supplementary Table 1: Association between estimated Glomerular Filtration Rate (Egfr) and Coronary Artery Calcification (CAC) in 04 categories
Supplementary Table 2: Associations between Albumin‐to‐Creatinine ratio (ACR(and Coronary Artery Calcium (CAC) in 04 categories