



Abstract
Background
Both stress cardiomyopathy (SCMP) and acute myocardial infarction (AMI) present with similar clinical symptoms and signs, and apical akinesis.
Hypothesis: Quantitative segmental analysis of myocardial contrast echocardiography (MCE) helps to differentiate AMI from SCMP.
Methods
Real‐time MCE was performed in 33 consecutive patients who presented with an acute symptom/sign and a new apical akinesis on echocardiography. In 18 left ventricular (LV) myocardial segments, a replenishment curve was obtained in each segment to measure peak plateau myocardial contrast intensity (MCI) (A) and the replenishment curve slope (β). The calibrated MCI was also measured in each segment.
Results
Among 33 patients, 22 were diagnosed with SCMP and 11 were diagnosed with AMI according to comprehensive diagnostic criteria. A, β, Aβ, and the calibrated MCI were lower in akinetic than in normokinetic segments in both the SCMP and AMI groups. In the akinetic segments, A, β, Aβ, and the calibrated MCI in SCMP patients were each higher than those in AMI patients. In patient‐based analyses, areas under the ROC curves of A, β, Aβ, and the calibrated MCI for diagnosing AMI were 0.769, 0.607, 0.822, and 0.934, respectively. The optimal cutoff values to diagnose AMI were Aβ < 3.7 dB/sec (sensitivity 82%, specificity 82%) and a calibrated MCI < −23 dB (sensitivity 91%, specificity 95%).
Conclusions
Although myocardial perfusion is relatively reduced in the akinetic segments of SCMP, a quantitative segmental analysis of myocardial perfusion using MCE helps to discriminate AMI from SCMP.
Keywords: Myocardial Contrast Echocardiography, Myocardial Infarction, Stress Cardiomyopathy
1. INTRODUCTION
Both apical ballooning type stress cardiomyopathy (SCMP) and acute myocardial infarction (AMI) caused by left anterior descending artery occlusion present with similar symptoms, signs, and regional myocardial dysfunction that typically involve the left ventricular (LV) apex.1, 2, 3, 4 The differential diagnosis at the acute stage is critical because the treatment strategies are different for each of these 2 disease entities. Evaluations of myocardial perfusion in dysfunctional myocardium could be used for differential diagnoses, but SCMP cases that are not caused by a significant epicardial coronary artery stenosis also show reduced myocardial perfusion by various imaging modalities.5, 6, 7, 8, 9, 10 Because of the similarly reduced myocardial perfusion in both SCMP and AMI cases, myocardial perfusion studies cannot easily differentiate between these 2 disease categories. It has been reported that both AMI and SCMP show similar semiquantitative scores for perfusion defects on myocardial contrast echocardiography (MCE).6 However, we hypothesized that a quantitative assessment of myocardial perfusion, which can quantify the severity of a myocardial perfusion defect in the dysfunctional myocardium, might help to differentiate SCMP from AMI, because AMI causes more complete damage of microvasculature resulting from the complete obstruction of the coronary artery compared with SCMP.11 Perfusion parameters based on a replenishment curve analysis of real‐time MCE have been established to quantify both myocardial blood volume and flow.12, 13 Additionally, calibration techniques used in the analysis of MCE, which derives relative measurements by subtracting the LV cavity contrast intensity from the myocardial contrast intensity (MCI), have been shown to overcome intersegmental differences in the MCI caused by depth‐dependent attenuation of reflected sound waves.13, 14, 15 We aimed to evaluate the usefulness of these quantitative analyses of MCE in differentiating SCMP from AMI during the acute stage of disease.
2. METHODS
2.1. Study population
A total of 33 consecutive patients who showed a new apical akinesis on echocardiography accompanied by acute clinical symptoms or signs, including chest pain, dyspnea, or sudden deterioration of vital signs, were prospectively enrolled in this study between March 2010 and December 2013. The differential diagnosis between SCMP and AMI was made using Mayo Clinic criteria for the diagnosis of SCMP,4 along with the universal definition of myocardial infarction.16 Coronary artery evaluations made using coronary angiography or computed tomography (CT) were performed in 25 patients, whereas the remaining 8 patients could not undergo coronary workups because of a poor general condition or refusal to undergo coronary studies. In those patients who did not undergo coronary evaluations, a final diagnosis of SCMP was made by taking the clinical findings into account, including minimally elevated serum biomarkers of myocardial injury, regional wall motion abnormalities that extended beyond a single epicardial vascular distribution, and early improvement of the clinical status with a normalized wall motion abnormality on a follow‐up echocardiography.4, 17 Exclusion criteria included an old myocardial infarction, AMI after primary coronary intervention, hemodynamic instability, an undetermined diagnosis, and reverse ballooning or midventricular ballooning types of SCMP. This study was approved by the institutional review board of Asan Medical Center, and each patient provided informed written consent.
2.2. MCE study
Real‐time MCE was performed within 2 days (19 patients: same day; 11 patients: 1 day; 3 patients: 2 days) after symptom/sign onset or visiting the emergency room and prior to performing coronary workups or interventions. The IE33 (Philips Medical Systems, Andover, MA) with an S3 probe was used. The gain, compression control, and time gain compensation were optimized at the beginning of each study and remained unchanged throughout the study. The focus was set at two‐thirds of the depth of the image. Definity (Lantheus Medical Imaging, North Billerica, MA), a commercially available second‐generation ultrasound contrast agent, was used. Intravenous contrast (1.3 mL Definity diluted in 50 mL saline) was administered at a continuous infusion rate of 150–180 mL/h; the infusion rate was adjusted to maintain optimal myocardial enhancement. The dynamic range was set to a maximum value (50 dB). The mechanical index was set to 1.1 for flash images and 0.1 for real‐time images. A flash of ultrasound with a high mechanical index was administered to destroy microbubbles in the sector, and then the replenishment of the microbubbles was observed. Regional wall motion abnormalities were scored according to recommendations of the American Society of Echocardiography.18
2.3. Quantification of myocardial perfusion using MCE
Using dedicated QLAB software (Philips Medical Systems), myocardial perfusions were quantified in 18 myocardial segments that consisted of 6 segments in apical 4‐, 2‐, and 3‐chamber views. The spline‐shaped region of interest (ROI) was placed, and its shape was adjusted manually to fit within each myocardial segment. Care was taken not to include structures other than the myocardium, such as the LV cavity and pericardium. Measurements of the mean contrast intensity of each ROI were performed using the automatic motion compensation mode to overcome artifacts that can arise from periodic heart motions. After reviewing the motion compensation when necessary, the ROI position was meticulously adjusted by each frame. The mean video intensity of each ROI was automatically calculated and plotted against time and subsequently fitted by software to the following exponential function: y = A × (1 – e–ßt), in which A is the peak plateau contrast intensity that reflects the microvascular cross‐sectional area or myocardial blood volume, and ß represents the rate of rise in signal intensity from baseline to plateau that reflects the microbubble or myocardial blood velocity.11, 12 The product of A and ß (Aß) represents the myocardial blood flow.
2.4. Calibration technique
The contrast signal intensity decreases in proportion to the depth of solution because of ultrasound attenuation caused by the presence of microbubbles.13, 14, 15 To overcome such intersegmental differences of MCI caused by the depth‐dependent attenuation of reflected sound waves, the MCI was calibrated by subtracting the adjacent LV cavity contrast intensity, as previously reported, because the acoustic pressure that is applied must be similar between a selected myocardial region and the adjacent LV cavity blood pool during MCE.13, 14 Therefore, spline‐shaped ROIs were placed both in the myocardial layer of each segment and in each adjacent LV cavity to measure the calibrated MCI in the end‐systolic still frame of the MCE images. The values were averaged from the measurements made at 3 different end‐systolic still frames in each segment. The distance between the ROIs in the myocardial and adjacent LV cavity was 6 ± 2 mm. The MCI of any pixel in the ROI was confirmed within a dynamic range, and the mean MCI of each ROI was measured. At each myocardial segment, the calibrated MCI (dB) was determined using the following formula that has been described previously: mean MCI – mean contrast intensity of the adjacent LV cavity.14, 15, 19
To assess the reproducibility of the measurements, replenishment curves and the calibrated MCI in 70 randomly‐selected segments were analyzed at different times by 2 independent blinded observers for interobserver variability and by the same observer for intraobserver variability.
2.5. Statistical analysis
Statistical analyses were performed using IBM SPSS statistics version 20 (IBM Corp., Armonk, NY). Continuous variables were expressed as mean ± standard deviation and compared using an unpaired t test for normally distributed variables or the Mann‐Whitney U test for non‐normally distributed variables. Categorical variables were expressed as percentages and compared using the Fisher exact test. Comparisons of mean values among the 3 groups were performed using 1‐way analysis of variance and post hoc analysis. A receiver operating characteristic (ROC) curve analysis was performed to determine the best cutoff values for differentiating AMI from SCMP. Both inter‐ and intraobserver variability were assessed using a 2‐way, random, single‐measure intraclass correlation coefficient (ICC) and a 1‐way, random, 2‐measure ICC, respectively. A P value <0.05 was considered statistically significant.
3. RESULTS
3.1. Clinical characteristics
A total of 22 patients were ultimately diagnosed with SCMP, whereas 11 patients were diagnosed with AMI. The clinical characteristics of these patients are listed in Table 1. Among patients with AMI, 3 exhibited total occlusion of the proximal left anterior descending artery, 7 showed >90% stenosis of the proximal and/or mid portion of that artery, and 1 individual who did not undergo coronary workups showed sustained apical akinesis on the 1‐year follow‐up echocardiography. All patients with SCMP experienced emotional or physical stress prior to the development of SCMP, including severe medical illnesses that required intensive care in 12 cases, pacemaker implantation in 2 cases, major surgery in 5 cases, the expectation of a palliative operation for ovarian cancer with peritoneal seeding in 1 case, and the death of a close friend or family member in 2 patients.
Table 1.
Clinical characteristics of the study patients with apical ballooning type SCMP and AMI caused by left anterior descending artery occlusion
| SCMP, N = 22 | AMI, N = 11 | P Value | |
|---|---|---|---|
| Age, yr | 63.4 ± 17 | 64.6 ± 9 | 0.638 |
| Female, n (%) | 16 (73%) | 5 (46%) | 0.149 |
| Cardiovascular risk factors, n (%) | |||
| Diabetes | 6 (27%) | 3 (27%) | 1.000 |
| Hypertension | 14 (64%) | 6 (55%) | 0.714 |
| Dyslipidemia | 7 (32%) | 5 (46%) | 0.471 |
| Current smoker | 2 (9%) | 5 (46%) | 0.027 |
| Clinical presentation | |||
| Chest pain | 4 (18%) | 11 (100%) | <0.001 |
| Dyspnea | 14 (64%) | 4 (36%) | 0.163 |
| Pulmonary edema | 15 (68%) | 4 (36%) | 0.136 |
| Cardiac arrest | 1 (5%) | 0 (0%) | 1.000 |
| Electrocardiography, n (%) | |||
| ST‐segment elevation | 5 (23%) | 1 (9%) | 0.637 |
| T‐wave inversion | 16 (73%) | 4 (36%) | 0.008 |
| Cardiac biomarkers | |||
| Peak troponin‐I (ng/mL) | 2.5 ± 4 | 19.3 ± 34 | 0.029 |
| Peak CK‐MB (ng/mL) | 13.2 ± 16 | 110.2 ± 162 | 0.005 |
| Peak BNP (pg/mL) | 2675 ± 3103 | 556 ± 782 | 0.008 |
| Echocardiography | |||
| LV ejection fraction, % | 32 ± 8 | 45 ± 11 | 0.001 |
| RV dysfunction, n (%)1 | 9 (41%) | 0 (0%) | 0.015 |
| Wall motion score index | 2.2 ± 0.3 | 2.0 ± 0.3 | 0.048 |
Abbreviations: AMI, acute myocardial infarction; BNP, B‐type natriuretic peptide; CK‐MB, creatine kinase–myocardial band; LV, left ventricle; RV, right ventricle; SCMP, stress cardiomyopathy.
Values are expressed as mean ± standard deviation or number (%).
RV fractional area change <25%.
3.2. Feasibility and reproducibility of MCE
No side effects associated with the contrast agent were observed. Among 396 myocardial segments in the SCMP patients, quantitative analysis was possible in 267 (67.4%) segments, including 64.7% (86/133) of normokinesis, 73.9% (34/46) of hypokinesis, and 67.7% (147/217) of akinesis segments. Among 198 segments in AMI patients, 129 (65.2%) were valid for quantitative MCE analyses, including 60.7% (51/84) of normokinesis, 62.9% (22/35) of hypokinesis, and 70.9% (56/79) of akinesis segments. In all patients, the inferior and septal walls were permissive for MCE quantitative analyses in 85.9% and 96.0% of segments, respectively, whereas the lateral and anterior walls were permissible for analysis in only 43.4% and 29.3% of segments. The mean width and area of the ROIs were 3 ± 1 mm and 53 ± 9 mm2, respectively.
For measurements of A, ß, Aß, and the calibrated MCI, ICC values indicative of interobserver agreement were 0.758 (95% limits of agreement: 0.614‐0.848, P < 0.001), 0.575 (95% limits of agreement: 0.323‐0.733, P < 0.001), 0.772 (95% limits of agreement: 0.637‐857, P < 0.001), and 0.765 (95% limits of agreement: 0.626‐0.853, P < 0.001), respectively. The ICCs of intraobserver agreement for the measurements of A, ß, Aß, and the calibrated MCI were 0.842 (95% limits of agreement: 0.702‐0.916, P < 0.001), 0.691 (95% limits of agreement: 0.418‐0.836, P < 0.001), 0.749 (95% limits of agreement: 0.528‐0.867, P < 0.001), and 0.767 (95% limits of agreement: 0.604‐0.863, P < 0.001), respectively.
3.3. Quantitative comparisons of myocardial perfusion
In the segment‐based analysis, measurements of A, ß, Aß, and the calibrated MCI were lower in the akinetic than in the normokinetic segments in both the SCMP and AMI groups (Table 2, Figure 1). However, when the perfusion status in the akinetic segments was compared between the 2 groups, values for A, ß, Aß, and the calibrated MCI in SCMP patients were all higher than those in AMI patients (Table 2). All perfusion parameters in the hypokinetic segments were significantly lower than those in the normokinetic segments in patients with AMI, but not SCMP. In a comparison of the perfusion parameters in the hypokinetic segments between groups, A and Aß values in SCMP patients were higher than those in AMI patients, whereas ß and the calibrated MCI were not significantly different between groups (Table 2). Measurements of A, ß, Aß, and the calibrated MCI in normokinetic segments were not significantly different between groups.
Table 2.
Quantitative MCE parameters based on regional wall motion abnormalities in patients with apical ballooning type stress cardiomyopathy and acute myocardial infarction cause by left anterior descending artery occlusion
| Stress Cardiomyopathy | Acute Myocardial Infarction | |||||||
|---|---|---|---|---|---|---|---|---|
| Normokinesis,n = 86 | Hypokinesis,n = 34 | Akinesis,n = 147 | P Value | Normokinesis,n = 51 | Hypokinesis,n = 22 | Akinesis,n = 56 | P Value | |
| A (dB) | 16.95 ± 4.9 | 16.53 ± 6.8 | 14.77 ± 5.11 | 0.006 | 16.63 ± 5.1 | 12.32 ± 5.61 , 2 | 9.75 ± 5.31 , 2 | <0.001 |
| ß (s−1) | 0.89 ± 0.4 | 0.75 ± 0.5 | 0.46 ± 0.33 | <0.001 | 0.80 ± 0.5 | 0.53 ± 0.31 | 0.37 ± 0.31 , 2 | <0.001 |
| Aß (dB/s) | 15.31 ± 9.0 | 12.75 ± 9.4 | 6.94 ± 5.53 | <0.001 | 12.57 ± 6.4 | 5.27 ± 2.71 , 2 | 2.74 ± 1.61 , 2 | <0.001 |
| Calibrated MCI (dB) | –15.88 ± 3.9 | –16.74 ± 4.2 | –19.15 ± 3.93 | <0.001 | –15.33 ± 4.5 | –18.57 ± 3.11 | –24.69 ± 3.42 , 3 | <0.001 |
| Myocardial CI (dB) | 14.79 ± 4.4 | 14.18 ± 5.3 | 11.06 ± 4.3 | 16.17 ± 4.8 | 11.69 ± 4.5 | 6.82 ± 3.8 | ||
| LV cavity CI (dB) | 30.58 ± 2.9 | 30.93 ± 4.1 | 30.22 ± 3.3 | 31.51 ± 3.1 | 30.26 ± 3.7 | 31.51 ± 3.6 | ||
Abbreviations: ß, replenishment curve slope; A, peak plateau MCI; Aß, myocardial blood flow; CI, contrast intensity; LV, left ventricle; MCE, myocardial contrast echocardiography; MCI, myocardial contrast intensity
P < 0.05 vs normokinesis.
P < 0.05 vs stress cardiomyopathy.
P < 0.05 vs normokinesis and hypokinesis.
Figure 1.
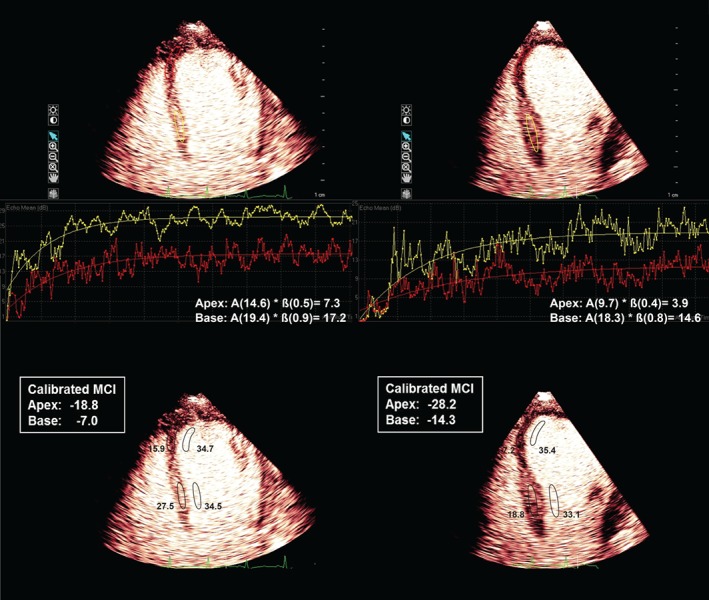
Representative examples of the perfusion status based on the replenishment curve analysis (upper panels) and calibration technique (lower panels); an SCMP patient is shown on the left and an AMI patient is shown on the right. Abbreviations: ß, replenishment curve slope; A, peak plateau MCI; AMI, acute myocardial infarction; MCI, myocardial contrast intensity; SCMP, stress cardiomyopathy.
For patient‐based analyses, the mean values for quantitative parameters in the apical and basal segments were calculated in each patient. All averaged parameters of the quantitative MCE in the apical segments, except for ß, were significantly lower in AMI than in SCMP patients (Table 3). There was no significant difference between groups in any parameter measured in the basal segments.
Table 3.
Quantitative MCE parameters in patients with apical ballooning type SCMP and AMI caused by left anterior descending artery occlusion
| Apex1 | Base2 | |||||
|---|---|---|---|---|---|---|
| SCMP, N = 22 | AMI, N = 11 | P Value | SCMP, N = 22 | AMI, N = 11 | P Value | |
| A (dB) | 13.52 ± 3.5 | 9.70 ± 4.1 | 0.009 | 15.86 ± 3.2 | 14.53 ± 3.6 | 0.283 |
| ß (s–1) | 0.45 ± 0.2 | 0.38 ± 0.2 | 0.358 | 0.87 ± 0.3 | 0.76 ± 0.3 | 0.269 |
| Aß (dB/s) | 6.22 ± 4.1 | 2.83 ± 1.3 | 0.012 | 13.99 ± 6.2 | 10.93 ± 3.6 | 0.140 |
| Calibrated MCI (dB) | –19.35 ± 2.7 | –25.09 ± 2.3 | <0.001 | –16.01 ± 2.5 | –15.24± 2.6 | 0.408 |
Abbreviations: ß, replenishment curve slope; A, peak plateau MCI; AMI, acute myocardial infarction; Aß, myocardial blood flow; MCE, myocardial contrast echocardiography; MCI, myocardial contrast intensity; SCMP, stress cardiomyopathy.
Apical segments in all enrolled patients showed akinesis,
Basal segments showed normokinesis in 19 SCMP and 10 AMI patients. The remaining patients showed hypokinesis in those segments.
3.4. Perfusion parameters for differentiating AMI
Based on the segment‐based analyses, the areas under the curve for the ROC curves of A, ß, Aß, and the calibrated MCI for diagnosing AMI were 0.752, 0.620, 0.786, and 0.857, respectively (Figure 2A). The best cutoff values to diagnose AMI were Aß < 3.5 dB/s (sensitivity, 70%; specificity, 77%) and a calibrated MCI < –24 dB (sensitivity, 70%; specificity, 90%). For the patient‐based analyses, the areas under the curve for the ROC curves of A, ß, Aß, and the calibrated MCI, which were averaged in the apical akinetic segments for differentiating AMI, were 0.769, 0.607, 0.822, and 0.934, respectively (Figure 2B). The best cutoff values to diagnose AMI were Aß < 3.7 dB/s (sensitivity, 82%; specificity, 82%) and calibrated MCI < –23 dB (sensitivity, 91%; specificity, 95%). To help check the separation or overlap between groups using above cutoff values, the individual data spreads are shown in the Supporting Table in the online version of this article. When applying the cutoff values to the individual data, 2 patients showed Aß lower than the cutoff, even though they had SCMP, and 2 patients showed higher Aß than the cutoff, even though they had AMI. In calibrated MCI, 3 patients with AMI showed higher value than the cutoff, and 1 patient with SCMP showed borderline value.
Figure 2.
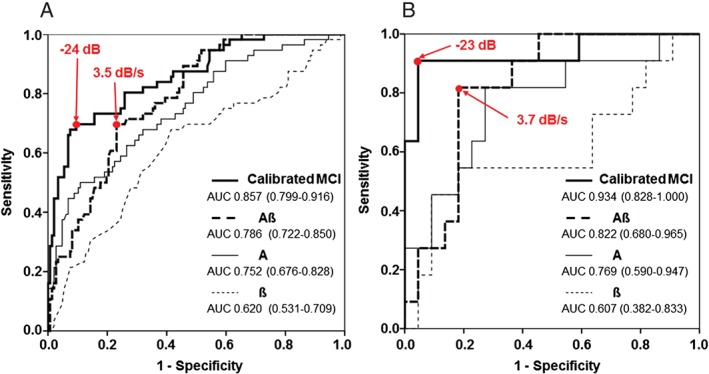
Receiver operating characteristic curves of A, ß, Aß, and the calibrated MCI for differentiating AMI from SCMP were obtained by segment‐based (A) and patient‐based (B) analyses. Numbers in parentheses indicate 95% confidence intervals. Abbreviations: ß, replenishment curve slope; A, peak plateau MCI; Aß, myocardial blood flow; AMI, acute myocardial infarction; AUC, area under the curve; MCI, myocardial contrast intensity; SCMP, stress cardiomyopathy.
4. DISCUSSION
4.1. Quantitative analysis of myocardial perfusion
We assessed the quantitative myocardial perfusion status in patients with SCMP and AMI using MCE, and found that myocardial perfusion in akinetic segments was significantly reduced in patients with AMI compared with SCMP, although myocardial perfusion was relatively decreased in akinetic compared to normokinetic segments, even in SCMP patients.
Previous studies have suggested that SCMP could account for 0.7% to 2.2% of patients who present with acute coronary syndrome.1, 9, 10, 20, 21 Although both SCMP and AMI present with acute chest pain/dyspnea, cardiac enzyme elevation, and ST‐segment changes or T‐wave inversions in electrocardiograms, SCMP patients who have no coronary artery obstruction show a favorable prognosis with an in‐hospital mortality only of 1% to 3%.1, 3, 20 By contrast, AMI patients have a significant coronary artery obstruction and experience ~23% in‐hospital mortalities if proper intervention is delayed or not performed.22 Therefore, in this clinical setting, coronary angiography or equivalent tests, such as a CT angiogram, thallium scan, or magnetic resonance imaging, are performed to exclude AMI.2, 3, 4, 9, 23, 24, 25, 26 Several clinical trials have been conducted to differentiate those 2 disease entities by analyzing patient clinical characteristics and myocardial perfusion status.6, 9, 11 However, whether myocardial perfusion is reduced in patients with SCMP or whether evaluations of myocardial perfusion status can differentiate SCMP from AMI remains the subject of debate.5, 6, 9, 11, 27, 28 Galiuto et al showed that the magnitudes of perfusion defects within dysfunctional myocardial regions were similar between SCMP and AMI patients.6 This finding is in accord with our current data, as myocardial perfusion was reduced in the akinetic area, even in patients with SCMP. However, we found that myocardial perfusion was more severely reduced in dysfunctional myocardium in patients with AMI than in patients with SCMP. The discrepant results between these 2 studies might be attributable to the use of different methods to analyze myocardial perfusion. Whereas Galiuto et al used a semiquantitative method, we here analyzed MCE quantitatively using a replenishment curve and the calibrated MCI. In agreement with our present findings, Choi et al showed generally preserved perfusion status in patients with SCMP compared with AMI in an MCE study that was based on qualitative and quantitative analyses.11 Therefore, our current findings suggested that quantitative analyses of myocardial perfusion are needed to differentiate SCMP from AMI, as perfusion defects can often be observed, even in cases of SCMP, by qualitative assessments.5, 6, 7, 8, 9 The pathogenic mechanism underlying reduced myocardial perfusion in the dysfunctional myocardium in SCMP patients remains to be elucidated. Because MCE reflects myocardial microcirculation,12, 13 impaired perfusion in MCE might be caused by microvascular dysfunction that results from multivessel epicardial spasm,29 endothelial dysfunction,30 microvascular spasm,31 or catecholamine‐induced myocardial stunning.32
Notably in our present study, quantitative myocardial perfusion parameters were compared between 2 disease entities, both in akinetic segments and hypokinetic or normokinetic segments. In hypokinetic segments, patients with AMI showed a trend to have more greatly reduced myocardial perfusion compared with patients with SCMP, and values of A and Aß in SCMP patients were significantly higher than those in AMI patients. By contrast, myocardial perfusion was not found to differ between the 2 disease entities in normokinetic segments. In our patients with SCMP, myocardial perfusion in akinetic segments was significantly reduced compared with that observed in normokinetic segments, whereas myocardial perfusion in hypokinetic segments was not different. However, for our AMI patients, myocardial perfusion in both akinetic and hypokinetic segments was depressed compared with normokinetic segments. Hence, myocardial perfusion in a dysfunctional myocardium is more markedly reduced in patients with AMI compared with SCMP cases. Disturbances in perfusion can thus be detected even in hypokinetic segments in the former group of patients.
4.2. Calibrated MCI
Compared to a bolus injection, the continuous peripheral venous infusion of contrast agent can reduce attenuation artifacts,13 but myocardial MCI can vary substantially among myocardial segments, even in normally perfused segments by far‐field shadowing that results from a high concentration of microbubbles in the near field.33, 34 The concept of the relative MCI of myocardium to the adjacent LV cavity MCI, known as the calibrated MCI, has been described previously and shown to reduce the intersegmental differences of MCI caused by ultrasound attenuation.13, 14, 15, 19 Calibrated MCI has been previously used to quantitatively estimate myocardial perfusion and viability in patients with myocardial infarction.14, 15 In our current study, calibrated MCI yielded a consistent finding that was also revealed using replenishment curve analysis. We found that akinetic segments showed significantly lower values of myocardial perfusion compared with normokinetic segments in both AMI and SCMP patients, and myocardial perfusion in akinetic segments was more greatly reduced in patients with AMI compared with SCMP. Especially, when applying the cutoff values to our individual data, all SCMP patients except 1 borderline patient showed higher calibrated MCI than the cutoff, which suggest that the possibility of SCMP may be excluded when the calibrated MCI is lower than −23.
4.3. Clinical implications
The cutoff values suggested by our present analysis for differentiating AMI from SCMP can be used in clinical practice. Notably, the calibrated MCI generally showed a greater area under the curve compared with other myocardial perfusion parameters that we obtained from the replenishment curve analysis. As it takes more time and effort to both obtain and analyze a replenishment curve for myocardial perfusion, it is important to emphasize the differential diagnostic power of calibrated MCI, which can be relatively easily performed. The time required for data acquisition and analysis can be greatly reduced if a calibrated MCI is used instead of replenishment curve analysis. The clinical utility of this simple method may be especially critical in settings where AMI, as opposed to SCMP, should be urgently ruled out.
4.4. Study limitations
This study had several limitations of note. First, it was a single‐center study with a small patient cohort, especially for cases of AMI. Second, quantitative analysis of myocardial perfusion was not possible in all segments. In some segments, exponential replenishment curves could not be generated because of the extremely slow or fast rates of replenishment, or poor image quality. In this regard, a calibrated MCI may represent a more promising measurement to assess myocardial perfusion. Even though quantitative measurement might be challenging to acquire, it can still be helpful because clinical judgement at the bedside is only possible occasionally. Third, MCE was not performed on the same day of symptom/sign in all patients. In particular, 3 patients underwent MCE on the second day after symptom onset. Because of the characteristic of SCMP, there might have been a perfusion change during that time frame, even though the same wall motion abnormality was shown. Finally, coronary artery evaluation was not possible in 8 of our patients because of their poor general condition or refusal to undergo coronary studies. In those cases, a final diagnosis was made based on comprehensive evaluations of the clinical clues of SCMP and the subsequent recovery of myocardial dysfunction. Although coronary evaluations are necessary to arrive at a diagnosis of SCMP, a significant coronary lesion cannot rule out SCMP.4, 35, 36
5. CONCLUSION
Although myocardial perfusion is relatively reduced in the akinetic segments of patients with SCMP, a quantitative segmental analysis of myocardial perfusion using MCE can help to discriminate AMI from SCMP.
Conflicts of interest
The authors declare no potential conflict of interests.
Supporting information
Supplemental Table. Quantitative MCE parameters in individual patient.
Min S‐Y, Song J‐M, Shin Y, Sin M‐J, Kim D‐H, Kang D‐H and Song J‐K. Quantitative segmental analysis of myocardial perfusion to differentiate stress cardiomyopathy from acute myocardial infarction: A myocardial contrast echocardiography study, Clin Cardiol, 2017;40:679–685. 10.1002/clc.22714
Funding Information Korean Institute of Medicine.
REFERENCES
- 1. Gianni M, Dentali F, Grandi AM, et al. Apical ballooning syndrome or takotsubo cardiomyopathy: a systematic review. Eur Heart J. 2006;27:1523–1529. [DOI] [PubMed] [Google Scholar]
- 2. Nef HM, Mollmann H, Elsasser A. Tako‐tsubo cardiomyopathy (apical ballooning). Heart. 2007;93:1309–1315. [DOI] [PMC free article] [PubMed] [Google Scholar]
- 3. Bybee KA, Kara T, Prasad A, et al. Systematic review: transient left ventricular apical ballooning: a syndrome that mimics ST‐segment elevation myocardial infarction. Ann Intern Med. 2004;141:858–865. [DOI] [PubMed] [Google Scholar]
- 4. Prasad A, Lerman A, Rihal CS. Apical ballooning syndrome (Tako‐Tsubo or stress cardiomyopathy): a mimic of acute myocardial infarction. Am Heart J. 2008;155:408–417. [DOI] [PubMed] [Google Scholar]
- 5. Abdelmoneim SS, Mankad SV, Bernier M, et al. Microvascular function in Takotsubo cardiomyopathy with contrast echocardiography: prospective evaluation and review of literature. J Am Soc Echocardiogr. 2009;22:1249–1255. [DOI] [PubMed] [Google Scholar]
- 6. Galiuto L, De Caterina AR, Porfidia A, et al. Reversible coronary microvascular dysfunction: a common pathogenetic mechanism in Apical Ballooning or Tako‐Tsubo Syndrome. Eur Heart J. 2010;31:1319–1327. [DOI] [PubMed] [Google Scholar]
- 7. Elesber A, Lerman A, Bybee KA, et al. Myocardial perfusion in apical ballooning syndrome correlate of myocardial injury. Am Heart J. 2006;152:469e9–e13. [DOI] [PubMed] [Google Scholar]
- 8. Kurisu S, Inoue I, Kawagoe T, et al. Myocardial perfusion and fatty acid metabolism in patients with tako‐tsubo‐like left ventricular dysfunction. J Am Coll Cardiol. 2003;41:743–748. [DOI] [PubMed] [Google Scholar]
- 9. Ito K, Sugihara H, Katoh S, et al. Assessment of Takotsubo (ampulla) cardiomyopathy using 99mTc‐tetrofosmin myocardial SPECT—comparison with acute coronary syndrome. Ann Nucl Med. 2003;17:115–122. [DOI] [PubMed] [Google Scholar]
- 10. Bybee KA, Prasad A, Barsness GW, et al. Clinical characteristics and thrombolysis in myocardial infarction frame counts in women with transient left ventricular apical ballooning syndrome. Am J Cardiol. 2004;94:343–346. [DOI] [PubMed] [Google Scholar]
- 11. Choi JH, Nam JH, Son JW, et al. Clinical usefulness of myocardial contrast echocardiography to detect stress‐induced cardiomyopathy in the emergency department. Circ J. 2012;76:1393–1398. [DOI] [PubMed] [Google Scholar]
- 12. Dijkmans PA, Senior R, Becher H, et al. Myocardial contrast echocardiography evolving as a clinically feasible technique for accurate, rapid, and safe assessment of myocardial perfusion: the evidence so far. J Am Coll Cardiol. 2006;48:2168–2177. [DOI] [PubMed] [Google Scholar]
- 13. Wei K, Jayaweera AR, Firoozan S, et al. Quantification of myocardial blood flow with ultrasound‐induced destruction of microbubbles administered as a constant venous infusion. Circulation. 1998;97:473–483. [DOI] [PubMed] [Google Scholar]
- 14. Yamada S, Komuro K, Mikami T, et al. Novel quantitative assessment of myocardial perfusion by harmonic power Doppler imaging during myocardial contrast echocardiography. Heart. 2005;91:183–188. [DOI] [PMC free article] [PubMed] [Google Scholar]
- 15. Yano A, Ito H, Iwakura K, et al. Myocardial contrast echocardiography with a new calibration method can estimate myocardial viability in patients with myocardial infarction. J Am Coll Cardiol. 2004;43:1799–1806. [DOI] [PubMed] [Google Scholar]
- 16. Thygesen K, Alpert JS, White HD, et al. Universal definition of myocardial infarction. Circulation. 2007;116:2634–2653. [DOI] [PubMed] [Google Scholar]
- 17. Berti M, Ghizzoni G, Gualeni A, et al. Electrocardiographic pattern combined with echocardiographic wall motion abnormalities in stress related cardiomyopathies: clinical and pathophysiological insights. Arch Cardiol Mex. 2012;82:22–30. [PubMed] [Google Scholar]
- 18. Schiller NB, Shah PM, Crawford M, et al. Recommendations for quantitation of the left ventricle by two‐dimensional echocardiography. American Society of Echocardiography Committee on Standards, Subcommittee on Quantitation of Two‐Dimensional Echocardiograms. J Am Soc Echocardiogr. 1989;2:358–367. [DOI] [PubMed] [Google Scholar]
- 19. Miyagawa S, Masai T, Fukuda H, et al. Coronary microcirculatory dysfunction in aortic stenosis: myocardial contrast echocardiography study. Ann Thorac Surg. 2009;87:715–719. [DOI] [PubMed] [Google Scholar]
- 20. Bybee KA, Prasad A. Stress‐related cardiomyopathy syndromes. Circulation. 2008;118:397–409. [DOI] [PubMed] [Google Scholar]
- 21. Pilliere R, Mansencal N, Digne F, et al. Prevalence of tako‐tsubo syndrome in a large urban agglomeration. Am J Cardiol. 2006;98:662–665. [DOI] [PubMed] [Google Scholar]
- 22. Canto JG, Shlipak MG, Rogers WJ, et al. Prevalence, clinical characteristics, and mortality among patients with myocardial infarction presenting without chest pain. JAMA. 2000;283:3223–3229. [DOI] [PubMed] [Google Scholar]
- 23. Nance JW, Schoepf UJ, Ramos‐Duran L. Tako‐tsubo cardiomyopathy: findings on cardiac CT and coronary catheterisation. Heart. 2010;96:406–407. [DOI] [PubMed] [Google Scholar]
- 24. Kim ST, Lee H, Paik SH, et al. Apical‐sparing variant of stress cardiomyopathy: Integrative analysis with multidetector row cardiac computed tomography in dual‐energy mode. J Cardiovasc Comput Tomogr. 2012;6:140–142. [DOI] [PubMed] [Google Scholar]
- 25. Eitel I, Behrendt F, Schindler K, et al. Differential diagnosis of suspected apical ballooning syndrome using contrast‐enhanced magnetic resonance imaging. Eur Heart J. 2008;29:2651–2659. [DOI] [PubMed] [Google Scholar]
- 26. Eitel I, von Knobelsdorff‐Brenkenhoff F, Bernhardt P, et al. Clinical characteristics and cardiovascular magnetic resonance findings in stress (takotsubo) cardiomyopathy. JAMA. 2011;306:277–286. [DOI] [PubMed] [Google Scholar]
- 27. Ramakrishna G, Ravi BS, Chandrasekaran K. Apical ballooning syndrome in a postoperative patient with normal microvascular perfusion by myocardial contrast echocardiography. Echocardiography. 2005;22:606–610. [DOI] [PubMed] [Google Scholar]
- 28. Abe Y, Kondo M, Matsuoka R, et al. Assessment of clinical features in transient left ventricular apical ballooning. J Am Coll Cardiol. 2003;41:737–742. [DOI] [PubMed] [Google Scholar]
- 29. Kurisu S, Sato H, Kawagoe T, et al. Tako‐tsubo‐like left ventricular dysfunction with ST‐segment elevation: a novel cardiac syndrome mimicking acute myocardial infarction. Am Heart J. 2002;143:448–455. [DOI] [PubMed] [Google Scholar]
- 30. Martin EA, Prasad A, Rihal CS, et al. Endothelial function and vascular response to mental stress are impaired in patients with apical ballooning syndrome. J Am Coll Cardiol. 2010;56:1840–1846. [DOI] [PMC free article] [PubMed] [Google Scholar]
- 31. Rigo F, Sicari R, Citro R, et al. Diffuse, marked, reversible impairment in coronary microcirculation in stress cardiomyopathy: a Doppler transthoracic echo study. Ann Med. 2009;41:462–470. [DOI] [PubMed] [Google Scholar]
- 32. Wittstein IS, Thiemann DR, Lima JA, et al. Neurohumoral features of myocardial stunning due to sudden emotional stress. N Engl J Med. 2005;352:539–548. [DOI] [PubMed] [Google Scholar]
- 33. Andrassy P, Zielinska M, Busch R, et al. Myocardial blood volume and the amount of viable myocardium early after mechanical reperfusion of acute myocardial infarction: prospective study using venous contrast echocardiography. Heart. 2002;87:350–355. [DOI] [PMC free article] [PubMed] [Google Scholar]
- 34. Witt S. Implementing microbubble contrast in the echocardiography laboratory: a sonographer's perspective. Am J Cardiol. 2002;90:15J–16J. [DOI] [PubMed] [Google Scholar]
- 35. Saadatifar H, Khoshhal Dehdar F, Saadatifar S, et at. Takotsubo cardiomyopathy with significant coronary stenosis and atrioventricular conduction block: a rare case report with 3 year follow‐up. Res Cardiovasc Med. 2016;5:e27839. [DOI] [PMC free article] [PubMed] [Google Scholar]
- 36. Alfonso CE. Takotsubo cardiomyopathy and coronary artery disease: a meaningful coincidence? J Am Heart Assoc. 2016;5:e005131. [DOI] [PMC free article] [PubMed] [Google Scholar]
Associated Data
This section collects any data citations, data availability statements, or supplementary materials included in this article.
Supplementary Materials
Supplemental Table. Quantitative MCE parameters in individual patient.