

ABSTRACT
Background
Coronary artery calcium (CAC) has been demonstrated to independently predict the risk of cardiovascular events and all‐cause mortality, especially among White populations. Although the population distribution of CAC has been determined for several White populations, the distribution in ethnically admixed groups has not been well established.
Hypothesis
The CAC distribution, stratified for age, gender and race, is similar to the previously described distribution in the MESA study.
Methods
The Brazilian Longitudinal Study of Adult Health (ELSA‐Brasil) is a prospective cohort study designed to investigate subclinical cardiovascular disease in 6 different centers of Brazil. Similar to previous studies, individuals with self‐reported coronary or cerebrovascular disease and those treated for diabetes mellitus were excluded from analysis.
Results
Percentiles of CAC distribution were estimated with nonparametric techniques. The analysis included 3616 individuals (54% female; mean age, 50 years). As expected, CAC prevalence and burden were steadily higher with increasing age, as well as increased in men and in White individuals. Our results revealed that for a given CAC score, the ELSA‐derived CAC percentile would be lower in men compared with the Multi‐Ethnic Study of Atherosclerosis (MESA) and would be higher in women compared with MESA.
Conclusions
In our sample of the Brazilian population, we observed significant differences in CAC by sex, age, and race. Adjusted for age and sex, low‐risk individuals from the Brazilian population present with significantly lower CAC prevalence and burden compared with other low‐risk individuals from other worldwide populations. Using US‐derived percentiles in Brazilian individuals may lead to overestimating relative CAC burden in men and underestimating relative CAC burden in women.
Introduction
Noncontrast cardiac computed tomography (CT) is widely used to estimate the presence and extent of coronary artery calcium (CAC).1, 2 Coronary artery calcium detected by cardiac CT has been shown to correlate well with the presence of coronary atherosclerotic plaques in autopsy studies,3 as well as with the presence and extent of coronary artery disease (CAD) detected by angiography.4, 5 More recent studies have demonstrated that CAC is a robust and independent predictor of cardiovascular events and all‐cause mortality.6, 7, 8
Even though CAC is an independent predictor of atherosclerosis, the presence and extent of CAC are associated with age and sex. Thus, gender‐specific nomograms have been proposed.9, 10 However, prior studies have also suggested that the prevalence of high CAC is lower in non‐White ethnicities, with differences in prevalence >20%.11, 12, 13, 14
Beyond ethnic differences, one large study compared the prevalence and severity of CAC on 2 large White populations, one from North America and the other from Europe.15 In the United States, the prevalence of CAC was lower compared with Europe, even after adjustment for age, sex, ethnicity, and other known cardiovascular risk factors. This suggests that other characteristics beyond traditional race groups such as geography and culture can influence CAC results. Compared with the Americans and Europeans analyzed in previous studies, the Brazilian population has a significant admixed ethnic background. This unique characteristic could influence the distribution of CAC, and results might be different from findings in populations with less admixture.
Thus, in the present study we sought to describe the age, sex, and ethnic distribution of CAC score detected by CT in an ethnically admixed urban Brazilian population.
Methods
Study Participants
The Brazilian Longitudinal Study of Adult Health (ELSA‐Brasil) design and concepts have been detailed elsewhere.16 Briefly, it is a cohort study of 15 105 civil servants age 35 to 74 years living in 6 cities (Belo Horizonte, Porto Alegre, Rio de Janeiro, Salvador, São Paulo, and Vitória). Baseline assessment took place from August 2008 to December 2010 and consisted of an approximately 7‐hour evaluation, which included in‐person interviews conducted by trained personnel. These interviews focused on sociodemographic characteristics, health and medical history, occupational exposure, family history of disease, reproductive health, health care, psychosocial factors, body weight history and body image, food consumption, smoking, alcohol consumption, physical activity, medication use, cognitive function, mental health, and clinical and laboratory measurements. Approvals from all institutional review boards were granted, and all individuals signed informed consent. In an ongoing ancillary study, a subsample of 4546 participants of the ELSA‐Brasil participants of the São Paulo site were submitted to CAC determination. In the present analysis, for purpose of comparison with Multi‐Ethnic Study of Atherosclerosis (MESA) participants,11 we used individuals without clinically apparent cardiovascular disease (CVD) defined as prior myocardial infarction, stroke, heart failure, and coronary revascularization. In addition, individuals who reported a diagnosis of diabetes mellitus (DM) were also excluded from the present analysis. (For details on inclusion and exclusion of participants in the present analysis, see Supporting Information, Figure, in the online version of this article.) Thus, for the analysis presented in this article, we used data on 3616 healthy individuals who submitted to CAC measurements and did not fulfill exclusion criteria to participate in this substudy.
Race/Color Definition
Race was self‐defined on phenotypic basis according to the following question: “The Brazilian Census uses some terms, Black, Brown ('pardos'), White, Asian, and Indigenous, to classify an individual's race. If you had to respond to the Brazilian Census today, how would you classify your race?” The Brown race (“pardos”) is an admixed race used to define individuals who have mixed backgrounds, usually of White and Black origin. This admixed race is a recognized race by Brazilian authorities, and individuals usually self‐define themselves as having an admixed background. For this study, Asians and individuals of Native ancestry were excluded because the number of individuals in these categories was too small (192 individuals).
Coronary Artery Calcium Measurement
The ELSA‐Brasil participants from the São Paulo site underwent noncontrast CT for CAC score evaluation. The scans were performed using a 64 detector CT scanner (Philips Brilliance; Philips, Best, Netherlands). The field of view was set to include the entire heart, and the z‐axis direction included data from the bifurcation of the pulmonary arteries to the apex of the heart during an expiratory pause. The default settings included 120 Kv, mA adjusted to body mass index, 1‐phase prospective acquisition at 70% (mid‐diastole) of the cardiac cycle and collimation of 2.5 mm, gantry rotation of 400 ms, and reconstructed with a standard filter. The images were analyzed using a dedicated software (Brilliance Workspace). The measurement of the CAC score was calculated using a threshold of 130 HU according to previously published criteria.1 The results are presented as the absolute value of the Agatston CAC score.
Other Variables
Age was classified in strata of 10‐year intervals (35–44, 45–54, 55–64, 65–74). Educational level was provided by participants and stratified accordingly. For purpose of comparison with MESA, DM and dyslipidemia used in this analysis were self‐referred. Hypertension was defined as systolic blood pressure >140 mm Hg, diastolic blood pressure >90 mm Hg, or use of antihypertensive drug treatment.
Statistical Analysis
To provide valid comparisons we have used the same analytical strategy as proposed by McClelland et al.11 In brief, a nonparametric strategy using the mean of the log CAC distribution as a function of age for each sex and race was derived. We selected the 25th, 50th, and 90th percentiles for each age by sex and ethnicity, using a local regression smoother with a smoothing span of 0.85. To assess the absolute and relative distributions of CAC in the overall sample we defined (1) prevalence of CAC as the number of subjects with the presence of any CAC; and (2) extent of CAC according to absolute (defined as strata of 1–100, 101–400, 401–1000, and >1000 Agatston score) and relative cutoff values (defined as the 25th, 50th, 75th, 90th, and 95th percentiles within age‐ and sex‐specific strata).
Results
General Characteristics of the Studied Sample
Table 1 presents the characteristics of our study sample. From the initial 4546 CAC measurements available, we excluded 388 individuals because of previous CVD or DM. Of the remaining 3855 individuals, 47 were excluded for missing data on ethnicity and 192 because of Asian or Native ethnicity. After all exclusions, 3616 subjects remained for analysis, with 45.7% male and average age of 50 ± 8 years. The self‐reported ethnicity distribution was 13.9% Black, 63.3% White, and 22.8% Brown. Sixteen percent of individuals were current smokers, 26% met criteria for hypertension, and 29.5% met criteria for dyslipidemia. Forty‐three percent had completed high school.
Table 1.
Baseline Characteristics in the Sample
| White | Brown | Black | Total | |||||||||||||
|---|---|---|---|---|---|---|---|---|---|---|---|---|---|---|---|---|
| Men | Women | Men | Women | Men | Women | Men | Women | |||||||||
| n | % | n | % | n | % | n | % | n | % | n | % | n | % | n | % | |
| Age, y | ||||||||||||||||
| 35–44 | 266 | 26.39 | 313 | 24.41 | 130 | 30.81 | 123 | 30.67 | 70 | 31.25 | 80 | 28.67 | 466 | 28.17 | 516 | 26.30 |
| 45–54 | 411 | 40.77 | 532 | 41.50 | 205 | 48.58 | 201 | 50.12 | 106 | 47.32 | 136 | 48.75 | 722 | 43.65 | 869 | 44.29 |
| 55–64 | 228 | 22.62 | 341 | 26.60 | 74 | 17.54 | 71 | 17.71 | 40 | 17.86 | 54 | 19.35 | 342 | 20.68 | 466 | 23.75 |
| 65–75 | 103 | 10.22 | 96 | 7.49 | 13 | 3.08 | 6 | 1.50 | 8 | 3.57 | 9 | 3.23 | 124 | 7.50 | 111 | 5.66 |
| HTN | ||||||||||||||||
| N | 732 | 72.69 | 1040 | 81.12 | 257 | 60.90 | 304 | 75.81 | 144 | 64.29 | 196 | 70.25 | 1133 | 68.54 | 1540 | 78.49 |
| Y | 275 | 27.31 | 242 | 18.88 | 165 | 39.10 | 97 | 24.19 | 80 | 35.71 | 83 | 29.75 | 520 | 31.46 | 422 | 21.51 |
| Dyslipidemia | ||||||||||||||||
| N | 684 | 67.99 | 891 | 69.50 | 307 | 73.10 | 297 | 74.06 | 165 | 73.66 | 200 | 71.94 | 1156 | 70.06 | 1388 | 70.78 |
| Y | 322 | 32.01 | 391 | 30.50 | 113 | 26.90 | 104 | 25.94 | 59 | 26.34 | 78 | 28.06 | 494 | 29.94 | 573 | 29.22 |
| Cigarette smoking | ||||||||||||||||
| Never | 519 | 51.49 | 744 | 58.03 | 204 | 48.34 | 236 | 58.85 | 95 | 42.41 | 142 | 50.90 | 818 | 49.46 | 1122 | 57.19 |
| Former | 344 | 34.13 | 360 | 28.08 | 139 | 32.94 | 91 | 22.69 | 81 | 36.16 | 72 | 25.81 | 564 | 34.10 | 523 | 26.66 |
| Current | 145 | 14.38 | 178 | 13.88 | 79 | 18.72 | 74 | 18.45 | 48 | 21.43 | 65 | 23.30 | 272 | 16.44 | 317 | 16.16 |
| Education | ||||||||||||||||
| Basic education | 117 | 11.61 | 71 | 5.54 | 124 | 31.39 | 75 | 18.70 | 64 | 28.57 | 49 | 17.56 | 305 | 18.75 | 195 | 9.94 |
| Secondary school | 353 | 35.02 | 457 | 35.65 | 203 | 51.39 | 219 | 54.61 | 132 | 58.93 | 152 | 54.48 | 688 | 42.29 | 828 | 42.20 |
| University | 538 | 53.37 | 754 | 58.81 | 68 | 17.22 | 107 | 26.68 | 28 | 12.50 | 78 | 27.96 | 634 | 38.97 | 939 | 47.86 |
| Family income | ||||||||||||||||
| HHI/year < $20 000 | 104 | 10.35 | 97 | 7.60 | 109 | 25.89 | 92 | 23.12 | 65 | 29.02 | 75 | 26.88 | 278 | 16.85 | 264 | 13.51 |
| HHI/year ≥ $20 000 | 901 | 89.65 | 1180 | 92.40 | 312 | 74.11 | 306 | 76.88 | 159 | 70.98 | 204 | 73.12 | 1372 | 83.15 | 1690 | 86.49 |
| BMI, kg/m2 | ||||||||||||||||
| <25 | 370 | 36.71 | 518 | 40.41 | 151 | 35.78 | 118 | 29.43 | 62 | 27.68 | 56 | 30.82 | 583 | 35.25 | 722 | 36.80 |
| 25– < 30 | 450 | 44.64 | 471 | 36.74 | 176 | 41.71 | 174 | 43.39 | 116 | 51.79 | 104 | 37.28 | 742 | 44.86 | 749 | 38.18 |
| 30– < 40 | 175 | 17.36 | 273 | 21.29 | 99 | 20.85 | 101 | 25.19 | 44 | 19.64 | 80 | 28.67 | 307 | 18.56 | 454 | 23.14 |
| BMI >40 | 13 | 1.29 | 20 | 1.56 | 7 | 1.66 | 8 | 2.00 | 2 | 0.89 | 9 | 3.23 | 22 | 1.33 | 37 | 1.89 |
Abbreviations: BMI, body mass index; HHI, household income; HTN, hypertension; N, no; Y, yes.
Figure 1 presents percentile curves as a function of age in the 3 analyzed ethnic groups. As described for other populations, CAC amount and prevalence increased with age. The prevalence of having a CAC score >0 increased with age for both men and women (Figure 2). Compared with women, men presented a higher chance of presenting a CAC score >0 throughout their entire life span. Interestingly, the slope of increase in the probability of a CAC score different from zero in relation to age was higher in men until approximately 50 years of age. After this, men and women present similar increases in CAC prevalence until their seventh decade of life. The overall prevalence of CAC = 0 for men and women was 35.6% and 16.8%, respectively.
Figure 1.

Percentiles of CAC for age by ethnic group. Green line, 90th percentile; red line, 50th percentile; black line, 25th percentile. Abbreviations: CAC, coronary artery calcium.
Figure 2.
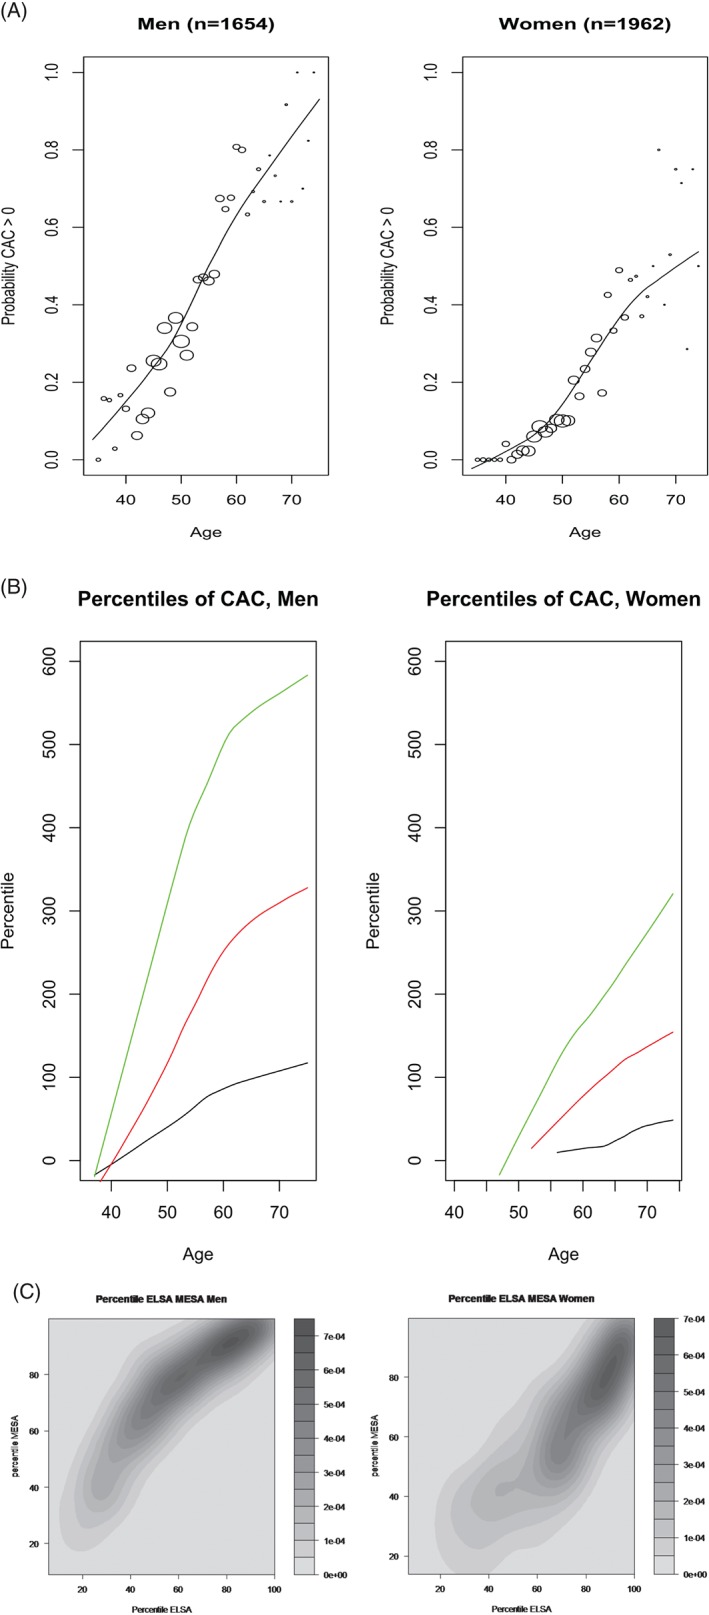
(A) Probability of presenting with CAC score >0 for men and women according to age. (B) Percentiles of CAC for age in men and women. Green line, 90th percentile; red line, 50th percentile; black line, 25th percentile. (C) Bivariate density function of percentile ELSA‐Brasil and percentile MESA. Abbreviations: CAC, coronary artery calcium; ELSA, Brazilian Longitudinal Study of Adult Health; MESA, Multi‐Ethnic Study of Atherosclerosis.
Categorizing Coronary Artery Calcium Scores
For the frequencies of individuals according to different CAC score cutoff points, see Supporting Information, Table, in the online version of this article. Interestingly, even with the known problems of self‐referred race classification in Brazil,17 we were able to observe significant differences regarding the prevalence of CAC in relation to race in our sample (P < 0.0001).
Percentile Distribution
We derived observed percentiles for CAC score regarding age and sex through the analytical approach used by McClelland et al for the MESA study population.11 The sex‐specific CAC cutoff points for percentiles are shown in Table 2. It is possible to compare the different percentiles obtained for the ELSA‐Brasil sample, as well as the ones obtained for other commonly used reference samples. Interestingly, on a visual inspection, the ELSA‐Brasil derived percentiles look similar to the ones described by the MESA study for Hispanic individuals, especially for women. In Figure 2, we present 3 different percentile curves as a function of age in men and women. In Table 3, we present the point estimative for different percentiles according to ethnic group.
Table 2.
ELSA‐Brasil and MESA Percentiles
| Women, n | Men, n | |||||||
|---|---|---|---|---|---|---|---|---|
| Age, y | Age, y | |||||||
| 35–43 | 44–54 | 55–64 | 65–74 | 35–43 | 44–54 | 55–64 | 65–74 | |
| ELSA‐Brasil Percentiles | ||||||||
| 25th | 0 | 0 | 0 | 1 | 0 | 0 | 0 | 2 |
| 50th | 0 | 0 | 0 | 16 | 0 | 0 | 27 | 17 |
| 75th | 0 | 0 | 17 | 40 | 1 | 1 | 85 | 88 |
| 90th | 0 | 7 | 103 | 157 | 35 | 35 | 358 | 297 |
| 95th | 0 | 18 | 235 | 371 | 138 | 106 | 653 | 536 |
| n | 427 | 895 | 502 | 138 | 408 | 729 | 381 | 136 |
| MESA White Percentiles | ||||||||
| 25th | 0 | 0 | 0 | — | 0 | 0 | 21 | |
| 50th | 0 | 0 | 13 | — | 0 | 28 | 145 | |
| 75th | 0 | 16 | 119 | — | 22 | 155 | 540 | |
| 90th | 8 | 102 | 391 | — | 110 | 452 | 1345 | |
| 95th | 31 | 209 | 674 | — | 207 | 743 | 2271 | |
| n | 379 | 356 | 379 | — | 321 | 325 | 375 | |
| MESA Black Percentiles | ||||||||
| 25th | 0 | 0 | 0 | — | 0 | 0 | 0 | |
| 50th | 0 | 0 | 0 | — | 0 | 0 | 32 | |
| 75th | 0 | 5 | 77 | — | 2 | 40 | 191 | |
| 90th | 9 | 74 | 310 | — | 45 | 173 | 575 | |
| 95th | 38 | 173 | 561 | — | 105 | 318 | 945 | |
| n | 274 | 241 | 278 | — | 214 | 192 | 206 | |
| MESA Hispanic Percentiles | ||||||||
| 25th | 0 | 0 | 0 | 0 | 0 | 0 | 0 | 140 |
| 50th | 0 | 0 | 0 | 43 | 0 | 2 | 57 | 335 |
| 75th | 0 | 0 | 31 | 154 | 1 | 53 | 273 | 1230 |
| 90th | 3 | 29 | 123 | 343 | 29 | 227 | 673 | 2102 |
| 95th | 5 | 39 | 270 | 343 | 53 | 353 | 2508 | 2808 |
| n | 406 | 549 | 353 | 201 | 631 | 536 | 265 | 157 |
Abbreviations: ELSA‐Brasil, Brazilian Longitudinal Study of Adult Health; MESA, Multi‐Ethnic Study of Atherosclerosis.
Table 3.
Percentiles ELSA‐Brasil by Ethnicity
| Black, n | Brown, n | White, n | ||||||||||
|---|---|---|---|---|---|---|---|---|---|---|---|---|
| Age, y | Age, y | Age, y | ||||||||||
| 35–44 | 45–54 | 55–64 | 65–74 | 34–44 | 45–53 | 55–63 | 64–74 | 34–44 | 45–53 | 55–63 | 64–74 | |
| 25th | 0 | 0 | 0 | 6 | 0 | 0 | 0 | 21 | 0 | 0 | 0 | 18 |
| 50th | 3 | 2 | 1 | 14 | 3 | 3 | 1 | 17 | 4 | 2 | 5 | 32 |
| 75th | 10 | 21 | 46 | 56 | 14 | 39 | 54 | 115 | 16 | 10 | 69 | 171 |
| 90th | 12 | 41 | 237 | 211 | 16 | 75 | 187 | 283 | 9 | 35 | 293 | 563 |
| 95th | 32 | 98 | 509 | 376 | 138 | 106 | 653 | 536 | 9 | 101 | 507 | 1001 |
| n | 121 | 252 | 108 | 22 | 217 | 416 | 168 | 22 | 497 | 956 | 607 | 230 |
Abbreviations: ELSA‐Brasil, Brazilian Longitudinal Study of Adult Health.
Finally, we have explored the correlation structure between the ELSA‐Brasil–derived percentiles and the MESA‐derived percentiles for the studied population. Figure 2C presents the correlation between the 2 derived percentiles for both men and women, respectively. As can be observed, for a given CAC score, CAC percentiles tend to be lower in ELSA compared with MESA for men, and higher in ELSA compared with MESA for women.
Discussion
Our most important results are as follows: (1) in normal individuals (ie, no self‐reported CVD or DM) from the ELSA‐Brasil population, we did observe significant differences in CAC amounts according to self‐referred ethnicity; (2) as expected, a significant trend regarding increased CAC score and increased age was observed; (3) similar to other populations, there is a significant difference regarding the prevalence or amount of calcium between men and women; (4) low‐risk individuals from the ELSA‐Brasil population present with significantly lower calcium amounts and/or prevalence than other low‐risk individuals from worldwide populations, adjusted for age and sex; and (5) using MESA‐derived percentiles in the Brazilian population may lead to overestimating the relative CAC burden in men and underestimating the relative CAC burden in women.
As for the ethnicity issue, here we present the description of the prevalence and amount of calcium in a large admixed population. Different from other studies involving multiethnic populations, the Brazilian population has not only intrapopulational ethnic diversity, but also intraindividual ancestry components.18 The differences observed when analyzing the relative effect of ethnicity regarding CAC prevalence and calcium amount should be observed through this scenario. In our ethnic classification, we have used self‐referred race/color. It is known that the use of self‐referred ethnicity in the Brazilian population does not recapitulate biological ancestry information.17 In this regard, it is surprising that we could still observe a very clear relationship between ethnicity and CAC. Of note, our data may not completely apply to studies involving genetic ancestry, which may in fact have different estimates associated with ethnic‐specific increased prevalence of CAC.
The defined percentiles according to age and sex for Brazilian individuals are different from those defined for the MESA study, in both men and women—interestingly, in different directions. In fact, using MESA‐derived percentiles leads to underestimation of relative CAC burden in women and overestimation in men. Other studies in the US population presented similar results. Hoffmann et al, analyzing data from the Framingham Heart Study, observed an overall prevalence of CAC of 43% (52.9% in men and 32% in women).19 Previous clues from this difference in the Brazilian population have been observed. Santos et al, studying a sample of convenience of 2251 Brazilian individuals, observed a significantly lower amount and prevalence of CAC in Brazilian individuals as compared with US individuals.20
One interesting consequence of our data is that by using MESA‐derived percentiles in individuals from the Brazilian population, one may erroneously interpret and/or stratify cardiovascular risk in both men and women. This should be viewed in the light of recent data from the MESA study which established that using absolute CAC in standard groups performed better than age‐, sex‐, and race/ethnicity‐specific percentiles in terms of model fit and discrimination for predicting incident cardiovascular events.21 In our data, the use of ELSA‐Brasil–derived percentiles would significantly increase the number of “at risk” individuals, whether in men or women. It remains to be established whether, in a population with “lower” CAC prevalence, this is true and can reclassify individuals in relation to their observed incidence of cardiovascular events.
Conclusion
In the ELSA‐Brasil study, significant differences in CAC according to sex, age, and race were noted. Adjusted for age and sex, low‐risk individuals from the Brazilian population present with significantly lower CAC prevalence and burden compared with low‐risk individuals in other cohorts, such as MESA. Using United States–derived percentiles in Brazilian individuals may lead to overestimating relative CAC burden in men and underestimating relative CAC burden in women.
Supporting information
Supplemental table 1: Demographic distribution according to CAC score strata
Supplemental Figure 1: Baseline Characteristics of the studied sample
Acknowledgments
The authors thank the 4546 ELSA‐Brasil participants who voluntarily agreed to undergo examination and the leadership of University Hospital for assigning CT equipment for use in this research.
The ELSA‐Brasil baseline study was supported by the Brazilian Ministry of Health (Science and Technology Department) and the Brazilian Ministry of Science and Technology (Financiadora de Estudos e Projetos and CNPq National Research Council; grants 01 06 0010.00 RS, 01 06 0212.00 BA, 01 06 0300.00 ES, 01 06 0278.00 MG, 01 06 0115.00 SP, and 01 06 0071.00 RJ). The ancillary ELSA‐Brasil CAC was funded by Fundação de Amparo à Pesquisa do Estado de São Paulo (FAPESP 2011/12256‐4). Drs. Bensenor and Lotufo are the recipients of an established investigator award from CNPq, Brasilia, Brazil. Dr. Lotufo received grants from GlaxoSmithKline and Takeda to enroll participants for clinical trials addressing acute coronary syndrome and atrial fibrillation, respectively.
The authors have no other funding, financial relationships, or conflicts of interest to disclose.
References
- 1. Pletcher MJ, Sibley CT, Pignone M, et al. Interpretation of the coronary artery calcium score in combination with conventional cardiovascular risk factors: the Multi‐Ethnic Study of Atherosclerosis (MESA). Circulation. 2013;128:1076–1084. [DOI] [PMC free article] [PubMed] [Google Scholar]
- 2. Polonsky TS, Blumenthal RS, Greenland P. Coronary artery calcium score. JAMA. 2014;312:837–838. [DOI] [PubMed] [Google Scholar]
- 3. Rumberger JA, Schwartz RS, Simons DB, et al. Relation of coronary calcium determined by electron beam computed tomography and lumen narrowing determined by autopsy. Am J Cardiol. 1994;73:1169–1173. [DOI] [PubMed] [Google Scholar]
- 4. Otton JM, Yu CY, McCrohon J, et al. Accuracy and clinical outcomes of computed tomography coronary angiography in the presence of a high coronary calcium score. Heart Lung Circ. 2013;22:980–986. [DOI] [PubMed] [Google Scholar]
- 5. Ahn SJ, Kang DK, Sun JS, et al. Accuracy and predictive value of coronary computed tomography angiography for the detection of obstructive coronary heart disease in patients with an Agatston calcium score above 400. J Comput Assist Tomogr. 2013;37:387–394. [DOI] [PubMed] [Google Scholar]
- 6. Tota‐Maharaj R, Blaha MJ, Blankstein R, et al. Association of coronary artery calcium and coronary heart disease events in young and elderly participants in the Multi‐Ethnic Study of Atherosclerosis: a secondary analysis of a prospective, population‐based cohort. Mayo Clin Proc. 2014;89:1350–1359. [DOI] [PMC free article] [PubMed] [Google Scholar]
- 7. Bischoff B, Kantert C, Meyer T, et al. Cardiovascular risk assessment based on the quantification of coronary calcium in contrast‐enhanced coronary computed tomography angiography. Eur Heart J Cardiovasc Imaging. 2011;13:468–475. [DOI] [PubMed] [Google Scholar]
- 8. Tota‐Maharaj R, Blaha MJ, McEvoy JW, et al. Coronary artery calcium for the prediction of mortality in young adults <45 years old and elderly adults >75 years old. Eur Heart J. 2012;33:2955–2962. [DOI] [PubMed] [Google Scholar]
- 9. Mitchell TL, Pippin JJ, Devers SM, et al. Age‐ and sex‐based nomograms from coronary artery calcium scores as determined by electron beam computed tomography. Am J Cardiol. 2001;87:453–456, A6. [DOI] [PubMed] [Google Scholar]
- 10. Nasir K, Raggi P, Rumberger JA, et al. Coronary artery calcium volume scores on electron beam tomography in 12 936 asymptomatic adults. Am J Cardiol. 2004;93:1146–1149. [DOI] [PubMed] [Google Scholar]
- 11. McClelland RL, Chung H, Detrano R, et al. Distribution of coronary artery calcium by race, gender, and age: results from the Multi‐Ethnic Study of Atherosclerosis (MESA). Circulation. 2006;113:30–37. [DOI] [PubMed] [Google Scholar]
- 12. Lee TC, O'Malley PG, Feuerstein I, et al. The prevalence and severity of coronary artery calcification on coronary artery computed tomography in black and white subjects. J Am Coll Cardiol. 2003;41:39–44. [DOI] [PubMed] [Google Scholar]
- 13. Doherty TM, Tang W, Detrano RC. Racial differences in the significance of coronary calcium in asymptomatic black and white subjects with coronary risk factors. J Am Coll Cardiol. 1999;34:787–794. [DOI] [PubMed] [Google Scholar]
- 14. Bild DE, Detrano R, Peterson D, et al. Ethnic differences in coronary calcification: the Multi‐Ethnic Study of Atherosclerosis (MESA). Circulation. 2005;111:1313–1320. [DOI] [PubMed] [Google Scholar]
- 15. Erbel R, Delaney JA, Lehmann N, et al. Signs of subclinical coronary atherosclerosis in relation to risk factor distribution in the Multi‐Ethnic Study of Atherosclerosis (MESA) and the Heinz Nixdorf Recall Study (HNR). Eur Heart J. 2008;29:2782–2791. [DOI] [PMC free article] [PubMed] [Google Scholar]
- 16. Aquino EM, Barreto SM, Bensenor IM, et al. Brazilian Longitudinal Study of Adult Health (ELSA‐Brasil): objectives and design. Am J Epidemiol. 2012;175:315–324. [DOI] [PubMed] [Google Scholar]
- 17. Cardena MM, Ribeiro‐Dos‐Santos A, Santos S, et al. Assessment of the relationship between self‐declared ethnicity, mitochondrial haplogroups and genomic ancestry in Brazilian individuals. PLoS One. 2013;8:e62005. [DOI] [PMC free article] [PubMed] [Google Scholar]
- 18. Giolo SR, Soler JM, Greenway SC, et al. Brazilian urban population genetic structure reveals a high degree of admixture. Eur J Hum Genet. 2011;20:111–116. [DOI] [PMC free article] [PubMed] [Google Scholar]
- 19. Hoffmann U, Massaro JM, Fox CS, et al. Defining normal distributions of coronary artery calcium in women and men (from the Framingham Heart Study). Am J Cardiol. 2008;102:1136–1141. [DOI] [PMC free article] [PubMed] [Google Scholar]
- 20. Santos RD, Nasir K, Rumberger JA, et al. Difference in atherosclerosis burden in different nations and continents assessed by coronary artery calcium. Atherosclerosis. 2006;187:378–384. [DOI] [PubMed] [Google Scholar]
- 21. Budoff MJ, Nasir K, McClelland RL, et al. Coronary calcium predicts events better with absolute calcium scores than age‐sex‐race/ethnicity percentiles: MESA (Multi‐Ethnic Study of Atherosclerosis) [published correction appears in J Am Coll Cardiol. 2009;53:1474]. J Am Coll Cardiol. 2009;53:345–352. [DOI] [PMC free article] [PubMed] [Google Scholar]
Associated Data
This section collects any data citations, data availability statements, or supplementary materials included in this article.
Supplementary Materials
Supplemental table 1: Demographic distribution according to CAC score strata
Supplemental Figure 1: Baseline Characteristics of the studied sample