Abstract
We demonstrate near-infrared autofluorescence (NIRAF) imaging of retinal pigment epithelial (RPE) cells in vivo in healthy volunteers and patients using a 757 nm excitation source in adaptive optics scanning laser ophthalmoscopy (AOSLO). NIRAF excited at 757 nm and collected in an emission band from 778 to 810 nm produced a robust NIRAF signal, presumably arising from melanin, and revealed the typical hexagonal mosaic of RPE cells at most eccentricities imaged within the macula of normal eyes. Several patterns of altered NIRAF structure were seen in patients, including disruption of the NIRAF over a drusen, diffuse hyper NIRAF signal with loss of individual cell delineation in a case of non-neovascular age-related macular degeneration (AMD), and increased visibility of the RPE mosaic under an area showing loss of photoreceptors. In some participants, a superposed cone mosaic was clearly visible in the fluorescence channel at eccentricities between 2 and 6° from the fovea. This was reproducible in these participants and existed despite the use of emission filters with an optical attenuation density of 12 at the excitation wavelength, minimizing the possibility that this was due to bleed through of the excitation light. This cone signal may be a consequence of cone waveguiding on either the ingoing excitation light and/or the outgoing NIRAF emitted by fluorophores within the RPE and/or choroid and warrants further investigation. NIRAF imaging at 757 nm offers efficient signal excitation and detection, revealing structural alterations in retinal disease with good contrast and shows promise as a tool for monitoring future therapies at the level of single RPE cells.
1. Introduction
Fundus autofluorescence imaging is routinely performed in clinical ophthalmology with scanning laser ophthalmoscopy (SLO) [1] and is an important tool for evaluating disease status and monitoring progression in pathologies affecting the retinal pigment epithelium (RPE) and photoreceptors (PRs), hence applicable in various retinal degenerations such as age-related macular degeneration (AMD). The RPE may be affected early on in disease, before damage to photoreceptors and vision loss has occurred, so precise imaging of the RPE is desirable to detect pathology at an early stage where treatment and management techniques may be most effective. SLO, with its lateral resolution of 10 µm, can view a large field of the fundus but cannot resolve individual cells.
Short wavelength autofluorescence (SWAF) and fluorescein for retinal vasculature angiography are excited at visible wavelengths, usually using blue (488 nm) or green (532 nm) light. A drawback of using these wavelengths is that they are uncomfortably bright, even at light levels considered to be safe, and may potentially be harmful to diseased retinas that may be at greater risk for light induced damage [2]. Near-infrared autofluorescence (NIRAF) has typically been excited at ~790 nm. This wavelength has been utilized for NIRAF due to its convenience as it has been built into commercial SLO systems for reflectance imaging and to excite indocyanine green (ICG). The intrinsic NIRAF signal is thought to be approximately 60 times lower than SWAF [4], so detecting NIRAF is challenging. In addition, SWAF and NIRAF do not reveal the same fluorophore [3–6].
The principle fluorophore responsible for the autofluorescence (AF) signal at short wavelengths is lipofuscin, a material that accumulates in RPE cells as a consequence of the visual cycle [3–6]. Lipofuscin accumulates over a person’s lifetime [7,8] and thus is expected to correlate with age. At near-infrared (NIR) wavelengths, melanin in RPE cells is thought to be the principle contributor to the AF signal, along with some choroidal melanin, and possibly some lipofuscin [4]. Melanin is expected to decrease with age [7]. Concentrations of intrinsic RPE fluorophores follow an inverse relation across the macula with melanin peaking in the fovea and lipofuscin in the periphery. In addition, melanolipofuscin forms with age [9] in quantities closer to that of lipofuscin than that of melanin. This means that both SWAF and NIRAF may potentially be generated from the same structures, containing both fluorophores. Lipofuscin itself is not a single fluorophore with narrow excitation and emission bands but is rather an array of fluorophores of overlapping broad excitation and emission bands, stretching from blue-green excitation producing green-red emission, to green-red excitation emitting with a red shifted peak [10]. As a unique broadband absorber, the excitation and emission spectra of ocular melanin and its sub-types (eumelanin, pheomelanin) are not well characterized, particularly in the near-infrared. For the purposes of monitoring pathology, lipofuscin has been the fluorophore of most interest as regional autofluorescence thought to be generated by lipofuscin has been shown to often be correlated with areas of photoreceptor death [11]. However, NIRAF has garnered increased interest recently as it is comfortable for patients and provides complementary information [5]. In addition, considering recent findings regarding the high proportion of melanolipofuscin in aging eyes [9], the NIRAF signal may serve as a surrogate for SWAF and biomarker of RPE status in diseased eyes.
Cellular level resolution imaging of the living retina has typically required the use of adaptive optics (AO) [12]. AO ophthalmoscopy (AOO) usually uses a closed-loop wavefront control to produce near diffraction-limited images (~2µm lateral resolution) using the full 6-9 mm pupil size available in the dilated human eye [13]. This allows individual photoreceptor cells to be resolved in the living retina, along with other microscopic structures such as the microvasculature and individual nerve fiber bundles. Imaging the other cell layers such as the RPE is more challenging as their weak contrast is masked by the bright reflections from the nerve fiber, vascular and photoreceptor layers. However, several imaging techniques have met this challenge in order to successfully reveal the RPE layer. Optical coherence tomography (OCT) is routinely used to reveal all the retinal layers in cross-section, including a particularly bright signal at the RPE layer due to the absorption/scattering properties of melanin in the cells of the RPE. However, despite exquisite axial resolution, commercially available OCT without AO lacks sufficient lateral resolution to resolve individual cells [14].
Individual RPE cells can be revealed in patients with reflectance AOO when the overlying photoreceptors are lost, but this is rare and is indicative of extensive, lasting damage, at a stage too late for many types of therapy [15]. RPE cells can be imaged using detection techniques such as dark-field AO, but only in some subjects and usually only near the fovea [17]; the reason for this remains unclear but it may be related to differences in the scattering properties of the photoreceptor layer outside of the cone-dominated macula [17]. Individual RPE cells have also be detected using AO-OCT [18,19]. The most recent report using this technique suggests that dynamic imaging is required and that RPE contrast may be enhanced by the natural movement, over minutes-long timescales, of organelles within individual cells [18]. However, to record this signal in vivo, long video sequences (90 minutes) on subjects with excellent fixation are required, so patient imaging is not yet feasible [18].
Adaptive optics scanning laser ophthalmoscopy (AOSLO) [20] has been used to image SWAF [21,22] and NIRAF [16,23,24] in healthy volunteers and reveals the individual cells of the RPE mosaic in vivo. NIRAF has also been used to image the RPE mosaic after administration of ICG [25]. These previous NIRAF techniques used wavelengths adopted from ICG imaging (~790 nm excitation, ~800-850 nm emission). The absorption spectrum of melanin shows a steady decrease from the visible toward the infrared and by 790 nm absorption is relatively low [4]; this fact, along with a recently published report showing relatively high noise levels and low contrast images when using these wavelengths [16], suggests that these previous implementations may not have been optimized. Here, we set out to improve AOSLO for NIRAF imaging of RPE cells in vivo. We implemented NIRAF in AOSLO with excitation at 757 nm, to seek to improve in signal strength, image quality and robustness over previous studies. This shift allowed us to move the emission band for NIRAF detection to shorter wavelengths where our detectors have slightly improved sensitivity, in addition to providing access to an area of the melanin absorption spectrum where absorption/excitation should be greater compared to longer wavelengths [4]. We validated this new NIRAF AOSLO implementation by imaging both normal eyes and those of several patients with RPE abnormalities.
2. Methods
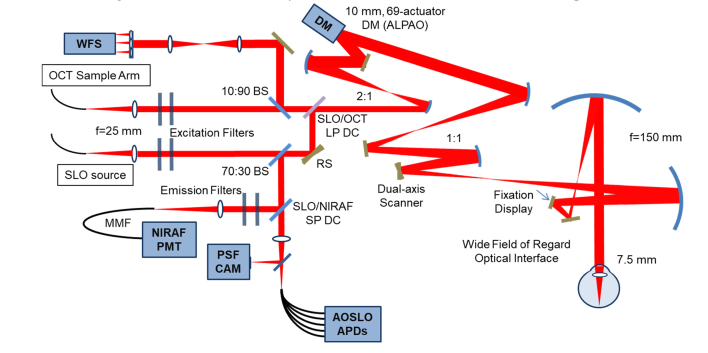
We modified the multimodal adaptive optics retinal imager (MAORI) (Physical Sciences, Inc., Andover, MA, USA) at the Quinze Vingts Hospital in Paris, to add in a fluorescence detection channel optimized for the weak NIRAF signal (Fig. 1). This modification of the MAORI optical system added a series of dichroic beamsplitters and filters at suitable wavelengths along with a highly sensitive detector, and benefitted from the use of custom-developed image registration software for data processing [26].
Fig. 1.
System diagram. WFS, wavefront sensor, DM, deformable mirror, NIRAF PMT, near infrared photomultiplier tube, PSF CAM, point spread function camera, AOSLO APDs, adaptive optics scanning laser ophthalmoscope avalanche photodiodes, OCT, optical coherence tomography, SLO, scanning laser ophthalmoscope, BS, beamsplitter, SLO/OCT LP DC, scanning laser ophthalmoscope/optical coherence tomography long pass dichroic, SLO/NIRAF SP DC, scanning laser ophthalmoscope near infrared short pass dichroic, RS resonant scanner, MMF, multimode fiber.
2.1 Setup
The MAORI system (Fig. 1) has been described in detail elsewhere [13]. Briefly, the system provides simultaneous adaptive optics correction for both an AOSLO and a spectral domain AO-OCT subsystem. An additional simultaneous wide-field SLO channel is used to target the high-resolution imaging to specific regions of interest. The AOSLO system includes a confocal reflectance channel and four offset apertures for non-confocal imaging; optical fibers serve as apertures and relay the light to avalanche photodiode (APD) detectors. A 69-actuator deformable mirror (DM69, Alpao, France) in a 10 Hz closed loop with a Shack-Hartmann wavefront sensor corrects the wavefront aberrations. Images are acquired at 24 frames per second (fps). The three imaging sub-systems each have an independent light source: 940 nm for the wide-field SLO; 757 nm (Exalos SLD; 757 nm center, 20nm full-width at half maximum (FWHM)) for the AOSLO; and 840 nm for the wavefront sensing beacon and OCT. We modified the system to use the 757 nm beam for NIRAF excitation and added appropriate filters (see below; Semrock, USA) and dichroic mirrors to add in a new detection arm with a photomultiplier tube (PMT) (H7422-50, Hamamatsu, Japan). The PMT was chosen for NIRAF, rather than the APD detectors used for the other channels, because the high gain, low noise performance of the PMT is key in this “photon counting regime” low light application, where the AF signal is much weaker than the scattered/reflectance signal from the photoreceptors.
The fluorescence channel detects very low light levels and is therefore highly sensitive to stray light and detector alignment. Scattered light from other sources is minimized by doubling up on bandpass filters in front of the sources (FF01-747/33, Semrock, (excitation path on AOSLO source), FF01-888/131, Semrock, (excitation path on beacon), at 0° incidence, doubled) and the detector (FF01-794/32, Semrock, (emission path in front of PMT), at 0° incidence, doubled), providing an optical attenuation density of 12 at the excitation wavelength to obtain a high rejection rate of stray light. To combine paths, we used dichroic filters/mirrors as follows: on the AO beacon, we used a dichroic filter (Chroma 750dcxr at 17° angle of incidence (AOI)), which acts as a longpass filter cutting at 812nm, which in combination with the beacon excitation filters which cut hard below ~825 nm guaranteed that none of the beacon light could bleed through to the NIRAF channel. The SLO/NIRAF beams dichroic (Chroma zt780sp-UF3, at ~45° AOI, shortpass) was a 1” x 3 mm ultraflat substrate which reflected the NIRAF signal towards the collimator/multimode fiber and PMT. Detector alignment was fine-tuned by manually adjusting the x-y position of the fluorescence detection channel’s confocal pinhole for each subject, at each imaging position (the confocal pinhole is in fact an optical fiber that collects the light to take it to the PMT, whose core fiber diameter is equal to pinhole size). As the Airy disk diameter of the system is 48 μm, a confocal pinhole of 50 μm was found to provide the optimal tradeoff between optical sectioning and photon collection [27]. A smaller pinhole of 25 μm produced noisy images, in which any improvement in optical sectioning that the smaller pinhole may provide was difficult to appreciate due to the increased noise. We typically acquired 800 frames at 24 fps, requiring 30 seconds to record each movie. In comparison to other NIRAF AO imaging [16,23–25], our excitation wavelength of 757 nm should give higher melanin absorption compared to the longer wavelength excitation light near 790 nm that they used. We also used a shorter wavelength emission band compared to previous studies, 778 nm to 810 nm versus 800 nm to 830 nm in [16,23–25]. Light levels were 0.75 mW for the 2° long line scan 840 nm beacon and 0.9 mW for the 2° × 2° field 757 nm AOSLO beam, whose overlapping combination, when considering the fraction of the ANSI maximum permissible exposure (MPE) of each source, represents 80% of the total MPE as defined by ANSI [28]. The 940 nm wide-field SLO was not used simultaneously with the other beams for the experiments in this paper. For the AOSLO channel, our power level is at only 50% of the MPE, though this lies within the range of the levels shown by Masella to cause NIRAF reduction in primate [29].
2.2 Image processing and analysis
Each individual frame captured in the fluorescence channel resembles dark noise, i.e. sparse pixels that appear as white on a black background. Several hundred frames must be averaged to reveal the final image, requiring co-registration of the weak AF signal with the simultaneous, coincident, clear image of the photoreceptors acquired in the confocal channel. We used a strip-based registration algorithm described previously [26] to perform the co-registration, after Gray et al. [30]. Some image analyses, including discrete Fourier transforms, were computed in ImageJ (NIH, Bethesda, MD, USA). Average cell profiles were computed using custom scripts in MATLAB (The MathWorks, Inc., Natick, MA), utilizing elements of the Image Processing Toolbox. Cone positions were semi-automatically determined using previously described methods [31] and average cell profiles were computed by taking the center of each cone position as the center of a new sub-image. All sub-images fully contained within the image were then averaged to generate the average cell profiles.
2.3 Subjects
The research was carried out according to the Declaration of Helsinki and approved by our local ethics committee (CPP Ile de France 5 #16145). Informed consent was obtained for each volunteer. We imaged 4 volunteers considered healthy by routine fundus imaging on multiple occasions (subject #1: 25 year old female, subject #2: 24 year old male, subject #3: 38 year old female, subject #4: 53 year old male,), and 3 patients, all with natural lenses: a 58 year old male with drusen in an otherwise normal retina, a 31 year old male with radiation retinopathy, and an 80 year old female with non neovascular or “dry” AMD with geographic atrophy.
3. Results
3.1 Imaging in healthy volunteers
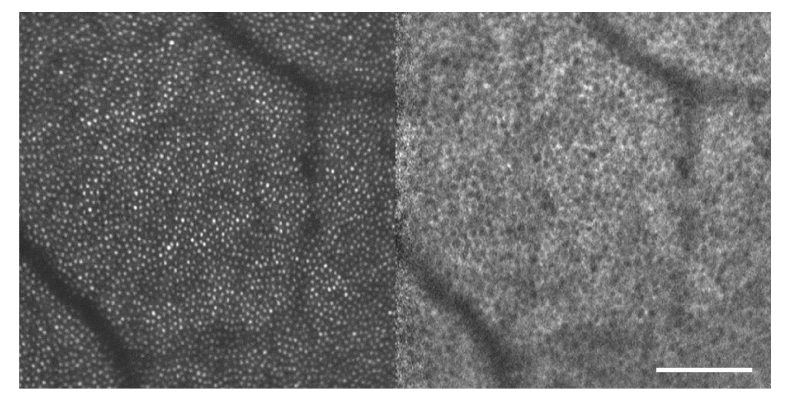
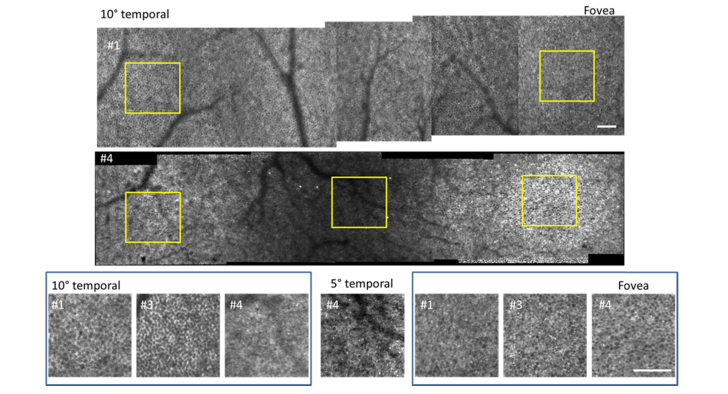
The characteristic appearance of the RPE cell mosaic in fluorescence AOSLO, with cells appearing with a hypo-AF center and hyper-AF surround, was revealed with robust signal strength in most locations imaged in normal eyes (Fig. 2). We imaged the RPE mosaic in contiguous overlapping fields in 4 normal subjects from the fovea out to an eccentricity of 10° temporal (Fig. 3). We were able at all locations in young subjects #1 and #2 to obtain clear images of the RPE mosaic, though at lower contrast in subject #2 at the periphery. On older subjects #3 and #4, the RPE mosaic was generally not as highly contrasted as in the younger eyes. In subjects #1 and #3, we obtained a superposition of the RPE mosaic with a mosaic resembling the cone photoreceptors at some locations (Figs. 3, 4). In these cases, the RPE mosaic was clearly visible outside the fovea but became confused with the cone mosaic between 2° and 6°. For subject #4, the RPE mosaic was clearly resolved from the fovea to 3° temporal. This was followed by a reduced NIRAF signal of low contrast in an annular region around the fovea from 3 to 5°, in agreement with previous findings from SWAF [24]. Interestingly, this area contained a few very bright hyper-AF cells (Fig. 3; middle row; central region). Beyond 5°, NIRAF showed diffuse fluorescence with some RPE cells appearing as the dark centered, bright contoured hexagonal mosaic seen elsewhere in normal eyes, but in other areas resembled bright hexagons with fine dark contours suggesting a different distribution of the fluorophores within the cells.
Fig. 2.
Photoreceptors in reflectance (left) and RPE cells in NIRAF (right) in healthy volunteer #1; location is 10° temporal; scale bar is 100 µm.
Fig. 3.
Variation in appearance of RPE in healthy volunteers. Top and center row: mosaics from 10° temporal to the fovea in subjects #1 and #4. Note the dimmed ring containing a few hyper AF cells from 3 to 5° in subject #4. Bottom row: zooms on 10° temporal (left box), 5° temporal (center panel) and fovea (right box) of subjects #1, #3 and #4; inset yellow squares in images above denote locations shown for subjects #1 and #4. Contrast and brightness have been altered in the zoomed panel on the 5° temporal location in subject #4 as this region of the retina gave dimmer images than elsewhere. Note the diffuse fluorescence with hyper AF cells in #4 at 10°. Scale bars are 100µm.
Fig. 4.
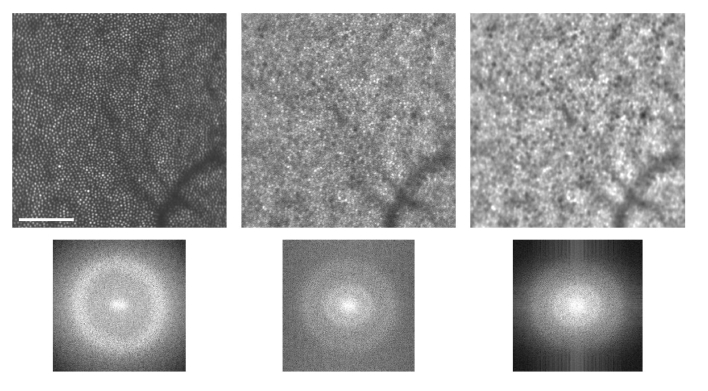
The discrete Fourier transform of the reflectance (top left) and NIRAF (top center) images produces Yellott’s rings in the power spectrum corresponding to the modal frequencies of the photoreceptor and RPE spacing (bottom). The NIRAF power spectrum contains peaks in two frequency bands corresponding to that of the photoreceptors (outer ring) and that of the RPE (inner ring). Applying a bandpass filter can suppress the cone signal to enhance visibility of the RPE mosaic (right). Scale bar is 100 µm.
After the method of Masella et al. [29], NIRAF reduction was measured by imaging with commercial SD-OCT (Spectralis HRAOCT, Heidelberg Engineering GmBH, Heidelberg, Germany) in ICG acquisition mode (787 nm excitation) in subject #3 and showed approximately 8% reduction in average NIRAF signal intensity in the zones covered by AO imaging compared to those that had not been exposed, 3 weeks after AO imaging. No changes to other retinal features were seen in SLO reflectance mode with the Spectralis. This is comparable with the 4-12% NIRAF reductions seen in [29], also for exposures well below the MPE.
3.2 Measures taken to remove cones superposed with the RPE mosaic
On noticing an appearance of cones in the NIRAF signal during our pilot testing of this setup (at some locations, on some subjects) we took measures to attempt to optically eliminate it. First, we sought to eliminate any reflectance signal from cones that may be reaching the PMT at the excitation wavelength by adding an extra bandpass filter in front of the NIRAF detector to increase the rejection rate from an initial optical density of 7 in our pilot testing up to 14 (used for all images shown here, as stated in the Methods). This addition produced no noticeable difference to the images.
To determine whether the cone signal varied with focus, through focus image stacks were acquired by adding defocus to the deformable mirror. This was tested with 1 and 0.5 Airy disk diameter detection pinholes. In all subjects, the best subjective RPE image contrast was coincident with subjective best focus on the PR layer, as the optical sectioning of our AOSLO [27] is larger than the RPE to photoreceptor distance [18], so that both are included in the same optical section. The photoreceptors appear “in focus” in the AOSLO over a considerable range due to the relatively wide optical section (with a 1 or 0.5 Airy disk diameter pinhole, we can expect around a 60 µm optical section [27] at 757 nm wavelength). In order to ensure best RPE focus for routine imaging, we therefore chose to image in the deepest focal plane that still showed bright photoreceptors (i.e. closest to the RPE, as opposed to closest to the external limiting membrane (ELM)). For both pinhole sizes, changing focus did not remove superposed cones in those subjects and locations where they were visible. With the 0.5 Airy disk diameter pinhole, images were noisier and dimmer, with increased contrast of the superposed cones and reduced visibility of the RPE. The 1 Airy disk diameter was selected for all subsequent imaging as it provided the optimal compromise between confocality, signal level and RPE contrast.
Finally, we tested dark versus light adapted retina on subject #1 after both 10 hours (overnight) and 1 hour (prior to imaging) of dark adaptation, and on subject #2 after 1 hour (prior to imaging) dark adaptation, to see if mobility of melanin from RPE cell cytoplasm into apical processes [32] was detectable and could explain the variable appearance of the PR mosaic on the NIRAF images (since the apical processes surround cones and may therefore follow a cone mosaic structure). Dark adaptation was performed using an adherent eye patch doubled over with a dark fabric blindfold. The light adapted condition was set to be the eye’s state under ambient conditions (normal daylight), without bleaching. No changes were detected between images obtained after light and dark adaptation under these conditions, though this could merit further exploration under various conditions of strict dark adaptation.
As the optical measures to remove the superposed cone signal were not successful, we also explored a computational approach. On analyzing the modal frequencies [33] (Yellott’s rings [34]) present in the reflectance and NIRAF images, we could identify the frequency corresponding to the cone spacing and suppress it with a bandpass filter in the Fourier domain; this improved visibility of the RPE mosaic as shown in Fig. 4.
3.3 Retinal diseases affecting the RPE
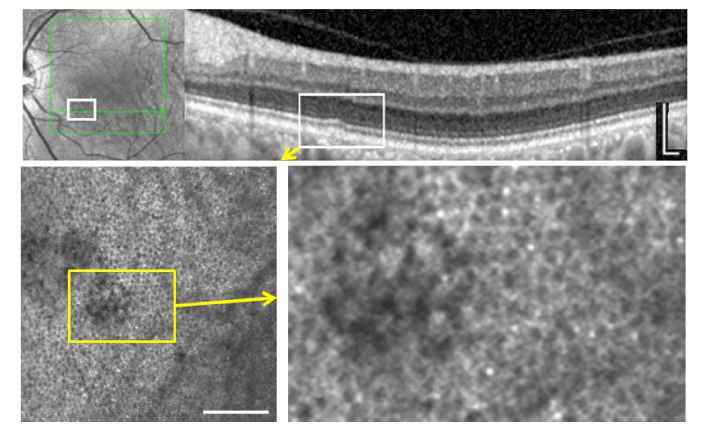
In a patient with a small drusen in an otherwise normal eye, the regular RPE mosaic was disturbed when observed with NIRAF (Fig. 5). In this area structures larger than normal RPE cells were seen with nonuniform, decreased autofluorescence across their surface. Some darker structures remained within this region but they appeared larger than the dark regions of adjacent RPE cells (which presumably correspond to the melanin-free nucleus of the cells [35]).
Fig. 5.
Small drusen. Top, IR SLO and OCT imaging. Bottom, NIRAF which shows local disruption of an otherwise normal RPE mosaic. Scale bars, 200 µm.
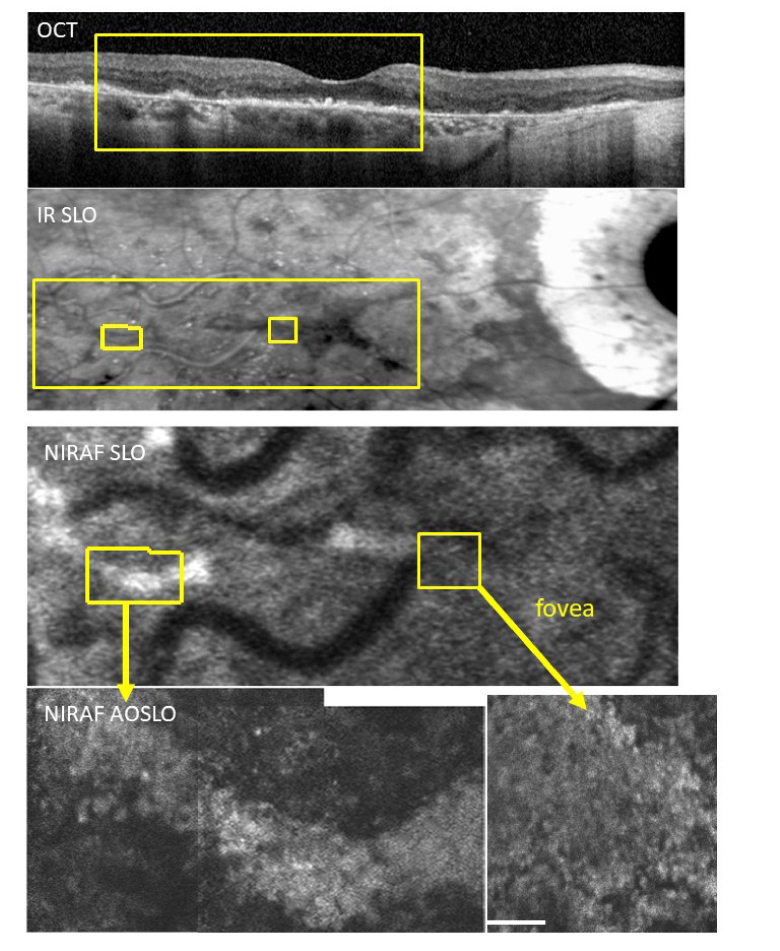
In a patient with non-neovascular AMD, areas with presumably intact RPE cells as judged from OCT showed a coarse granulation in NIRAF, without the central hypo-AF that is seen in the RPE mosaics on young healthy subjects (Fig. 6). Minute zones of NIRAF were also detected adjacent to atrophic areas. In the fovea, NIRAF was higher contrast in AOSLO than in conventional SLO, but the normal RPE cell mosaic was not visible.
Fig. 6.
Case of non-neovascular age-related macular degeneration with foveal sparing. From top to bottom, OCT, IR SLO, NIRAF SLO, and NIRAF-AOSLO. In the periphery (lower left) the contrast appears higher in NIRAF AOSLO, across a band of hyper-AF. In the fovea the NIRAF contrast in AOSLO (lower right) is higher than that in the NIRAF SLO image. This area showed no recognizable RPE mosaic but rather a diffuse fluorescence with some granularity. This is similar to what is observed in our oldest control (compare with #4, Fig. 2 zoom at 10° temporal). Scale bar is 100 µm.
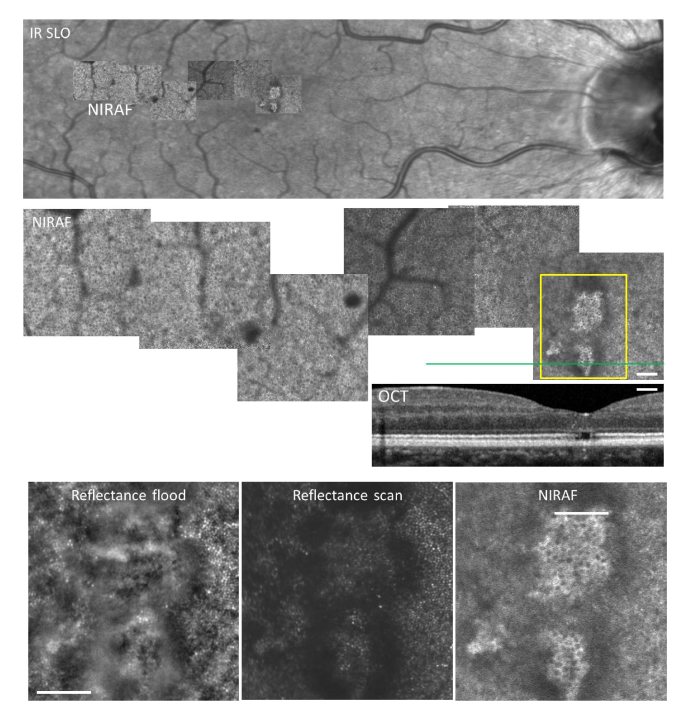
A patient with diabetic retinopathy showed hyper AF in the foveal zone underlying PR damage (Fig. 7), in an otherwise normal RPE mosaic. NIRAF contrast was much was higher in the fovea, possibly due to increased transmission of light due to the absence of photoreceptor outer segments.
Fig. 7.
Case of radiation retinopathy with sequelaes of macular edema that caused loss of foveal photoreceptors. Top, IR SLO image with overlaid NIRAF mosaic; center shows a zoom on the NIRAF AOSLO mosaic and corresponding OCT; bottom shows magnifications in the fovea in reflectance flood adaptive optics ophthalmoscopy, reflectance scan AOLSO and NIRAF AOSLO. Note by NIRAF AOSLO the visualization of the RPE mosaic within the area lacking outer segments. Note also the shadowing from microaneurysms in the top and center panel views. Scale bar, 200 µm.
3.4 Indocyanine Green (ICG)
We performed a preliminary attempt to image in a normal subject (#4) after injection of a typical dose of indocyanine green (ICG) fluorophore for angiography. Images were recorded before, immediately following, and 1 hour following, ICG injection. In contrast to the result shown in [25] at 790nm, we observed no change between these three cases, suggesting that at our wavelengths of excitation and detection, we are not sensitive to ICG, likely due to being at a shorter wavelength, too far from the excitation and emission peaks [26]. These preliminary tests should be followed with more detailed exploration.
3.5 RPE cell density
We measured RPE cell density in our subjects by measuring modal frequency [33]. For all normals combined in those where cells were visible, we measured an average of 25 cycles/degree, or 6250 cells/mm2 at the fovea, and 21 cycles/degree, or 4410 cells/mm2 at 10° temporal, which lie within the ranges reported in the literature [16,18,19,21,22,25,36].
4. Discussion
NIRAF excitation at 757 nm produced a robust signal in our emission band of 778–810 nm, permitting 30 second exposures to produce strip-registered average images with high contrast. The low sensitivity to the excitation beam allowed us to image without pupil dilation in all subjects. Though many factors influence image quality using autofluorescence techniques in AOSLO, such as excitation power and confocal pinhole size, compared to a recent report using wavelengths optimized for ICG imaging [16], shifting NIRAF in AOSLO to shorter wavelengths appears to provide similar image quality and may provide improved efficiency due to increased melanin absorption at 757 nm compared to longer wavelengths [4].
4.1 Superposed cone mosaic
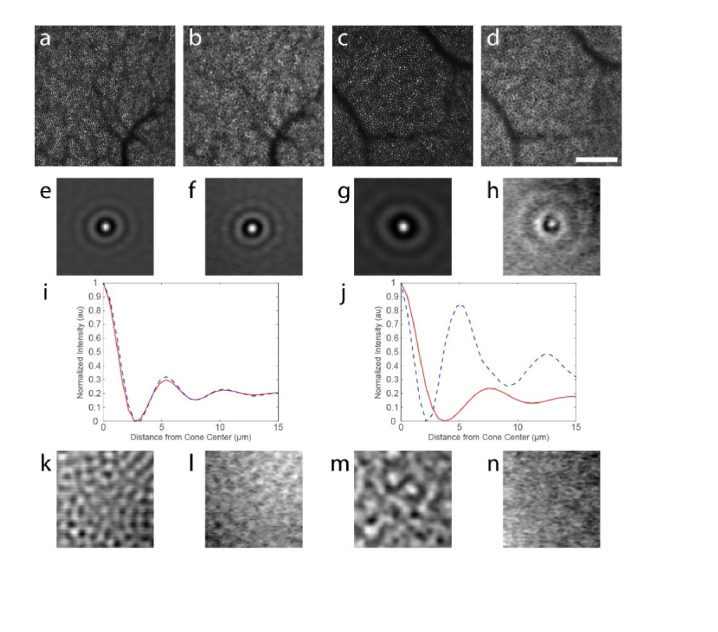
It remains unclear why cone structure is sometimes superposed with the RPE in NIRAF. Interestingly, although a cone signature is not clearly visible at all locations, careful analyses of the fluorescence structure suggest that the cone mosaic modulates the contrast of the NIRAF signal even in areas where the cones are not seen (Fig. 8). Using the cone positions from the reflectance image, we averaged all of the cones visible in an 800 × 800 pixel image at two eccentricities in the same normal participant (subject #1): one where the cone signal was clearly visible by eye (4 degrees; n = 6,142 cells) and another where it was not (10 degrees; n = 2,804 cells). This produced an average cone intensity profile for each image (Fig. 8(e) and 8(g)). When we applied this same procedure to the NIRAF images, again using the positions of the cones from the reflectance image, we also were able to identify a cone signature in each image (Fig. 8(f) and 8(h)), despite the fact that it is not visible by eye at the 10-degree eccentricity.
Fig. 8.
Average image intensity at cone locations demonstrates that a cone signature persists in the images even when it is not visible by eye. Cone positions in the reflectance images at 4 degrees (a) and 10 degrees (c) were used to compute average cone intensity profiles across a 30 x 30 µm area centered on each cone (e,g). When applied to the corresponding NIRAF images (b, d), signatures of the cones were also visible (f, h). Radial averages of the images shown in (e & f and g & h) are plotted in i and j, respectively (red lines are from the reflectance images and blue dashed lines are from the NIRAF images). These plots demonstrate that the cone signature is nearly identical in both images at 4 degrees but that the NIRAF signature is narrower than the cone intensity profile from the reflectance image at 10 degrees. Control images generated by using the transposed cone positions showed no cellular signatures in any image (k-n). Scale bar in (d) is 100 μm and applies to (a-d).
Radial averages were computed for each image and are compared for the two eccentricities in Fig. 8(i), 8(j). At four degrees, the radial averages are nearly identical (Fig. 8(i)). Not surprisingly, discordance between the radial average of the intensity profile of the two images was observed at 10 degrees (Fig. 8(j)). The first peak likely arises from cones situated on the margin of RPE cells in the image and may be narrowed somewhat compared to the cone profile from the reflectance image due to the topography of the cones, since at this eccentricity there are 2 or 3 cones across each RPE cell. Interestingly, the second peak in the radial average for the NIRAF image closely corresponds to the radius of the RPE cells, suggesting that many of the cones are centered on an RPE cell. This spatial arrangement would have the tendency to bring down the difference between the amplitude of the first and second peaks in the normalized radial average, which is what was observed. Control images generated by transposing the cone positions showed no cone structure in any of the images (Fig. 8(k)-8(n)).
The superposed cone mosaic phenomenon is probably related to the waveguiding properties of cones. Cones could modulate the fluorescence signal in two ways, when considering the effects of waveguiding on both the ingoing excitation light and the outgoing fluorescence. As the excitation light is waveguided by the cones to the photopigment discs in the tips of the outer segments, photons that are not absorbed by photopigment will emerge from the tips of the outer segments and be absorbed or scattered by the melanin granules in the RPE. This funneling of light by the cones may cause relatively more fluorescence excitation to occur at those positions beneath the tips of the outer segments of cones than at positions between the outer segment tips, causing an imprint of the cones to be visible in the RPE mosaic. It is also possible that the autofluorescence could be waveguided back through the cones. Though waveguiding in the backward direction appears unlikely for SWAF from lipofuscin [37], and indeed no Yellott’s ring at the spatial frequency of the photorecepetors appears in SWAF RPE images, it is possible that NIRAF could be more strongly coupled back into the cones and thus waveguided back out of the eye. It has been assumed that the light guided back out of the eye from the photoreceptors arises from scattering of light by melanin granules in the apical processes of the RPE cells close to the tips of the outer segments [38–40]. Thus, it would not be surprising if the light emerging from these granules from NIRAF might be coupled back into the cones in a similar way. We are pursuing future experiments that could provide further evidence to support this hypothesis.
A second possibility which was briefly explored in our study was the movement of the melanin pigment in light versus dark adapted conditions, which has previously been shown in amphibian [32], though not in mammals. If the pigment migrates from the base of the RPE cell cytoplasm into apical processes that surround cones on light stimulation, then the fluorescing structures might follow a cone pattern. We did not observe differences between light and dark adapted eyes within the limits of our capacity to provide effective dark adaptation and the limited number of subjects in this first exploratory study. This could benefit from more careful investigations in a future study.
Another possible explanation could be that there is an NIRAF signal coming from the cones themselves at 757 nm. NIRAF signal has up till now been presumed to be generated by melanin, but there may be other fluorophores active at this excitation wavelength, in the RPE but also in other retinal layers including, for example, choroidal melanin or a weak lipofuscin contribution, though these would not be expected to have a cone appearance. This possibility cannot be ruled out at this point but it seems unlikely.
Finally, it is possible that light fluorescing from the RPE/choroid might be acting as an illumination source for imaging the cones in transmission. This could potentially provide a low angle illumination source somewhat analogous to what is seen when the retina is illuminated with an annular illumination in some forms of ‘dark field’ imaging. In fact, a superposed cone mosaic is often seen when the RPE is imaged using dark field techniques [17]. However, this phenomenon may not be distinct from the effects of cone waveguiding on the outgoing light, as cone waveguiding may modulate the light emerging from the RPE no matter the source.
4.2 Imaging the RPE mosaic with NIRAF in diseased eyes
We observed that a variety of conditions may alter the visualization of the RPE mosaic with NIRAF in AOSLO, either increasing or decreasing cell contrast or blurring the RPE mosaic altogether. In patient 1, which showed a very small drusen, the appearance of the RPE mosaic was locally disrupted but surrounding RPE cells appeared normal. This is similar to what was observed by Rossi et al. [22] and highlights the capability of NIRAF for revealing subtle abnormalities in the appearance of the RPE mosaic. These findings may suggest that drusen may develop in an otherwise normal RPE mosaic, or conversely that the presence of drusen may distort the view of the RPE beneath. In either case, a local disruption of the RPE mosaic appearance may be an early indicator of the development of a drusen, which may hence be considered as a biomarker of interest for investigations on retinal aging.
In patient 2 who had late-stage non-neovascular AMD, NIRAF structure could be detected over areas with severely damaged RPE as seen in the OCT and SLO views with higher contrast than by NIRAF in conventional SLO, however, no mosaic could be clearly evidenced. Instead, a diffuse hyper AF was present. This may be related to the superimposition of RPE cells [41]. However, a similar appearance was seen in peripheral zones in our oldest healthy subject (#4, Fig. 3 zoom at 10° temporal), so this may perhaps reflect an age-related aspect of fluorophore distribution [9] rather than an indication of retinal pathology. Future work is needed to better characterize and distinguish the changes that occur from normal aging from those that occur on the pathway to age related diseases such as AMD.
We failed to detect NIRAF signals corresponding to the hyporeflective clumps (HRCs) [42,43], presumed to contain melanin, that are widely detected and highly visible in AMD patients and other retinal disease with flood-illumination fundus camera AO. Though image contrast was low in NIRAF, we did not observe HRCs co-localized with hyper-AF in the non-neovascular AMD patient we examined here using both imaging modalities (data not shown). However, it is possible that the HRCs include aggregates of material including both melanin and lipofuscin (i.e. melanolipofuscin) and that we may see heterogeneity in the fluorescence spectra of such aggregates. Future studies should be directed to more carefully investigate this in a systematic manner. In patient 3, the absence of outer segments in the fovea was likely the cause of the improved visibility of the RPE mosaic. This may provide additional evidence supporting the contention that NIRAF is modulated by the overlying cones, however, it cannot be excluded that changes within RPE cells secondary to the absence of outer segments caused the increased NIRAF signal.
5. Conclusions
This small-scale pilot study demonstrates the feasibility for shifting the spectrum for NIRAF to shorter wavelength bands. It is likely that due to the overlapping spectra of lipofuscin and melanin that the RPE is broadly excitable across the visible and NIR and future efforts should be made to continue to optimize the spectra for cellular level imaging of the RPE. Considering the NIRAF reduction we observed, similar to previous reports [29], future studies are needed to better understand this phenomenon. NIRAF in AOSLO can help to elucidate the cellular level origin of RPE alterations. As new therapies for diseases affecting the RPE, such as AMD, look towards repairing or replacing RPE cells, NIRAF in AOSLO offers promise for evaluating the efficacy of such treatments at the level of single cells.
Acknowledgements
We would like to thank orthoptist Céline Chaumette, ophthalmologist Chiara Eandi MD and intern Natalie Norberg at the Quinze Vingts National Ophthalmology Hospital, Paris, France, for their assistance with medical exams and patient imaging. We would also like to thank Charles E. Granger of the University of Rochester, for helpful comments and discussions, intern Ahmer Shaikh at the University of Pittsburgh, for his assistance with image analysis, and Qiang Yang and David R. Williams for sharing their image registration software with us, under license from the University of Rochester.
Funding
European Research Council SYNERGY Grant scheme (HELMHOLTZ, ERC Grant Agreement # 610110), a grant from the Edward N. & Della L. Thome Memorial Foundation to José Alain Sahel and by departmental startup funds from the University of Pittsburgh to Ethan A. Rossi. This work was also supported by NIH CORE Grant P30 EY08098 to the University of Pittsburgh Department of Ophthalmology, the Eye and Ear Foundation of Pittsburgh, and from an unrestricted grant from Research to Prevent Blindness, New York, N.Y., USA.
Disclosures
RDF: PSI (E). All other authors declare that there are no conflicts of interest related to this work.
References
- 1.von Rückmann A., Fitzke F. W., Bird A. C., “Fundus autofluorescence in age-related macular disease imaged with a laser scanning ophthalmoscope,” Invest. Ophthalmol. Vis. Sci. 38(2), 478–486 (1997). [PubMed] [Google Scholar]
- 2.Morgan J. I., Hunter J. J., Masella B., Wolfe R., Gray D. C., Merigan W. H., Delori F. C., Williams D. R., “Light-induced retinal changes observed with high-resolution autofluorescence imaging of the retinal pigment epithelium,” Invest. Ophthalmol. Vis. Sci. 49(8), 3715–3729 (2008). 10.1167/iovs.07-1430 [DOI] [PMC free article] [PubMed] [Google Scholar]
- 3.Sparrow J. R., Duncker T., “Fundus Autofluorescence and RPE Lipofuscin in Age-Related Macular Degeneration,” J. Clin. Med. 3(4), 1302–1321 (2014). 10.3390/jcm3041302 [DOI] [PMC free article] [PubMed] [Google Scholar]
- 4.Keilhauer C. N., Delori F. C., “Near-Infrared Autofluorescence Imaging of the Fundus: Visualization of Ocular Melanin,” Invest. Ophthalmol. Vis. Sci. 47(8), 3556–3564 (2006). 10.1167/iovs.06-0122 [DOI] [PubMed] [Google Scholar]
- 5.Kellner U., Kellner S., Weinitz S., “Fundus autofluorescence (488 NM) and near-infrared autofluorescence (787 NM) visualize different retinal pigment epithelium alterations in patients with age-related macular degeneration,” Retina 30(1), 6–15 (2010). 10.1097/IAE.0b013e3181b8348b [DOI] [PubMed] [Google Scholar]
- 6.Schmitz-Valckenberg S., Lara D., Nizari S., Normando E. M., Guo L., Wegener A. R., Tufail A., Fitzke F. W., Holz F. G., Cordeiro M. F., “Localisation and significance of in vivo near-infrared autofluorescent signal in retinal imaging,” Br. J. Ophthalmol. 95(8), 1134–1139 (2011). 10.1136/bjo.2010.189498 [DOI] [PubMed] [Google Scholar]
- 7.Feeney-Burns L., Hilderbrand E. S., Eldridge S., “Aging human RPE: morphometric analysis of macular, equatorial, and peripheral cells,” Invest. Ophthalmol. Vis. Sci. 25(2), 195–200 (1984). [PubMed] [Google Scholar]
- 8.Weiter J. J., Delori F. C., Wing G. L., Fitch K. A., “Retinal pigment epithelial lipofuscin and melanin and choroidal melanin in human eyes,” Invest. Ophthalmol. Vis. Sci. 27(2), 145–152 (1986). [PubMed] [Google Scholar]
- 9.Pollreisz A., Messinger J. D., Sloan K. R., Mittermueller T. J., Weinhandl A. S., Benson E. K., Kidd G. J., Schmidt-Erfurth U., Curcio C. A., “Visualizing melanosomes, lipofuscin, and melanolipofuscin in human retinal pigment epithelium using serial block face scanning electron microscopy,” Exp. Eye Res. 166, 131–139 (2018). 10.1016/j.exer.2017.10.018 [DOI] [PubMed] [Google Scholar]
- 10.Sparrow J. R., Gregory-Roberts E., Yamamoto K., Blonska A., Ghosh S. K., Ueda K., Zhou J., “The bisretinoids of retinal pigment epithelium,” Prog. Retin. Eye Res. 31(2), 121–135 (2012). 10.1016/j.preteyeres.2011.12.001 [DOI] [PMC free article] [PubMed] [Google Scholar]
- 11.Sparrow J. R., Hicks D., Hamel C. P., “The retinal pigment epithelium in health and disease,” Curr. Mol. Med. 10(9), 802–823 (2010). 10.2174/156652410793937813 [DOI] [PMC free article] [PubMed] [Google Scholar]
- 12.Liang J., Williams D. R., Miller D. T., “Supernormal vision and high-resolution retinal imaging through adaptive optics,” J. Opt. Soc. Am. A 14(11), 2884–2892 (1997). 10.1364/JOSAA.14.002884 [DOI] [PubMed] [Google Scholar]
- 13.Hammer D. X., Ferguson R. D., Mujat M., Patel A., Plumb E., Iftimia N., Chui T. Y. P., Akula J. D., Fulton A. B., “Multimodal adaptive optics retinal imager: design and performance,” J. Opt. Soc. Am. A 29(12), 2598–2607 (2012). 10.1364/JOSAA.29.002598 [DOI] [PMC free article] [PubMed] [Google Scholar]
- 14.Xiao P., Mazlin V., Grieve K., Sahel J. A., Fink M., Boccara A. C., “In vivo high-resolution human retinal imaging with wavefront-correctionless full-field OCT,” Optica 5(4), 409–412 (2018). 10.1364/OPTICA.5.000409 [DOI] [Google Scholar]
- 15.Roorda A., Zhang Y., Duncan J. L., “High-Resolution In Vivo Imaging of the RPE Mosaic in Eyes with Retinal Disease,” Invest. Ophthalmol. Vis. Sci. 48(5), 2297–2303 (2007). 10.1167/iovs.06-1450 [DOI] [PubMed] [Google Scholar]
- 16.Liu T., Jung H., Liu J., Droettboom M., Tam J., “Noninvasive near infrared autofluorescence imaging of retinal pigment epithelial cells in the human retina using adaptive optics,” Biomed. Opt. Express 8(10), 4348–4360 (2017). 10.1364/BOE.8.004348 [DOI] [PMC free article] [PubMed] [Google Scholar]
- 17.Scoles D., Sulai Y. N., Dubra A., “In vivo dark-field imaging of the retinal pigment epithelium cell mosaic,” Biomed. Opt. Express 4(9), 1710–1723 (2013). 10.1364/BOE.4.001710 [DOI] [PMC free article] [PubMed] [Google Scholar]
- 18.Liu Z., Kocaoglu O. P., Miller D. T., “3D Imaging of Retinal Pigment Epithelial Cells in the Living Human Retina,” Invest. Ophthalmol. Vis. Sci. 57(9), OCT533 (2016). 10.1167/iovs.16-19106 [DOI] [PMC free article] [PubMed] [Google Scholar]
- 19.Torti C., Považay B., Hofer B., Unterhuber A., Carroll J., Ahnelt P. K., Drexler W., “Adaptive optics optical coherence tomography at 120,000 depth scans/s for non-invasive cellular phenotyping of the living human retina,” Opt. Express 17(22), 19382–19400 (2009). 10.1364/OE.17.019382 [DOI] [PMC free article] [PubMed] [Google Scholar]
- 20.Roorda A., Romero-Borja F., Donnelly III W., Queener H., Hebert T., Campbell M., “Adaptive optics scanning laser ophthalmoscopy,” Opt. Express 10(9), 405–412 (2002). 10.1364/OE.10.000405 [DOI] [PubMed] [Google Scholar]
- 21.Morgan J. I. W., Dubra A., Wolfe R., Merigan W. H., Williams D. R., “In Vivo Autofluorescence Imaging of the Human and Macaque Retinal Pigment Epithelial Cell Mosaic,” Invest. Ophthalmol. Vis. Sci. 50(3), 1350–1359 (2009). 10.1167/iovs.08-2618 [DOI] [PMC free article] [PubMed] [Google Scholar]
- 22.Rossi E. A., Rangel-Fonseca P., Parkins K., Fischer W., Latchney L. R., Folwell M. A., Williams D. R., Dubra A., Chung M. M., “In vivo imaging of retinal pigment epithelium cells in age related macular degeneration,” Biomed. Opt. Express 4(11), 2527–2539 (2013). 10.1364/BOE.4.002527 [DOI] [PMC free article] [PubMed] [Google Scholar]
- 23.Granger C. E., Williams D. R., Rossi E. A., “Near-infrared autofluorescence imaging reveals the retinal pigment epithelial mosaic in the living human eye,” Invest. Ophthalmol. Vis. Sci. 58, 3429 (2017). [Google Scholar]
- 24.Granger C. E., Yang Q., Song H., Saito K., Nozato K., Latchney L. R., Leonard B. T., Chung M. M., Williams D. R., Rossi E. A., “Human retinal pigment epithelium: in vivo cell morphometry, multi-spectral autofluorescence, and relationship to cone mosaic,” Invest. Ophthalmol. Vis. Sci. In Press (2018). [DOI] [PMC free article] [PubMed]
- 25.Tam J., Liu J., Dubra A., Fariss R., “In Vivo Imaging of the Human Retinal Pigment Epithelial Mosaic Using Adaptive Optics Enhanced Indocyanine Green Ophthalmoscopy,” Invest. Ophthalmol. Vis. Sci. 57(10), 4376–4384 (2016). 10.1167/iovs.16-19503 [DOI] [PMC free article] [PubMed] [Google Scholar]
- 26.Yang Q., Zhang J., Nozato K., Saito K., Williams D. R., Roorda A., Rossi E. A., “Closed-loop optical stabilization and digital image registration in adaptive optics scanning light ophthalmoscopy,” Biomed. Opt. Express 5(9), 3174–3191 (2014). 10.1364/BOE.5.003174 [DOI] [PMC free article] [PubMed] [Google Scholar]
- 27.Venkateswaran K., Roorda A., Romero-Borja F., “Theoretical Modeling and Evaluation of the Axial Resolution of the Adaptive Optics Scanning Laser Ophthalmoscope,” J. Biomed. Opt. 9(1), 132–138 (2004). 10.1117/1.1627775 [DOI] [PubMed] [Google Scholar]
- 28.Laser Institute of America, ANSI Z136.1 - 2014, American National Standard for Safe Use of Lasers. Orlando, FL: Laser Institute of America; (2014). [Google Scholar]
- 29.Masella B. D., Williams D. R., Fischer W. S., Rossi E. A., Hunter J. J., “Long-term reduction in infrared autofluorescence caused by infrared light below the maximum permissible exposure,” Invest. Ophthalmol. Vis. Sci. 55(6), 3929–3938 (2014). 10.1167/iovs.13-12562 [DOI] [PMC free article] [PubMed] [Google Scholar]
- 30.Gray D. C., Merigan W., Wolfing J. I., Gee B. P., Porter J., Dubra A., Twietmeyer T. H., Ahamd K., Tumbar R., Reinholz F., Williams D. R., “In vivo fluorescence imaging of primate retinal ganglion cells and retinal pigment epithelial cells,” Opt. Express 14(16), 7144–7158 (2006). 10.1364/OE.14.007144 [DOI] [PubMed] [Google Scholar]
- 31.Li K. Y., Roorda A., “Automated identification of cone photoreceptors in adaptive optics retinal images,” J. Opt. Soc. Am. A 24(5), 1358–1363 (2007). 10.1364/JOSAA.24.001358 [DOI] [PubMed] [Google Scholar]
- 32.Zhang Q. X., Lu R. W., Messinger J. D., Curcio C. A., Guarcello V., Yao X. C., “In vivo optical coherence tomography of light-driven melanosome translocation in retinal pigment epithelium,” Sci. Rep. 3(1), 2644 (2013). 10.1038/srep02644 [DOI] [PMC free article] [PubMed] [Google Scholar]
- 33.Cooper R. F., Langlo C. S., Dubra A., Carroll J., “Automatic detection of modal spacing (Yellott’s ring) in adaptive optics scanning light ophthalmoscope images,” Ophthalmic Physiol. Opt. 33(4), 540–549 (2013). 10.1111/opo.12070 [DOI] [PMC free article] [PubMed] [Google Scholar]
- 34.Yellott J. I., Jr., “Spectral analysis of spatial sampling by photoreceptors: topological disorder prevents aliasing,” Vision Res. 22(9), 1205–1210 (1982). 10.1016/0042-6989(82)90086-4 [DOI] [PubMed] [Google Scholar]
- 35.O. Strauss, “The Retinal Pigment Epithelium,” 2011. In: K. H. Fernandez E. Nelson R, editors. Webvision: The Organization of the Retina and Visual System [Internet]. Salt Lake City (UT): University of Utah Health Sciences Center; 1995-. Figure 2. [Transmission electron micrograph of the...]. Available from: https://www.ncbi.nlm.nih.gov/books/NBK54392/figure/StraussRPE.F2/, Accessed 12 October 2018.
- 36.Panda-Jonas S., Jonas J. B., Jakobczyk-Zmija M., “Retinal pigment epithelial cell count, distribution, and correlations in normal human eyes,” Am. J. Ophthalmol. 121(2), 181–189 (1996). 10.1016/S0002-9394(14)70583-5 [DOI] [PubMed] [Google Scholar]
- 37.Prieto P. M., McLellan J. S., Burns S. A., “Investigating the light absorption in a single pass through the photoreceptor layer by means of the lipofuscin fluorescence,” Vision Res. 45(15), 1957–1965 (2005). 10.1016/j.visres.2005.01.023 [DOI] [PMC free article] [PubMed] [Google Scholar]
- 38.van Blokland G. J., van Norren D., “Intensity and polarization of light scattered at small angles from the human fovea,” Vision Res. 26(3), 485–494 (1986). 10.1016/0042-6989(86)90191-4 [DOI] [PubMed] [Google Scholar]
- 39.Gorrand J.-M., Delori F., “A reflectometric technique for assessing photoreceptor alignment,” Vision Res. 35(7), 999–1010 (1995). 10.1016/0042-6989(94)00203-X [DOI] [PubMed] [Google Scholar]
- 40.S. A. Burns, J. C. He, and F. C. Delori, “Do the cones see light scattered from the deep retinal layers?” http://www.opt.indiana.edu/people/faculty/burns/navs97steve.htm, Accessed 23 July 2018.
- 41.Zanzottera E. C., Messinger J. D., Ach T., Smith R. T., Curcio C. A., “Subducted and melanotic cells in advanced age-related macular degeneration are derived from retinal pigment epithelium,” Invest. Ophthalmol. Vis. Sci. 56(5), 3269–3278 (2015). 10.1167/iovs.15-16432 [DOI] [PMC free article] [PubMed] [Google Scholar]
- 42.Gocho K., Sarda V., Falah S., Sahel J. A., Sennlaub F., Benchaboune M., Ullern M., Paques M., “Adaptive optics imaging of geographic atrophy,” Invest. Ophthalmol. Vis. Sci. 54(5), 3673–3680 (2013). 10.1167/iovs.12-10672 [DOI] [PubMed] [Google Scholar]
- 43.Paques M., Meimon S., Rossant F., Rosenbaum D., Mrejen S., Sennlaub F., Grieve K., “Adaptive optics ophthalmoscopy: Application to age-related macular degeneration and vascular diseases,” Prog. Ret. Eye Res. 66, 1–16 (2018). [DOI] [PubMed] [Google Scholar]


