Abstract
The optic nerve head (ONH) is affected by many neurodegenerative and autoimmune inflammatory conditions. Optical coherence tomography can acquire high-resolution 3D ONH scans. However, the ONH’s complex anatomy and pathology make image segmentation challenging. This paper proposes a robust approach to segment the inner limiting membrane (ILM) in ONH volume scans based on an active contour method of Chan-Vese type, which can work in challenging topological structures. A local intensity fitting energy is added in order to handle very inhomogeneous image intensities. A suitable boundary potential is introduced to avoid structures belonging to outer retinal layers being detected as part of the segmentation. The average intensities in the inner and outer region are then rescaled locally to account for different brightness values occurring among the ONH center. The appropriate values for the parameters used in the complex computational model are found using an optimization based on the differential evolution algorithm. The evaluation of results showed that the proposed framework significantly improved segmentation results compared to the commercial solution.
OCIS codes: (100.0100) Image processing, (100.2960) Image analysis, (110.4500) Optical coherence tomography, (000.4430) Numerical approximation and analysis
1. Introduction
The eye’s retina is part of the central nervous system (CNS) and as such features a similar cellular composition as the brain [1]. Accordingly, many chronic brain conditions lead to retinal changes. For example, retinal alterations have been described in clinically isolated syndrome [2], multiple sclerosis [3], neuromyelitis optica spectrum disorders [4–6], Susac’s symdrome [7,8], Parkinson’s disease [9], and Alzheimer’s dementia [10].
The retina is the only part of the CNS that is readily accessible by optical imaging, putting great potential into its imaging in the context of these disorders. Currently, spectral domain optical coherence tomography (SD-OCT) is the method of choice to acquire retinal 3D images in µm resolution [11,12].
The human retina demonstrates two macroscopic landmarks, whose analysis is especially promising in the context of neurological disorders. The macula around the fovea is the visual field’s center and contains the highest density of retinal ganglion cells. Macular SD-OCT images can be analysed quantitatively with intra-retinal segmentation [13]. The derived thickness or volume changes can then be used to quantify neuro-axonal damage in neurological disorders, e.g. in multiple sclerosis [14–16].
The second landmark is the optic nerve head (ONH), where all axons from retinal ganglion cells leave the eye towards the brain, thereby forming the optic nerve.
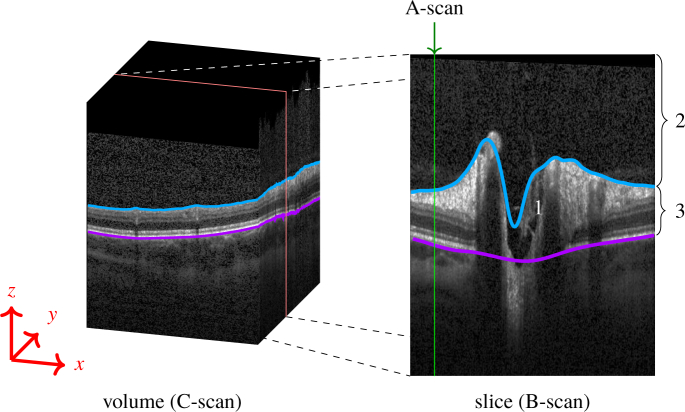
Two membranes define the ONH region and limit the ONH towards the inner and outer eye: the inner limiting membrane (ILM) and the Bruch’s membrane (BM) (Fig. 1). Segmenting both structures provides an important starting point for calculating imaging biomarkers of the ONH. Yet, development of suitable segmentation approaches is still an active research topic since ONH segmentation presents several difficult challenges for image analysis. An example where the commercial device fails is shown in Fig. 1. At the ONH, ILM segmentation is particularly challenging because of the broad range of ILM topologies in highly swollen to shallow ONH, ONH with deep cupping, and in some cases even with ILM overhangs. Segmentation is further complicated by a dense vasculature with often loose connective tissue, which can cause ILM surfaces with vastly irregular shapes, see Fig. 10.
Fig. 1.
(Left) Volume scan (C-Scan) of the optic nerve head (ONH). (Right) The volume scan consists of slices (B-scans), where each column is an axial depth scan (A-Scan). The ONH typically has a cup in its center (1). The blue line marks the inner limiting membrane (ILM) separating the vitreous body (2) from retinal tissue (3). The magenta line represents the Bruch’s membrane (BM). Note how the blue line failed to correctly detect the ILM, and misses the vessel at the left top, as well as the deep cuping.
Fig. 10.
Segmentation of three neighboring B-scans obtained from the 3D segmentation of the volume scan. The green line depicts the manual segmentation, the red our proposed method, and the blue line the segmentation as given by the device.
A simplified ONH parameter is e.g. the peripapillary retinal nerve fiber layer thickness (pRNFL), which is measured in a circular scan with 12° diameter around the ONH, thereby avoiding direct ONH analysis. Certainly though, the ONH 3D structure itself contains potentially highly diagnostically relevant information as well, as it e.g. has been shown in glaucoma [17–20]. However, in applications concerning neurological disorders we need not only the minimum distance from the BMO points to the ILM, the so called BMO minimum rim width parameter (BMO-MRW), an already established parameter in the research of glaucoma [17–20], but also several others that incorporate various regions, volumes and areas. These will be able to capture the changes that ONH undergoes in form of swelling, as for example in idiopathic intracranial hypertension [21, 22], as well as in form of atrophy after optic neuritis [23, 24] or other optic neuropathies, for example, in the context of multiple sclerosis [25] or neuromyelitis optica spectrum disorders [5].
1.1. State of the art and proposed solution
One of the most frequently applied methods for retinal layer and ILM segmentation is based on graph-cuts [13], which works nicely in conditions with smooth surfaces, e.g. at the macula. Despite these important advances, the main drawback of graph-cuts based segmentation is that finding the shortest path through a graph is often implemented via Dijkstra’s algorithm, which results are retrieved as a graph function, which can only have one coordinate per axial depth scan (A-scan). This makes it impossible to correctly segment structures passing one A-scan more than once, e.g. by ILM overhangs at the ONH. Another disadvantage is that the employed constraints defined in most of the graph-cuts construction can result in underestimating extreme shapes, which regularly occur at the ONH, e.g. deep cups.
An attempt to overcome this problem was presented by [26] by incorporating a convex function in the graph-cut approach, which allowed detection of steep transitions, while keeping the ILM surface smooth. Furthermore, in order to allow the segmentation result to have several coordinates per A-scan, [27] employed a gradient vector flow field in the construction of the columns used in the graph-theoretic approach.
However, these recent advances still do not consider features of the ONH shape like overhangs. As a consequence, a tedious and time consuming manual ILM segmentation correction is necessary before ONH shape parameters can be derived in scans with deep ONH cupping or steep forms [28].
Recently Keller et al. [29] addressed this issue as well by introducing a new length-adaptive graph search metric. This approach is employed though to delineate the retina/vitreous boundary of a different application and region of the retina, namely for patients with full-thickness macular holes.
Novosel et al. [30] proposed a 3D approach to jointly segment retinal layers and lesions in eyes with topology-disrupting retinal diseases that can handle local intensity variations as well as the presence or absence of pathological structures in the retina. This method extends and generalizes the existing framework of loosely coupled level set, previously developed for the simultaneous segmentation of interfaces between retinal layers in macular and peripapillary scans of healthy and glaucoma subjects [31], drusen segmentation in subjects with dry age-related macular degeneration [32] and fluid segmentation in subjects with central serous rethinopathy [33]. Some of these methods are still 2D based, [32,33], and all mainly focus on the macula. Carass et al [34] proposed a 3D level set approach based on multiple-object geometric deformable model that overcomes the voxel precision restrictions that are present in the aforementioned methods. This method also focused on macula scans, and included only images without strong pathological changes.
More recently, deep learning emerged as a possible alternative to established graph-cuts, promising a flexible framework for retina analysis. Fang et al. [35] used a convolutional neural network to predict the central pixel label of a given image patch, and subsequently used the graph based approach to finalize the segmentation, while Roy et al. [36] designed a fully convolutional network (FCN) to segment retinal layers and fluid filled cavities in OCT images, partly based on [37] and [38]. These methods are all based on pixel-wise labelling without using topological relationships between layers or layer shape, which can lead to errors in the segmentation. He et al. [39] proposed a framework to correct topological defects by cascading two FCNs. This method was also applied and tested only on macula scans.
In order to address this issue, we here propose a modified Chan-Vese (CV) based segmentation method with sub-pixel accuracy that is fast, robust and able to correctly detect 3D ILM surfaces regardless of ONH shape complexity or overhangs.
Key features of the developed framework are:
This approach addresses the issue of ILM A-scan overhangs, which are frequently seen in eyes from patients with neurologic or autoimmune neuroinflammatory diseases.
We include an additional lower boundary constraint in the Chan-Vese method in order to avoid the level set evolution in tissue regions with low contrast.
The parameters c1 and c2 from the level set equation [40] were obtained as a result of an optimization process and further modified after several iteration steps by a scaling factor that incorporates the data locally. This greatly increased the segmentation accuracy.
We adapted a local fitting intensity energy introduced by [41] into the narrow-band context.
One of the most important aspects of our work is the thorough investigation and automatic setting of parameters involved in the level set equation through an optimization process. Thus, we optimized and validated our approach using 3D ONH scans from a heterogeneous data set of 40 eyes of healthy controls and patients with autoimmune neuroinflammatory diseases.
We further validated our segmentation and investigated the influence of image quality on the results using 100 randomly chosen scans from a large database that included 416 ONH volumes of healthy controls and patients with autoimmune neuroinflammatory diseases.
In the following we describe the algorithmic approach as well as its optimization for segmentation performance and computation time in detail.
2. Methods
2.1. Region based active contour methods
Active contours have been introduced by [42] as powerful methods for image segmentation. A contour C (also called a snake) is moved over the image domain Ω, where the dynamics are defined by the gradient flow of some suitable energy functional F = F [C]. Here, F [C] depends on the intensity function I = I(x) ∈ [0, 1] of the given gray scale image. Thus, the final segmentation is obtained by finding the energy minimizing contour C for the given image I. In region-based methods, the two regions defined by the contour C are used to model the energy function F, as proposed in a general setting by [43].
Let Ω denote the image domain. In the context of OCT volumes, Ω is 3D, and we are looking for a surface C, that divides the retinal tissue from the vitreous body, i.e. the final contour should be the segmented ILM, satisfying:
| (1) |
| (2) |
The classical CV model [40] approximates the intensity function I (x) by some piecewise constant function with values c1 and c2 in Ω1 and Ω2, respectively, x = (x, y, z) is a voxel in the image I. The energy Fcv is defined as the weighted sum of a region based global intensity fitting (gif) energy Fgif, penalizing deviations of I(x) from the corresponding value ci, i ∈ 1, 2, a surface energy Fsurf given by the surface area of C, and a volume energy Fvol given by the volume of Ω1:
| (3) |
| (4) |
| (5) |
| (6) |
Note that by minimizing Fcv, the surface energy Fsurf leads to a smooth contour surface C, whereas the volume energy Fvol yields a balloon force. Moreover, minimizing Fcv with respect to the values of c1 and c2 results in choosing c1 and c2 as the average intensities in the regions Ω1 and Ω2, respectively. The positive weighting parameters λ1, λ2, µ, ν control the influence of the corresponding energy term. Finding good values for these parameters is crucial for obtaining the desired results. Usually the parameters λ1 and λ2 are taken to be equal and may therefore be set to λ1 = λ2 = 1. In section 3.5 it will be explained how values for several parameters of our final model were established.
2.2. Challenges in OCT images
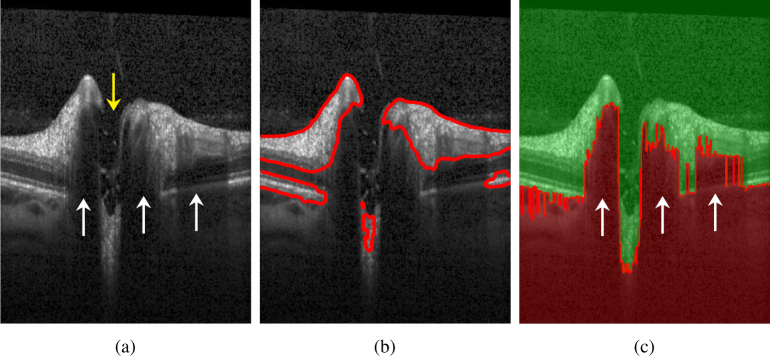
The classical CV model [40] is robust in segmenting noisy images, without clearly defined boundaries. Moreover, complicated shapes such as overhangs, various connected components, even topological changes are handled naturally. However, applying the original formulation of CV to OCT scans does not yield good results. As already discussed in the literature, see e.g. [41], CV fails to provide good segmentation if the two delineated regions, in our case, Ω1 and Ω2, are strongly non-uniform in their gray values. Performance gets even worse in the presence of very dark regions inside the tissue, see Figs. 2(a) and 2(b), where a slice (B-scan) of a typical OCT volume scan is depicted, or in regions with extreme high intensities inside the tissue or the vitreous. As a consequence, using local image averages, as proposed in the classical CV model, is not able to provide a satisfactory segmentation.
Fig. 2.
a) B-scan presenting several challenges for ILM segmentation using the original CV model: the yellow arrow shows the ONH region with no retinal layer information except several tissue remaining from nerve fibers and the ILM; the white arrows show shadows caused by the presence of large blood vessels. b) B-scan showing segmentation results using the original CV model. c) Boundary potential V on a sample B-scan. In the red area, V(x) = ρ, whereas in the green area V(x) = 0.
In the following, we address these problems by adapting the global fitting energy to a local one in the narrow band setting [41] and by using a boundary potential to prevent the contour to move into certain regions. These modifications result in a very stable segmentation algorithm for OCT scans provided that the coefficients weighting the energy terms are chosen suitably.
2.2.1. Global fitting energy
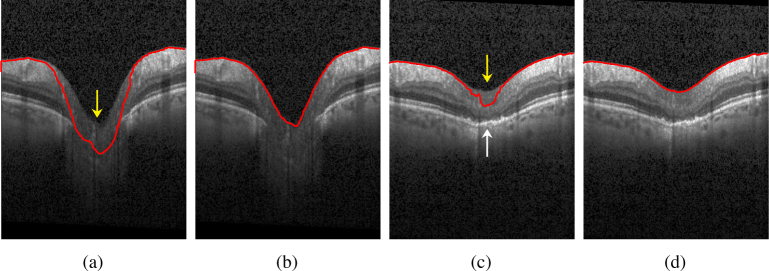
We adapt the global values c1 and c2, obtained after optimization (see subsection 3.5), column-wise (per A-scan) in order to obtain correct segmentation results at the ONH, where the tissue has very low intensity and little contrast to the vitreous, see Fig. 3(a). We scale the values on each column using the formula:
| (7) |
where M × N is the size of a B-scan. This significantly improves the segmentation results, see Fig. 3(b). Additionally, in order to prevent the contour to penetrate the retina in regions with dark upper but hyperintense lower layers, see see Fig. 3(c), we rescale these values again, after the interface has almost reached the desired ILM contour. The factor used is computed with the same formula as in Eq. (7), but the maximum intensity considers only voxels from the top of the volume to 77 µm (20 px) below the current interface position. Segmentation results obtained after this scaling step are shown in Fig. 3(d).
Fig. 3.
a) Example of an ONH region with very low contrast compared to the vitreous (yellow arrow). This leads to the contour leaking into the tissue. b) The same scan with correctly detected ILM after scaling the values for c1 and c2 according to equation 7; c) Example of an ONH region with low intensity values at the inner layers (yellow arrow) compared to the dark vitreous as well as to the hyperintense outer layers (white arrow). This causes the contour to falsely detect parts of the lower layers as vitreous. d) The same scan with correctly detected ILM by rescaling values c1 and c2 after the interface has almost reached the desired ILM contour.
We choose to rescale the values of c1 and c2 instead of rescaling the column intensities, since the latter would also influence the local fitting energy (lif), presented in section 2.2.3.
2.2.2. Boundary potential
To prevent the contour C, at the ONH, from evolving into dark areas, caused by absence of retinal layers and presence of large vessels, characteristic to this region (see Fig. 2(a)), we introduce a local boundary potential V(x):
| (8) |
This potential is set to a very high value ρ at these dark regions, detected as follows: in each column, starting from bottom to top, V(x) is set to ρ until the first gray value I (x) is larger than 45 % of the maximum gray value in that column. All the other voxels are set to 0, see Fig. 2(c) for an example.
2.2.3. Local intensity fitting energy
In images with large intensity inhomogeneities, e.g. caused by varying illumination, it is not sufficient to minimize only a global intensity fitting energy. In order to achieve better segmentation results, [41] introduced two fitting functions f1(x) and f2(x), which are supposed to locally approximate the intensity I(x) in Ω1 and Ω2, respectively. The local intensity fitting energy functional is defined as:
| (9) |
Similar to the global constants c1, c2, explicit formulas for functions f1 and f2 are obtained by energy minimization [41]. Since all calculations are restricted to a narrow band along the contour in our approach, we used compact support kernels for Kσ based on a binomial distribution with σ representing the kernel size. The adapted formula for calculating f1 and f2 is presented in Appendix 7.2. Note, that these modifications also considerably reduce the computation time as compared to a global convolution.
2.3. Our energy model
In a final step, the influence of the local and global intensity fitting energy, are combined similar to the work presented in [41] by introducing another weight parameter ω and to arrive at our modified CV functional F:
| (10) |
2.4. Level set formulation
To solve the minimization of the above energy functional, the level set method [40] is used, which replaces the unknown surface C by the level set function ϕ(x), considering that ϕ(x) > 0 if the point x is inside C, ϕ(x) < 0 if x is outside C, and ϕ(x) = 0 if x is on C. Energy minimization is then obtained by solving the following gradient descent flow equation for ϕ to steady state:
| (11) |
| (12) |
Flocal(x), adapted to our narrow band approach, is given in detail in appendix 7.2. In the above Formula, δε denotes the smoothed Dirac delta function having compact support on the narrow band of width ε, see appendix 7.1, and is the mean curvature of the corresponding levelset surface.
3. Implementation
3.1. Initial contour
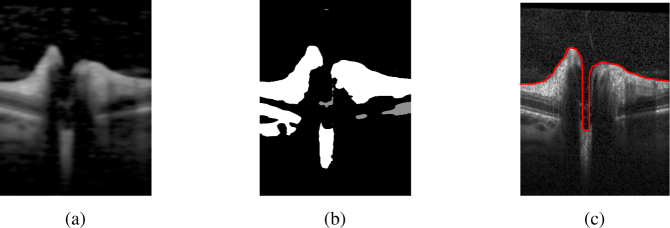
For initialization we developed a basic 2D segmentation algorithm to create a start contour (start segmentation). In a first step, morphological filters (erosion and subsequent dilation with 15 × 7 ellipse structure element) and a smoothing filter (Gaussian blur with kernel size 15 × 7 and variance σx = 6, σz = 3) are used, to reduce speckle noise. In the next step, we set each pixel with at least 35 % of the maximum column intensity to white. The remaining pixels are set to black. To keep only the tissue connected to the retina, enhanced at the previous step, we set the pixel values of all connected components consisting of less than 2,400 pixels, which corresponds to 0.11 mm2 in the used OCT data sets, to gray. Finally, in each column the contour is set at the first white pixel from top to bottom. If no white pixel exists, the first gray pixel is taken instead. These processing steps are exemplified in Fig. 4.
Fig. 4.
Three processing steps to obtain initial segmentation: a) filtering with morphological and Gauss filter b) thresholding, neglecting small connected components c) the initial contour
3.2. Narrow band and reinitialization
Starting with the initial contour, the signed distance function and the reinitialization of the 3D level set function is computed using fast marching [44,45, s. 86]. We use the L1 norm to achieve faster calculation time. For the same reason the reinitialization process is done only every 10th iteration step, while the computation for f1 and f2 each 5th iteration step. All computation is done on the narrow band around the zero level set of width ε + max(σx, σy, σz), where σ is the kernel size of Kσ, see Eq. (9), ε represents the regularization value for the smooth Heaviside function Hε and Dirac delta function δε. Our value for ε is 5.
3.3. Removal of non-connected volume parts
A bad initial contour can produce non connected volumes in the tissue and in the vitreous. To improve the segmentation we remove these volumes from the final result, as well as ignore a small area around the image border, where unnatural connectivities might occur due to low contrast or missing image information.
3.4. Numerical implementation and computation time
To solve the gradient flow equation, an explicit first order time discretization is used, where for the spatial finite difference discretization we followed [40]. Note, the volume scan has different resolution in the two lateral directions, see below, section 3.5.1. We accounted for this by choosing different spatial mesh sizes hx = hz = 1 and hy = 3. The higher value in y direction reduces the influence of differences between the B-scans, especially near the cup, and reduces computation time. Also, curvature weight parameters, µx = µz = 3.5 µy, are direction dependent in order to create a smooth contour. The lower resolution in y direction is forces the segmentation to include even small tissue that is still connected to the retina. For the chosen parameters see Table 4.
Table 4.
Parameter values; x, y, z denote coordinate directions horizontal, axial and lateral (between B-scans).
| Symbol | Explanation | Value |
|---|---|---|
| ν | weight parameter of balloon force | 0.03248 |
| ω | local energy weight | 0.15915 |
| 1 − ω | global energy weight | |
| c 1 | global fitting gray value in Ω1 | 0.24206 |
| c 2 | global fitting gray value in Ω2 | 0.94945 |
|
| ||
| µx = 0.035 | ||
| µ | weight parameter of curvature | µy = 0.010 |
| µz = 0.035 | ||
| τ | time step | 0.0015 |
| n | number of iterations (time steps) | 140 |
| λ 1 | tissue area weight | 1 |
| λ 2 | vitreous body area weight | 1 |
| ε | half of narrow band width | 5 |
| ρ | boundary potential value | 25 |
| σx = 2 | ||
| σ | local energy convolution kernel size | σy = 0 |
| σz = 2 | ||
| hx = 1 | ||
| h | spatial mesh size | hy = 3 |
| hz = 1 | ||
The computation time depends on the initial contour and on the shape of the ONH, and takes on average 14.2 s (minimum time is 12.8 s, maximum 15.9 s) on a standard PC (Intel Core i7-5600U (2 × 2.6 GHz) with Debian 9 and gcc 6.3.0). For the ONH scan shown in Fig. 12(a) 15.5 s were needed (0.2 s for creating the initial contour and 15.3 s for segmentation using the proposed CV method). The OCT image size was 384 × 496 × 145 voxels.
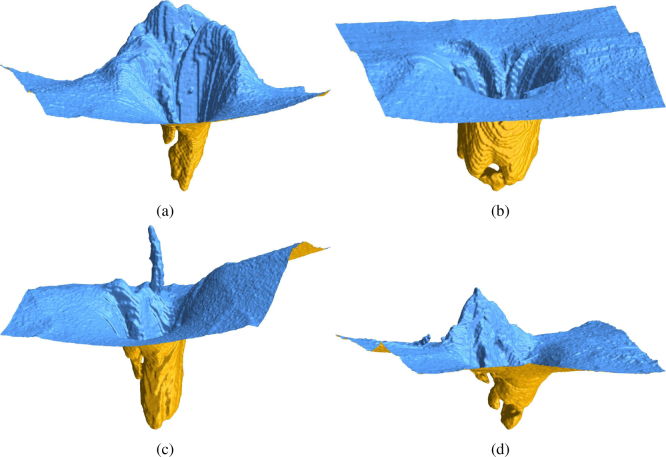
Fig. 12.
3D view of the ILM segmentation results showing particularly interesting topologies at the ONH.
3.5. Parameter optimization
We used an automatic parameter optimization procedure to find values for the parameters ν, ω, c1 and c2 for our computational model (11).
3.5.1. OCT image data
Image data consisted of 3D ONH scans obtained with a spectral-domain OCT (Heidelberg Spectralis SDOCT, Heidelberg Engineering, Germany) using a custom ONH scan protocol with 145 B-scans, focusing the ONH with a scanning angle of 15° × 15° and a resolution of 384 A-scans per B-scan. The spatial resolution in x direction is ≈ 12.6 µm, in axial direction ≈3.9 µm and the distance between two B-scans ≈ 33.5 µm. Our database consists of 416 ONH volume scans that capture a wide spectrum of ONH topological changes specific to neuroinflammatory disorders (71 healthy control eyes, 31 eyes affected by idiopathic intracranial hypertension, 60 eyes from neuromyelitis optica spectrum disorders, and 252 eyes of multiple sclerosis patients). We have chosen 140 scans randomly from this database, which presented different characteristics, from scans with good quality up to noisy ones, from healthy but also eyes from patients with different neurological disorders, in order to cover a broad range of shapes. 40 ONH scans were manually segmented and used as ground truth for the optimization process. These will be called the group40. The remaining 100 scans – in the following referred to as the group100 – were used for the validation of the segmentation results and assessment of image quality influence on the segmentation results.
Incomplete volume scans as well as those with retinas damaged by other pathologies were not included.
3.5.2. Error measurement
All 40 scans of the group40 were manually segmented and checked by an experienced grader. From this dataset, 20 images were used for optimization, while the other 20 for validating the results. For one optimization run, 10 files were randomly chosen from the optimization set. The measure used for the minimization process was defined as the sum of the errors for the parameter ν, ω, c1 and c2. An error metric similar to the one described in [46] was employed, where the error is defined as the number of wrongly assigned voxels, i.e. the sum of the number of false positive and false negative. Note that this metric does not depend on the position of the retina. In order to compare different optimization results, the accumulated error of all the 20 scans of the optimization set was used.
3.5.3. Optimization algorithm
The method chosen is the multi-space optimization differential evolution algorithm as provided by GNU Octave [47].
This algorithm creates a starting population of 40 individuals with random values. In our case, an individual represents a parameter set for ν, ω, c1 and c2 together with the accumulated segmentation error of the 10 selected volume scans. During optimization, the algorithm crosses and mutates the individuals to create new ones, and drops out newly created or old ones depending on which exhibits larger errors. We allowed for at most 2000 iterations and set box constraints for all four parameters. Note that for each newly created individual, the cost function (error) has to be evaluated by first performing 10 segmentations for the randomly chosen OCT-scans, then calculating the error by comparing with results from manual segmentation. Thus, each iteration step is computationally demanding. The differential evolution algorithm has been chosen since it is derivative free and supports the setting of specific bounds for the parameters. Moreover, we observed a high reproducibility of the finally obtained optimal parameter set. To perform the optimization, we used the Docker Swarm on OpenStack infrastructure from [48], which allowed to do parallel computations on a PC cluster.
4. Results
4.1. Optimization results
In Table 1, the results of all 10 optimization runs sorted in increasing order of the total error are presented. The parameters given in the first line, namely ν = 0.03248, ω = 0.15915, c1 = 0.24206, c2 = 0.94945 have been chosen for all subsequent calculations.
Table 1.
Total error and parameter values as obtained in 10 optimization runs, sorted in ascending order of the error. Total error represents the accumulated error of the 20 scans in the optimization set.
| opt run | error voxel | error mm3 | ν | ω | c 1 | c 2 |
|---|---|---|---|---|---|---|
|
| ||||||
| 9 | 481 105 | 0.791 99 | 0.032 48 | 0.159 15 | 0.242 06 | 0.949 45 |
| 5 | 481 749 | 0.793 05 | 0.033 20 | 0.165 73 | 0.256 22 | 0.940 07 |
| 7 | 483 610 | 0.796 11 | 0.026 97 | 0.138 75 | 0.237 06 | 0.942 65 |
| 8 | 483 995 | 0.796 75 | 0.024 83 | 0.124 19 | 0.148 03 | 0.973 19 |
| 2 | 484 557 | 0.797 67 | 0.027 73 | 0.186 85 | 0.276 64 | 0.859 89 |
| 4 | 486 982 | 0.801 66 | 0.047 25 | 0.213 80 | 0.291 79 | 0.968 95 |
| 10 | 487 606 | 0.802 69 | 0.045 57 | 0.215 77 | 0.278 02 | 0.962 55 |
| 3 | 495 657 | 0.815 95 | 0.052 70 | 0.224 31 | 0.273 95 | 0.998 17 |
| 6 | 496 627 | 0.817 54 | 0.051 71 | 0.225 65 | 0.291 19 | 0.989 22 |
| 1 | 506 210 | 0.833 32 | 0.066 50 | 0.315 48 | 0.329 14 | 0.949 59 |
Note that the four parameters ν, ω, c1, c2 are not independent from each other as it can be seen in the definition of the energy functional. The parameter that shows the largest variation is the balloon force weight parameter ν. This variation is highly influenced by the presence or absence of one specific volume scan in the randomly chosen optimization set (subset of 10 out of 20), which appears as outlier with highest error in all 10 error distributions as shown in Fig. 5. This occurs because the parameters will account for this particular scan if it is contained in the optimization set.
Fig. 5.
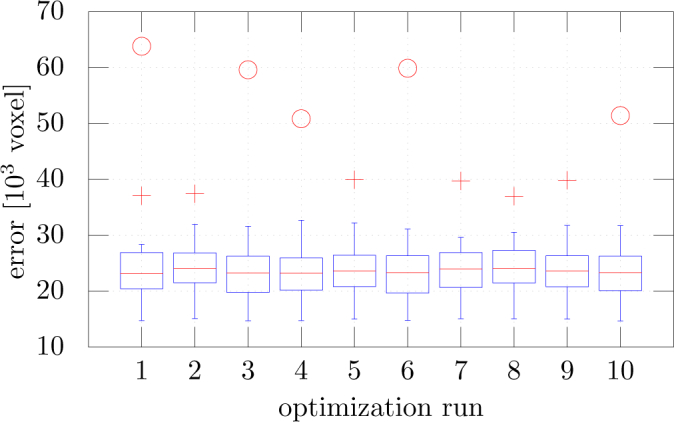
Error distribution over 20 scans represented as box plots for the 10 optimization runs. The + symbol and the ◦ symbol denote outliers with an error deviating more than 1.5 × STD and more than 3.0 × STD from the mean, respectively.
4.2. Evaluation of segmentation performance
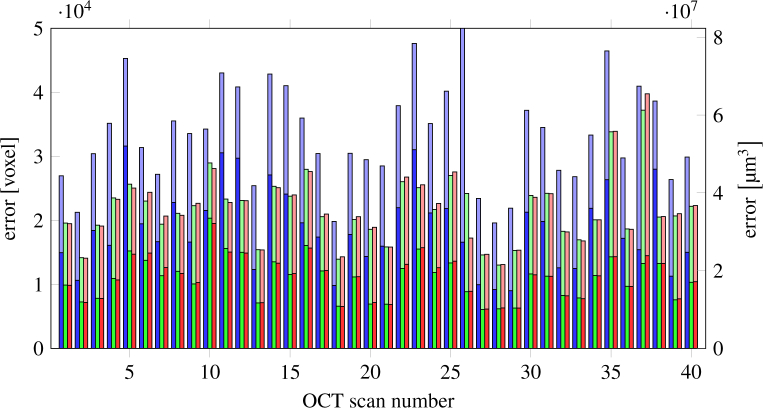
Our results are summarized in Fig. 6. For each scan, numbered from 1-40, the first bar (blue) represents the segmentation error given by ILM segmentation implemented in the device, the second bar (green) is the error of our segmentation method starting with an initial contour given by the device’s segmentation, and the last bar (red) represents the error of our segmentation method starting with an initial contour calculated as described in subsection 3.1. The lower bars represents the amount of error at the ONH region.
Fig. 6.
Errors of the complete data set (40 scans): segmentation of the device (blue), proposed algorithm with the segmentation of the device as initial contour (green) and proposed algorithm with own initial contour (red). The lower bars show the error in the inner 1.5 mm circle of the ONH. The device error of scan 26 is very high (110 508 voxels) because the segmentation was completely wrong on some B-scans.
For evaluation and analysis of our results, we used GNU Octave version 4.0.3 [49] and R version 3.3.2 [50]. Our segmentation method outperforms the segmentation available from the device (Wilcoxon Signed-Rank Test p-value = 1.837 × 10⁻¹⁰ at 0.05 confidence interval).
To check the influence of the initial contour, we compared the results of our segmentation method, obtained starting either with our own initial contour (mean / STD = 21 707 5365, STD represents standard deviation) or with the segmentation given by the device (mean / STD = 21 715 / 5152; Wilcoxon Signed-Rank Test p-value = 0.3007 at 0.05 confidence interval). Our model outperforms again the segmentation of the device (error of the segmentation of the device mean / STD = 34 884 / 14 062; Wilcoxon Signed-Rank Test p-value = 1.819 × 10⁻¹² at 0.05 confidence interval). Moreover, starting with two different initializations, the results of our method are very close to each other (bars 2 and 3), therefore showing that our method is independent on a given rough estimation of the ILM.
We then looked at the error contribution of the central region around the ONH consisting of all A-Scans within a radius of 1.5 mm. Around 50 % of the total error is represented by the errors in the ONH centered region, which usually presents the strongest topological challenges. When evaluating the same comparison with the ILM segmentation computed by the device, our algorithm again performed considerably better (error inside the center region with our algorithm mean / STD = 11 092 / 3306, as compared to the error of the device mean / STD = 18 744 / 6328; Wilcoxon Signed-Rank Test p-value = 1.819 × 10⁻¹² at 0.05 confidence/interval).
Lastly, we evaluated the local error size distribution, i.e. the local Euclidean distance between manual and our automatic segmentation on each B-scan of all 40 scans, see Fig. 7 and mean error as well as 10 %, 50 % and 90 % quantile of the error distribution, see Table 2. Here we have calculated the distance of each line segment of the calculated segmentation line to the ground truth segmentation line at each OCT slice. Note that the manual segmentation is pixel based whereas our proposed method has subpixel accuracy. We can see a large majority of these local errors are less than 2 µm, followed by a range from 2 µm to 4 µm for most of the remaining ones.
Fig. 7.
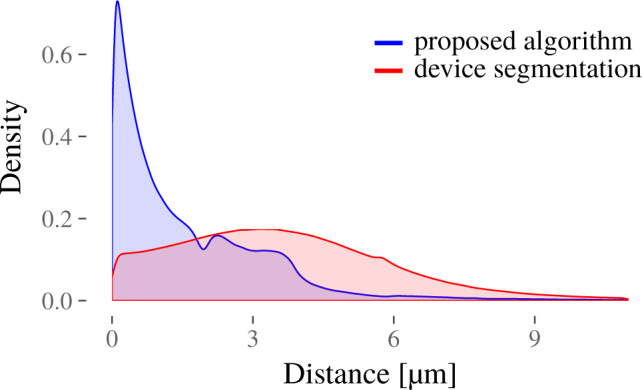
Normalized distribution of local Euclidean distances between manual and automatic segmentation.
Table 2.
Mean error, and 10 %, 50 % and 90 % quantile of the error distribution computed as the euclidian distance between automatic (proposed, device) and manual segmentation.
| Mean Error (µm) | 10 % Quantile (µm) | 50 % Quantile (µm) | 90 % Quantile (µm) | |
|---|---|---|---|---|
| Proposed | 1.9982 | 0.1206 | 1.0792 | 3.8167 |
| Device | 4.8001 | 0.8846 | 3.5335 | 7.2878 |
4.3. Segmentation validation
To evaluate the performance of our segmentation method in a clinical setting, we analyzed the 100 OCT scans described in section 3.5.1, denoted as group100. An experienced grader manually checked all scans and corrected the segmentation, if necessary. Besides segmentation results, the influence of scan quality on the segmentation was assessed. To this end, another experienced grader labeled regions in all scans (initial group40 see section 3.5.2, and the aforementioned group100) according to the following criteria:
| • Incomplete scan (top) | • Low SNR |
| • Incomplete scan (bottom) | • Bad illumination |
| • Missing signal | • More than one of the above criteria |
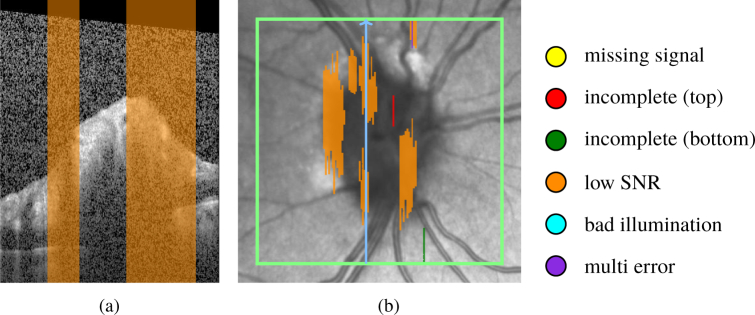
Figure 8 shows a B-scan with the labeled A-scans that suffer from low SNR, and the corresponding SLO image with a projected map of all A-scans labeled according to these quality criteria.
Fig. 8.
Quality assessment of a volume scan: (a) B-scan with low SNR region in orange, (b) corresponding SLO image with quality assessment map, color coded according to the criteria shown at the right hand side of the map; green rectangle delimits the scan area; blue arrow shows the B-scan position.
Table 3 shows all A-scans of group100 that have been assessed according to the quality criteria, as well as the number of their corresponding corrected A-scans. It can be seen, that less than 0.2 % of all A-Scans had to be corrected. Note, that scan quality does influence the segmentation results, yet only a smaller percentage of bad quality regions presented also an erroneous ILM: 13.3 % of the A-scans having low SNR and 6.2 % of the ones with low illumination. In the concrete clinical application context a user would be interested on his workload in number of B-scans that must be corrected. The modified A-Scans in Table 3 represent 724 B-scans, a rather low fraction (5.0 %) of the total number of 14 500 evaluated.
Table 3.
Overview of scan quality (with corresponding labels) and segmentation corrections, as well as voxel error of the corrections made for 100 volume scan, randomly selected from a large database.
| quality label | multi error | cut lower | cut upper | low SNR | bad illumination | no label |
|---|---|---|---|---|---|---|
| all A-scans | 230 | 49 | 2782 | 11 563 | 6189 | 5 315 187 |
| modified A-scans | 0 | 0 | 20 | 1541 | 381 | 8557 |
| modified A-scans in % | 0:00 | 0:00 | 0.72 | 13:33 | 6:16 | 0:16 |
| mean voxel error of modified A-scans | 0:00 | 0:00 | 13.75 | 5:49 | 1:02 | 6:37 |
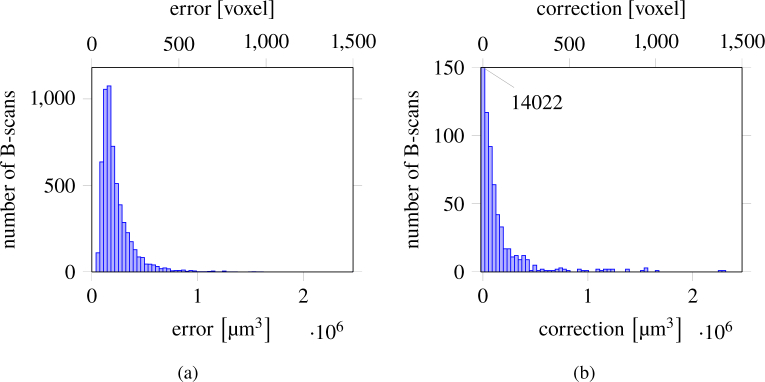
Furthermore, Fig. 9 shows the error distribution in µm3 for all B-scans of group40 and group100, respectively. Although the two groups underwent a different segmentation correction process the results presented in these two figures are similar. Most of the scans present small errors, with few larger outliers. 77.15 % of group40 and 99.3 % of group100 are below 0.0003 mm3. To understand the magnitude of these outliers, note that the average volume of a healthy control is (1.80 ± 0.49) [21]. The maximum error per volume for group40, 0.065 46 mm3, represents 3.6 % of an average volume, while 90 % of all volumes have an error less or equal to 0.0454 mm3, e.g. 2.52 % of the average volume. For group100 the maximum error per volume is 0.012 59 mm3, 0.69 % of an average volume, while the error for 90 % of all volumes is less or equal to 0.0025 mm3, which represents 0.138 %.
Fig. 9.
Distribution of errors per B-Scan (a) (group40) obtained by comparing with manual segmentations, (b) (group100) as obtained by the corrections performed by an experienced grader.
We emphasize again a very important aspect of the ONH OCT scans. Due to the anatomy of the ONH and blood vessels, the contrast between tissue and vitreous is often insufficient to precisely delimit the retinal tissue even for an experienced grader. To investigate the segmentation goodness in these ambiguous parts, a second experienced grader labeled these in all scans of group100. The results showed that, from all the corrected voxels, approximately 25 % were contained in these labeled areas.
4.4. ILM segmentation
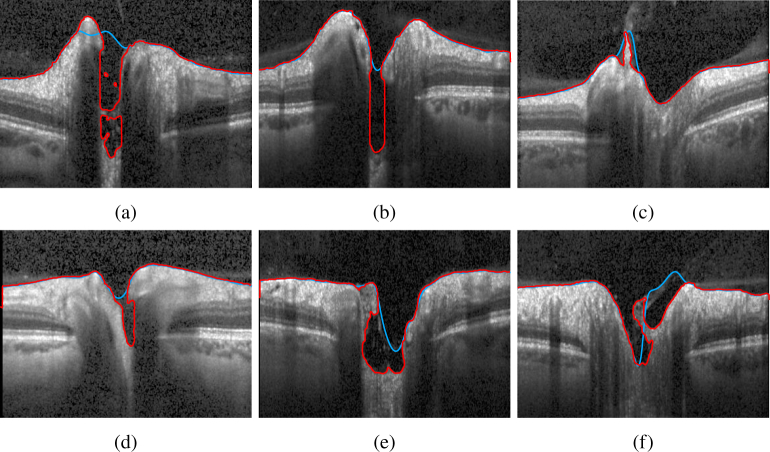
We present several challenging examples selected from the larger database presented in subsection 4.3. Figure 10 shows a case where a hole in 3D is formed. Our segmentation (red line) is able to correctly detect the ILM, whereas the device implemented method fails. Also Fig. 11 shows several cases where our method manages to detect all visible tissue being connected to the ILM. To emphasize the 3D nature of our method, we present in Fig. 12 rendered surfaces obtained from the segmentation result. It can be clearly seen, that overhangs in the cup create special topologies, that were not properly handled by previous methods.
Fig. 11.
Segmentation results, showing B-scans that present particular challenges: deep cups - (a), (b), and (e); overhangs - (a), (d), (e), and (f); tissue still connected to ILM: (c). The red line depicts our proposed method, and the blue line the segmentation given by the device.
5. Discussion
We developed and implemented a method for segmenting the ILM surface from ONH centered 3D OCT volume scans utilizing a modified CV model. We optimized, tested and validated the method on scans presenting a variety of ONH shapes found in healthy persons and patients with autoimmune neuroinflammatory disorders.
Our method is providing ILM segmentation that handles not only steep cups, but also challenging topological structures, i.e. overhangs. To achieve this we performed several modifications to the original CV approach, which enabled us to account for low contrast regions especially at the limit between vitreous and retina, for strong inhomogeneities throughout a single B-scan, but also throughout the entire volume by introducing a local fitting energy additionally to the global one. Wang et al. [41] introduced an energy functional with a local fitting term and an auxiliary global intensity fitting one and showed the advantages of using such an approach in terms of accuracy and robustness in inhomogeneous regions. Our method further expands this approach by incorporating this energy formulation in a computational efficient narrow-band method. By locally rescaling the two parameters c1 and c2 in the global energy definition (see subsection 2.1 and 2.2.1) we further stop the interface from entering inside retinal tissue. Furthermore, the introduction of a boundary potential successfully accounts for shadows cast by the presence of large blood vessels at the ONH. Not the least, we carefully chose key parameters ω, ν, c1 and c2 as a result of an extensive optimization process.
As a result, the performance of the proposed multi-energy segmentation framework significantly improved segmentation results compared to the one integrated in the commercial device. Furthermore, our approach’s results were independent from the initialization contour.
We did not compare our method with other retinal segmentation methods found in the literature, since each method was evaluated on different types of retinal images, different metrics for the accuracy measurement. However, to our knowledge, none of the existing methods, i.e. when based on graph-cuts, tackles the challenge of segmenting overhangs present especially at the ONH region [27,51–57].
Of note, although the length-adaptive method introduced by Keller et al. [29] and evaluated in pathologic eyes in the macula region performed better than the shortest path algorithm, it was not able to successfully segment every feature of the pathology presented. Here, especially weak gradients caused segmentation challenges. Again, a direct comparison with this method is difficult since this approach was applied to the macula region. Also, it is not clear how this approach would handle overhangs that present as several holes in one B-scans.
Several level-sets methods have also been employed in retinal layer segmentation, most of which are related to the macula region and, or specific pathologies in this region [30–34]. [32,33] use 2D segmentation, which limits their capabilities in capturing challenging 3D structures, as seen at the ONH. Furthermore, most of these methods focus on the macula, except [31] which also provides data on ONH scans, although as the authors stated themselves, this algorithm would need further modifications to account for difficult topologies. To overcome the intensity variation and disruptive pathological changes caused by several diseases, [30] proposed a 3D approach steered by local differences in the signal between adjacent retina layers. It is not clear how this approach would perform at the ONH, especially in low contrast between vitreous and interface, since this might be the reason why drusen, especially small ones were not so accurately detected. Another question that arises is, to which extend is the segmentation affected by noise, since the later is highly dependent on the contrast between layers in the attenuation coefficient values.
Deep learning based methods are an important advancement, which might lead to powerful segmentation approaches of retinal tissue [35,36, 39]. Their performance is highly dependent on the training dataset [58], and thus their applicability to a broad clinical spectrum of retinal changes remains to be shown. It will be interesting to see first applications of this potentially very promising approach for segmenting ONH scans.
A limitation of our method lies in the successful detection of an initial contour. This failed in one case among the investigated 40 scans used in the optimization process, which was caused by weak image quality and an grossly uneven image contrast. For practical use, a minimum image quality might prevent such errors.
We also tested the performance of our segmentation on a larger database, containing 100 volume scans of healthy controls and several different neurological disorders and investigated the influence of image quality on the goodness of the segmentation. The results have shown that our proposed segmentation is robust against scan image quality (like noise, and bad illumination) with only a small percentage of the total segmentation having to be corrected in these cases. Additionally, overall the amount of error was small, with few outliers, which represented a small amount of the total volume of a complete scan. Therefore, our segmentation represents a considerable improvement over the current commercial solution. Furthermore, it can be employed in the clinical routine.
Our method may present a key component in future approaches to analyze overall ONH structure and volume in health and disease. For this, an accurate detection of tissue between ILM and BM is necessary. Further, detection of the ONH center and the ocular axis are required to establish coordinate origin and scan rotation. We previously developed a 2D based segmentation approach for ONH volume computation [59], which was able to robustly detect the BM as lower boundary in healthy people as well as in patients suffering from various neurological disorders [21,22,60]. However, in this method the other key surface for volume computation -the ILM - was taken from the device itself, which led to erroneous boundary definitions in many cases. Thus, with the proposed modified CV based method, ILM detection for ONH volume computation may be further optimized.
6. Conclusion
It is crucial to have a robust ILM segmentation for the analysis of ONH structure in both neurologic and ophthalmologic conditions. A better insight in morphometric changes of the ONH could potentially improve diagnosis and the understanding of diseases like multiple sclerosis, neuromyelitis optica spectrum disorders, Parkinson’s disease and Alzheimer’s dementia.
Our approach provides a flexible and accurate computational method to segment the ILM in 3D OCT volume scans. We could show the superiority in performance of the proposed CV model compared to a standard commercial software method and its robustness against the large variations in the ONH topology. Furthermore, our method is fast and allows for flexible initialization. Thus, it shows great potential for clinical use as it is capable to robustly handle ONH data of both healthy controls and patients suffering from different neurological disorders. We hope that similar concepts, especially the optimization framework, will be applied in other applications as well.
7. Formula
7.1. Regularized Heaviside and delta function
For numerical calculation we use the approximated Heaviside function Hε
| (13) |
with corresponding smoothed Dirac delta function δε
| (14) |
We made this choice in order to have compact support of δε, being the narrow band of width 2ε.
7.2. Convolution with compact support kernel
The calculation of the local intensity fitting force involves convolutions which have been adapted for allowing to consequently use the narrow band. Here, not all values are well defined and therefore the convolution formula has to be modified.
The definition of the local intensity averages are modified according to (nan means not a number)
| (15) |
| (16) |
Now the local fitting forces are calculated as follows:
If , than
| (17) |
in other case, set
| (18) |
7.3. Parameters
All parameter values of our computational model are shown in Table 4.
Acknowledgment
The authors would like to thank Inge Beckers, Josef Kauer, Henning Nobmann and Timm Oberwahrenbrock for helpful discussions, Hanna Zimmermann and Charlotte Bereuter for their valuable input about the OCT data, and their help in the quality assessment of the scans (Hanna Zimmermann) and performing the segmentation correction and uncertainty region labeling (Charlotte Bereuter). We also thank Christoph Jansen and the HTW Berlin to provide the infrastructure helping to speed up computation time for the optimization process. We acknowledge support from the Open Access Publication Fund of Charité - Universitätsmedizin Berlin.
Funding
German Federal Ministry of Economics and Technology (ZIM-Projekt KF 2381714BZ4, BMWi Exist 03EUEBE079); DFG Excellence Cluster NeuroCure Grant (DFG 257).
Disclosures
A patent application has been submitted for the method described in this paper. KG: (P); FH: (P); FP: (P); AUB: (P), Nocturne UG (I); EMK (P), Nocturne UG (I,E). F. Paul serves on the scientific advisory board for the Novartis OCTIMS study; received speaker honoraria and travel funding from Bayer, Novartis, Biogen Idec, Teva, Sanofi-Aventis/Genzyme, Merck Serono, Alexion, Chugai, MedImmune, and Shire; is an academic editor for PLoS ONE; is an associate editor for Neurology Neuroimmunology and Neuroinflammation; consulted for Sanofi Genzyme, Biogen Idec, MedImmune, Shire, and Alexion; and received research support from Bayer, Novartis, Biogen Idec, Teva, Sanofi-Aventis/Genzyme, Alexion and Merck Serono. A.U. Brandt served on the scientific advisory board for the Biogen Vision study; received travel funding and/or speaker honoraria from Novartis Pharma, Biogen, Bayer and Teva; has consulted for Biogen, Nexus, Teva and Motognosis, Nocturne.
References and links
- 1.London A., Benhar I., Schwartz M., “The retina as a window to the brain—from eye research to CNS disorders,” Nat. Rev. Neurol. 9, 44–53 (2012). 10.1038/nrneurol.2012.227 [DOI] [PubMed] [Google Scholar]
- 2.Oberwahrenbrock T., Ringelstein M., Jentschke S., Deuschle K., Klumbies K., Bellmann-Strobl J., Harmel J., Ruprecht K., Schippling S., Hartung H.-P., Aktas O., Brandt A. U., Paul F., “Retinal ganglion cell and inner plexiform layer thinning in clinically isolated syndrome,” Multiple Scler. J. 19, 1887–1895 (2013). 10.1177/1352458513489757 [DOI] [PubMed] [Google Scholar]
- 3.Oberwahrenbrock T., Schippling S., Ringelstein M., Kaufhold F., Zimmermann H., Keser N., Young K. L., Harmel J., Hartung H.-P., Martin R., Paul F., Aktas O., Brandt A. U., “Retinal damage in multiple sclerosis disease subtypes measured by high-resolution optical coherence tomography,” Multiple Scler. Int. 2012, 530305 (2012). [DOI] [PMC free article] [PubMed] [Google Scholar]
- 4.Schneider E., Zimmermann H., Oberwahrenbrock T., Kaufhold F., Kadas E. M., Petzold A., Bilger F., Borisow N., Jarius S., Wildemann B., Ruprecht K., Brandt A. U., Paul F., “Optical coherence tomography reveals distinct patterns of retinal damage in neuromyelitis optica and multiple sclerosis,” PLOS ONE 8, 1–10 (2013). 10.1371/journal.pone.0066151 [DOI] [PMC free article] [PubMed] [Google Scholar]
- 5.Oertel F. C., Kuchling J., Zimmermann H., Chien C., Schmidt F., Knier B., Bellmann-Strobl J., Korn T., Scheel M., Klistorner A., Ruprecht K., Paul F., Brandt A. U., “Microstructural visual system changes in AQP4-antibody–seropositive NMOSD,” Neurol. - Neuroimmunol. Neuroinflammation 4, e334 (2017). 10.1212/NXI.0000000000000334 [DOI] [PMC free article] [PubMed] [Google Scholar]
- 6.Oertel F. C., Zimmermann H., Mikolajczak J., Weinhold M., Kadas E. M., Oberwahrenbrock T., Pache F., Bellmann-Strobl J., Ruprecht K., Paul F., Brandt A. U., “Contribution of blood vessels to retinal nerve fiber layer thickness in NMOSD,” Neurol. - Neuroimmunol. Neuroinflammation 4, e338 (2017). 10.1212/NXI.0000000000000338 [DOI] [PMC free article] [PubMed] [Google Scholar]
- 7.Ringelstein M., Albrecht P., Kleffner I., Bühn B., Harmel J., Müller A.-K., Finis D., Guthoff R., Bergholz R., Duning T., Krämer M., Paul F., Brandt A., Oberwahrenbrock T., Mikolajczak J., Wildemann B., Jarius S., Hartung H.-P., Aktas O., Dörr J., “Retinal pathology in susac syndrome detected by spectral-domain optical coherence tomography,” Neurology 85, 610–618 (2015). 10.1212/WNL.0000000000001852 [DOI] [PubMed] [Google Scholar]
- 8.Brandt A. U., Oberwahrenbrock T., Costello F., Fielden M., Gertz K., Kleffner I., Paul F., Bergholz R., Dörr J., “Retinal lesion evolution in Susac syndrome,” Retina 36, 366–374 (2016). 10.1097/IAE.0000000000000700 [DOI] [PubMed] [Google Scholar]
- 9.Roth N. M., Saidha S., Zimmermann H., Brandt A. U., Isensee J., Benkhellouf-Rutkowska A., Dornauer M., Kühn A. A., Müller T., Calabresi P. A., Paul F., “Photoreceptor layer thinning in idiopathic Parkinson’s disease,” Mov. Disord. 29, 1163–1170 (2014). 10.1002/mds.25896 [DOI] [PubMed] [Google Scholar]
- 10.Lui Cheung C. Y., Ikram M. K., Chen C., Wong T. Y., “Imaging retina to study dementia and stroke,” Prog. Retin. Eye Res. 57, 89–107 (2017). 10.1016/j.preteyeres.2017.01.001 [DOI] [PubMed] [Google Scholar]
- 11.Huang D., Swanson E., Lin C., Schuman J., Stinson W., Chang W., Hee M., Flotte T., Gregory K., Puliafito C., Fujimoto J. G., “Optical coherence tomography,” Science 254, 1178–1181 (1991). 10.1126/science.1957169 [DOI] [PMC free article] [PubMed] [Google Scholar]
- 12.Bock M., Brandt A. U., Dörr J., Pfueller C. F., Ohlraun S., Zipp F., Paul F., “Time domain and spectral domain optical coherence tomography in multiple sclerosis: a comparative cross-sectional study,” Multiple Scler. J. 16, 893–896 (2010). 10.1177/1352458510365156 [DOI] [PubMed] [Google Scholar]
- 13.Lang A., Carass A., Hauser M., Sotirchos E. S., Calabresi P. A., Ying H. S., Prince J. L., “Retinal layer segmentation of macular OCT images using boundary classification,” Biomed. Opt. Express 4, 1133 (2013). 10.1364/BOE.4.001133 [DOI] [PMC free article] [PubMed] [Google Scholar]
- 14.Petzold A., Balcer L. J., Calabresi P. A., Costello F., Frohman T. C., Frohman E. M., Martinez-Lapiscina E. H., Green A. J., Kardon R., Outteryck O., Paul F., Schippling S., Vermersch P., Villoslada P., Balk L. J., Aktas O., Albrecht P., Ashworth J., Asgari N., Black G., Boehringer D., Behbehani R., Benson L., Bermel R., Bernard J., Brandt A., Burton J., Calkwood J., Cordano C., Courtney A., Cruz-Herranz A., Diem R., Daly A., Dollfus H., Fasser C., Finke C., Frederiksen J., Garcia-Martin E., Suárez I. G., Pihl-Jensen G., Graves J., Havla J., Hemmer B., Huang S.-C., Imitola J., Jiang H., Keegan D., Kildebeck E., Klistorner A., Knier B., Kolbe S., Korn T., LeRoy B., Leocani L., Leroux D., Levin N., Liskova P., Lorenz B., Preiningerova J. L., Mikolajczak J., Montalban X., Morrow M., Nolan R., Oberwahrenbrock T., Oertel F. C., Oreja-Guevara C., Osborne B., Papadopoulou A., Ringelstein M., Saidha S., Sanchez-Dalmau B., Sastre-Garriga J., Shin R., Shuey N., Soelberg K., Toosy A., Torres R., Vidal-Jordana A., Waldman A., White O., Yeh A., Wong S., Zimmermann H., “Retinal layer segmentation in multiple sclerosis: a systematic review and meta-analysis,” The Lancet Neurol. 16, 797–812 (2017). 10.1016/S1474-4422(17)30278-8 [DOI] [PubMed] [Google Scholar]
- 15.Martinez-Lapiscina E. H., Arnow S., Wilson J. A., Saidha S., Preiningerova J. L., Oberwahrenbrock T., Brandt A. U., Pablo L. E., Guerrieri S., Gonzalez I., Outteryck O., Mueller A.-K., Albrecht P., Chan W., Lukas S., Balk L. J., Fraser C., Frederiksen J. L., Resto J., Frohman T., Cordano C., Zubizarreta I., Andorra M., Sanchez-Dalmau B., Saiz A., Bermel R., Klistorner A., Petzold A., Schippling S., Costello F., Aktas O., Vermersch P., Oreja-Guevara C., Comi G., Leocani L., Garcia-Martin E., Paul F., Havrdova E., Frohman E., Balcer L. J., Green A. J., Calabresi P. A., Villoslada P., “Retinal thickness measured with optical coherence tomography and risk of disability worsening in multiple sclerosis: a cohort study,” The Lancet Neurol. 15, 574–584 (2016). 10.1016/S1474-4422(16)00068-5 [DOI] [PubMed] [Google Scholar]
- 16.Cruz-Herranz A., Balk L. J., Oberwahrenbrock T., Saidha S., Martinez-Lapiscina E. H., Lagreze W. A., Schuman J. S., Villoslada P., Calabresi P., Balcer L., Petzold A., Green A. J., Paul F., Brandt A. U., Albrecht P., “The APOSTEL recommendations for reporting quantitative optical coherence tomography studies,” Neurology. 86, 2303–2309 (2016). 10.1212/WNL.0000000000002774 [DOI] [PMC free article] [PubMed] [Google Scholar]
- 17.Chen T. C., “Spectral domain optical coherence tomography in glaucoma: Qualitative and quantitative analysis of the optic nerve head and retinal nerve fiber layer (an AOS thesis),” Transactions Am. Ophthalmol. Soc. 107, 254–281 (2009). [PMC free article] [PubMed] [Google Scholar]
- 18.Pollet-Villard F., Chiquet C., Romanet J.-P., Noel C., Aptel F., “Structure-function relationships with spectral-domain optical coherence tomography retinal nerve fiber layer and optic nerve head measurements structure-function relationships with SD-OCT,” Investig. Ophthalmol. Vis. Sci. 55, 2953 (2014). 10.1167/iovs.13-13482 [DOI] [PubMed] [Google Scholar]
- 19.Chauhan B. C., Danthurebandara V. M., Sharpe G. P., Demirel S., Girkin C. A., Mardin C. Y., Scheuerle A. F., Burgoyne C. F., “Bruch’s membrane opening minimum rim width and retinal nerve fiber layer thickness in a normal white population,” Ophthalmology. 122, 1786–1794 (2017). 10.1016/j.ophtha.2015.06.001 [DOI] [PMC free article] [PubMed] [Google Scholar]
- 20.Enders P., Adler W., Schaub F., Hermann M. M., Dietlein T., Cursiefen C., Heindl L. M., “Novel Bruch’s membrane opening minimum rim area equalizes disc size dependency and offers high diagnostic power for glaucoma,” Investig. Opthalmology & Vis. Sci. 57, 6596 (2016). [DOI] [PubMed] [Google Scholar]
- 21.Kaufhold F., Kadas E. M., Schmidt C., Kunte H., Hoffmann J., Zimmermann H., Oberwahrenbrock T., Harms L., Polthier K., Brandt A. U., Paul F., “Optic nerve head quantification in idiopathic intracranial hypertension by spectral domain oct,” PLOS ONE 7, 1–6 (2012). 10.1371/journal.pone.0036965 [DOI] [PMC free article] [PubMed] [Google Scholar]
- 22.Albrecht P., Blasberg C., Ringelstein M., Müller A.-K., Finis D., Guthoff R., Kadas E.-M., Lagreze W., Aktas O., Hartung H.-P., Paul F., Brandt A. U., Methner A., “Optical coherence tomography for the diagnosis and monitoring of idiopathic intracranial hypertension,” J. Neurol. 264, 1370–1380 (2017). 10.1007/s00415-017-8532-x [DOI] [PubMed] [Google Scholar]
- 23.Galetta S. L., Villoslada P., Levin N., Shindler K., Ishikawa H., Parr E., Cadavid D., Balcer L. J., “Acute optic neuritis,” Neurol. - Neuroimmunol. Neuroinflammation 2, e135 (2015). 10.1212/NXI.0000000000000135 [DOI] [PMC free article] [PubMed] [Google Scholar]
- 24.Petzold A., Wattjes M. P., Costello F., Flores-Rivera J., Fraser C. L., Fujihara K., Leavitt J., Marignier R., Paul F., Schippling S., Sindic C., Villoslada P., Weinshenker B., Plant G. T., “The investigation of acute optic neuritis: a review and proposed protocol,” Nat. Rev. Neurol. 10, 447–458 (2014). 10.1038/nrneurol.2014.108 [DOI] [PubMed] [Google Scholar]
- 25.Syc S. B., Warner C. V., Saidha S., Farrell S. K., Conger A., Bisker E. R., Wilson J., Frohman T. C., Frohman E. M., Balcer L. J., Calabresi P. A., “Cup to disc ratio by optical coherence tomography is abnormal in multiple sclerosis,” J. Neurolog. Sci. 302, 19–24 (2011). 10.1016/j.jns.2010.12.011 [DOI] [PMC free article] [PubMed] [Google Scholar]
- 26.Shah A., Wang J. K., Garvin M. K., Sonka M., Wu X., “Automated surface segmentation of internal limiting membrane in spectral-domain optical coherence tomography volumes with a deep cup using a 3D range expansion approach,” in 2014 IEEE 11th International Symposium on Biomedical Imaging (ISBI) (2014), pp. 1405–1408. [Google Scholar]
- 27.Miri M. S., Robles V. A., Abràmoff M. D., Kwon Y. H., Garvin M. K., “Incorporation of gradient vector flow field in a multimodal graph-theoretic approach for segmenting the internal limiting membrane from glaucomatous optic nerve head-centered SD-OCT volumes,” Comput. Med. Imaging Graph. 55, 87–94 (2017). 10.1016/j.compmedimag.2016.06.007 [DOI] [PMC free article] [PubMed] [Google Scholar]
- 28.Almobarak F. A., O’Leary N., Reis A. S. C., Sharpe G. P., Hutchison D. M., Nicolela M. T., Chauhan B. C., “Automated segmentation of optic nerve head structures with optical coherence tomography segmentation of optic nerve head structures,” Investig. Ophthalmol. Vis. Sci. 55, 1161 (2014). 10.1167/iovs.13-13310 [DOI] [PubMed] [Google Scholar]
- 29.Keller B., Cunefare D., Grewal D. S., Mahmoud T. H., Izatt J. A., Farsiu S., “Length-adaptive graph search for automatic segmentation of pathological features in optical coherence tomography images,” J. Biomed. Opt. 21, 076015 (2016). 10.1117/1.JBO.21.7.076015 [DOI] [PMC free article] [PubMed] [Google Scholar]
- 30.Novosel J., Vermeer K. A., de Jong J. H., Wang Z., van Vliet L. J., “Joint segmentation of retinal layers and focal lesions in 3-D OCT data of topologically disrupted retinas,” IEEE Transactions on Med. Imaging 36, 1276–1286 (2017). 10.1109/TMI.2017.2666045 [DOI] [PubMed] [Google Scholar]
- 31.Novosel J., Thepass G., Lemij H. G., de Boer J. F., Vermeer K. A., van Vliet L. J., “Loosely coupled level sets for simultaneous 3D retinal layer segmentation in optical coherence tomography,” Med. Image Analysis 26, 146–158 (2015). 10.1016/j.media.2015.08.008 [DOI] [PubMed] [Google Scholar]
- 32.Novosel J., Wang Z., de Jong H., Vermeer K. A., van Vliet L. J., “Loosely coupled level sets for retinal layers and drusen segmentation in subjects with dry age-related macular degeneration,” in Medical Imaging 2016: Image Processing, Styner M. A., Angelini E. D., eds. (SPIE, 2016). [Google Scholar]
- 33.Novosel J., Wang Z., de Jong H., van Velthoven M., Vermeer K. A., van Vliet L. J., “Locally-adaptive loosely-coupled level sets for retinal layer and fluid segmentation in subjects with central serous retinopathy,” in 2016 IEEE 13th International Symposium on Biomedical Imaging (ISBI) (IEEE, 2016). [Google Scholar]
- 34.Carass A., Lang A., Hauser M., Calabresi P. A., Ying H. S., Prince J. L., “Multiple-object geometric deformable model for segmentation of macular OCT,” Biomed. Opt. Express 5, 1062 (2014). 10.1364/BOE.5.001062 [DOI] [PMC free article] [PubMed] [Google Scholar]
- 35.Fang L., Cunefare D., Wang C., Guymer R. H., Li S., Farsiu S., “Automatic segmentation of nine retinal layer boundaries in OCT images of non-exudative AMD patients using deep learning and graph search,” Biomed. Opt. Express 8, 2732 (2017). 10.1364/BOE.8.002732 [DOI] [PMC free article] [PubMed] [Google Scholar]
- 36.Roy A. G., Conjeti S., Karri S. P. K., Sheet D., Katouzian A., Wachinger C., Navab N., “ReLayNet: retinal layer and fluid segmentation of macular optical coherence tomography using fully convolutional networks,” Biomed. Opt. Express 8, 3627 (2017). 10.1364/BOE.8.003627 [DOI] [PMC free article] [PubMed] [Google Scholar]
- 37.Noh H., Hong S., Han B., “Learning deconvolution network for semantic segmentation,” in 2015 IEEE International Conference on Computer Vision (ICCV) (IEEE, 2015). [Google Scholar]
- 38.Ronneberger O., Fischer P., Brox T., “U-net: Convolutional networks for biomedical image segmentation,” in Lecture Notes in Computer Science (Springer; International Publishing, 2015), pp. 234–241. 10.1007/978-3-319-24574-4_28 [DOI] [Google Scholar]
- 39.He Y., Carass A., Yun Y., Zhao C., Jedynak B. M., Solomon S. D., Saidha S., Calabresi P. A., Prince J. L., “Towards topological correct segmentation of macular OCT from cascaded FCNs,” in Fetal, Infant and Ophthalmic Medical Image Analysis (Springer; International Publishing, 2017), pp. 202–209. 10.1007/978-3-319-67561-9_23 [DOI] [PMC free article] [PubMed] [Google Scholar]
- 40.Chan T. F., Vese L. A., “Active contours without edges,” IEEE Trans. Image Process. 10, 266–277 (2001). 10.1109/83.902291 [DOI] [PubMed] [Google Scholar]
- 41.Wang L., Li C., Sun Q.-S., Xia D.-S., Kao C.-Y., “Active contours driven by local and global intensity fitting energy with application to brain MR image segmentation,” Comp. Med. Imag. Graph. 33, 520–531 (2009). 10.1016/j.compmedimag.2009.04.010 [DOI] [PubMed] [Google Scholar]
- 42.Kass M., Witkin A., Terzopoulos D., “Snakes: Active contour models,” International Journal of Computer Vision 1, 321–331 (1988). 10.1007/BF00133570 [DOI] [Google Scholar]
- 43.Mumford D., Shah J., “Optimal approximations by piecewise smooth functions and associated variational problems,” Commun. Pure Appl. Math. 42, 577–685 (1989). 10.1002/cpa.3160420503 [DOI] [Google Scholar]
- 44.Sethian J., “Level Set Methods: An Act of Violence,” American Scientist; (1997). [Google Scholar]
- 45.Sethian J., Level Set Methods and Fast Marching Methods: Evolving Interfaces in Computational Geometry, Fluid Mechanics, Computer Vision, and Materials Science, Cambridge Monographs on Applied and Computational Mathematics (Cambridge University Press, 1999). [Google Scholar]
- 46.Taha A. A., Hanbury A., “Metrics for evaluating 3d medical image segmentation: analysis, selection, and tool,” BMC Med. Imaging 15, 29 (2015). 10.1186/s12880-015-0068-x [DOI] [PMC free article] [PubMed] [Google Scholar]
- 47.Das S., Abraham A., Chakraborty U. K., Konar A., “Differential Evolution Using a Neighborhood-Based Mutation Operator,” IEEE Trans. Evol. Comput. 13, 526–553 (2009). 10.1109/TEVC.2008.2009457 [DOI] [Google Scholar]
- 48.Jansen C., Witt M., Krefting D., Employing Docker Swarm on OpenStack for Biomedical Analysis(Springer; International Publishing, 2016), p. 303–318. [Google Scholar]
- 49.Eaton J. W., Bateman D., Hauberg S., Wehbring R., GNU Octave version 4.0.0 manual: a high-level interactive language for numerical computations (2015).
- 50.R Core Team , R: A Language and Environment for Statistical Computing, R Foundation for Statistical Computing, Vienna, Austria: (2017). [Google Scholar]
- 51.Garvin M. K., Abramoff M. D., Wu X., Russell S. R., Burns T. L., Sonka M., “Automated 3D intraretinal layer segmentation of macular spectral-domain optical coherence tomography images,” IEEE Transactions on Med. Imaging 28, 1436–1447 (2009). 10.1109/TMI.2009.2016958 [DOI] [PMC free article] [PubMed] [Google Scholar]
- 52.Hu Z., Abràmoff M. D., Kwon Y. H., Lee K., Garvin M. K., “Automated segmentation of neural canal opening and optic cup in 3d spectral optical coherence tomography volumes of the optic nerve head,” Investig. Ophthalmol. Vis. Sci. 51, 5708 (2010). 10.1167/iovs.09-4838 [DOI] [PMC free article] [PubMed] [Google Scholar]
- 53.Lee K., Niemeijer M., Garvin M. K., Kwon Y. H., Sonka M., Abràmoff M. D., “Segmentation of the optic disc in 3D OCT scans of the optic nerve head,” IEEE Trans Med Imaging 29, 159–168 (2010). 10.1109/TMI.2009.2031324 [DOI] [PMC free article] [PubMed] [Google Scholar]
- 54.Anthony B. J., Abràmoff M. D., Lee K., Sonkova P., Gupta P., Kwon Y., Neimeijer M., Hu Z., Garvin M. K., “Automated 3D segmentation of intraretinal layers from optic nerve head optical coherence tomography images,” Proc. SPIE 7626, 76260 (2010). 10.1117/12.843928 [DOI] [Google Scholar]
- 55.Antony B. J., Miri M. S., Abràmoff M. D., Kwon Y. H., Garvin M. K., “Automated 3d segmentation of multiple surfaces with a shared hole: Segmentation of the neural canal opening in SD-OCT volumes,” Med Image Comput. Comput. Assist. Interv 17, 739–746 (2014). [DOI] [PMC free article] [PubMed] [Google Scholar]
- 56.Miri M. S., Lee K., Niemeijer M., Abràmoff M. D., Kwon Y. H., Garvin M. K., Multimodal segmentation of optic disc and cup from stereo fundus and SD-OCT images, Proc. SPIE 8669, 86690 (2013). 10.1117/12.2007010 [DOI] [Google Scholar]
- 57.Miri M. S., Abràmoff M. D., Lee K., Niemeijer M., Wang J. K., Kwon Y. H., Garvin M. K., “Multimodal segmentation of optic disc and cup from sd-oct and color fundus photographs using a machine-learning graph-based approach,” IEEE Transactions on Med. Imaging 34, 1854–1866 (2015). 10.1109/TMI.2015.2412881 [DOI] [PMC free article] [PubMed] [Google Scholar]
- 58.Antony B. J., Abràmoff M. D., Harper M. M., Jeong W., Sohn E. H., Kwon Y. H., Kardon R., Garvin M. K., “A combined machine-learning and graph-based framework for the segmentation of retinal surfaces in SD-OCT volumes,” Biomed. Opt. Express 4, 2712 (2013). 10.1364/BOE.4.002712 [DOI] [PMC free article] [PubMed] [Google Scholar]
- 59.Kadas E. M., Kaufhold F., Schulz C., Paul F., Polthier K., Brandt A. U., 3D Optic Nerve Head Segmentation in Idiopathic Intracranial Hypertension(Springer; Berlin Heidelberg, 2012), pp. 262–267. [Google Scholar]
- 60.Albrecht P., Blasberg C., Lukas S., Ringelstein M., Müller A.-K., Harmel J., Kadas E.-M., Finis D., Guthoff R., Aktas O., Hartung H.-P., Paul F., Brandt A. U., Berlit P., Methner A., Kraemer M., “Retinal pathology in idiopathic moyamoya angiopathy detected by optical coherence tomography,” Neurology 85, 521–527 (2015). 10.1212/WNL.0000000000001832 [DOI] [PubMed] [Google Scholar]


