Abstract
Laser speckle contrast imaging (LSCI) utilizes the speckle pattern of a laser to determine the blood flow in tissues. The current approaches for its use in a clinical setting require a camera system with a laser source on a separate optical axis making it unsuitable for minimally invasive surgery (MIS). With blood flow visualization, bowel viability, for example, can be determined. Thus, LSCI can be a valuable tool in gastrointestinal surgery. In this work, we develop the first-of-its-kind dual-display laparoscopic vision system integrating LSCI with a commercially available 10mm rigid laparoscope where the laser has the same optical axis as the laparoscope. Designed for MIS, our system permits standard color RGB, label-free vasculature imaging, and fused display modes. A graphics processing unit accelerated algorithm enables the real-time display of three different modes at the surgical site. We demonstrate the capability of our system for imaging relative flow rates in a microfluidic phantom with channels as small as 200 μm at a working distance of 1–5 cm from the laparoscope tip to the phantom surface. Using our system, we reveal early changes in bowel perfusion, which are invisible to standard color vision using a rat bowel occlusion model. Furthermore, we apply our system for the first time for imaging intestinal vasculature during MIS in a swine.
1. Introduction
Intraoperative evaluation of bowel viability is important during abdominal surgery [1]. For example, it is estimated that 1 out of every 1000 acute hospital admissions in the United States and Europe will suffer from acute mesenteric ischemia (AMI) [2]. Surgical intervention is the definitive treatment. Surgeons must resect a bowel with non-viable perfusion while leaving maximal healthy intestine. A missed, non-viable bowel segment can lead to sepsis and death, whereas removing excessive bowel may cause short bowel syndrome (SBS). Therefore, accurate determination of bowel perfusion and viability is essential.
Many methods exist to assess bowel viability such as general visualization, palpation, Doppler ultrasound, laser Doppler, and infrared fluorescence angiography. However, they have not been standardized to produce the best clinical outcome [1]. For example, serosal visualization and palpation of the mesenteric pulsation are estimates and subject to the experience of the surgeon. Palpation is also limited to open surgery, making determination of the bowel viability even harder in laparoscopic surgery or minimally invasive surgery (MIS). Fluorescence angiography using indocyanine green (ICG) dye has been studied as a good alternative for the visualization of bowel perfusion and vascular structures in laparoscopic and robot-assisted surgery [3]. However, this method requires injection of dye, temporally limiting its operation within short (seconds) intervals after the injection.
Concurrently, laser speckle contrast imaging (LSCI) is a noninvasive vascular/tissue perfusion imaging technique, which calculates the speckle contrast from monochromatic light illumination and has been well studied in various clinical applications such as neurosurgery [4]. Unlike fluorescence angiography, LSCI permits a seamless visualization of the blood flow and does not require injection of contrast agents. Laparoscopic implementation of LSCI faces difficulties due to several technical issues including laser light source integration, fiber light guide coupling, and specular reflections from the tissue surfaces. Numerous rigid endoscopic LSCI systems have been explored by several research groups [5–8]. However, their systems are designed for different application areas and thus have limitations that make them unsuitable for minimally invasive surgery. For example, the system presented by Santos et al. is limited by the need for a laser source located on a separate optical axis [5]. Meanwhile, the LSCI system by Bray et al. was not designed to visualize flows in individual vasculature [6]. The other systems described were specifically built to study rodent anatomy, therefore requiring a shorter working distance or direct contact with tissue [7,8]. In short, there is currently no suitable system for application to minimally invasive abdominal surgery.
In this work, we introduce a system integrating single-exposure LSCI with a commercially available laparoscope without the need for a laser source positioned at a different optical axis. We use a light source unit that contains both visible light and a near-infrared laser source coupled to a single rigid laparoscope via a fiber-optic light guide. Our system is capable of operating in a 1–5 cm working distance, characterized on in vitro phantom experiments. A multi-threaded graphics processing unit (GPU) is used to process raw speckle images into flow maps in real time. LSCI is then displayed with standard color vision. We fabricate a custom microfluidic flow phantom to test the characteristics of the system and validate the system performance through animal studies. A rat model is used to demonstrate small bowel mesenteric ischemia. We also demonstrate the application of our system in a laparoscopic surgery using a swine model. To the best of our knowledge, this is the first demonstration of a dual-display laparoscopic LSCI system in a minimally invasive setting.
2. Materials and methods
2.1. Laparoscopic LSCI system
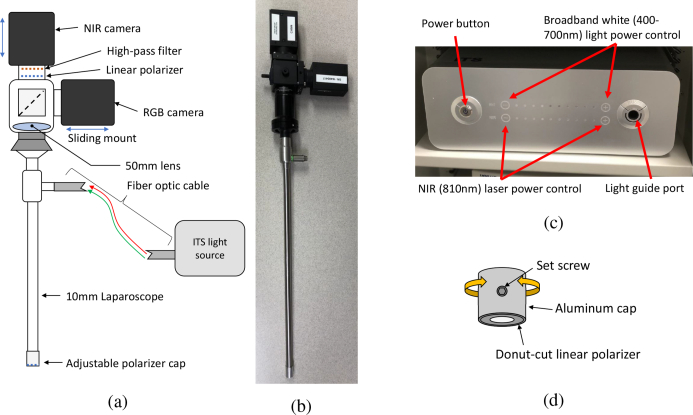
Figure 1 displays our system setup. A zero-degree 10-mm laparoscope (LAPALUX-Telescope 0°, MGB, Germany) is coupled to two cameras via a 50/50 beam splitter (BSW26R, Thorlabs, USA) attached to a Schoelly c-mount adapter (20.413 TV Adapter, Schoelly, Germany). The internal lens components of the adapter are removed to accommodate the laparoscope, and a 50-mm achromatic (AC254-050-B-ML, Thorlabs, USA) lens is placed in front of the beam splitter. The beam splitter divides the optical path to an RGB camera (HD Color Vision GS3-U3-41C6C-C FLIR, PointGrey, USA) and a near-infrared (NIR) camera (GS3-U3-41C6NIR-C FLIR, PointGrey, USA), enabling simultaneous capture of both standard color and NIR laser speckle images. An 800nm long-pass filter (FEL0800-Ø1” Longpass Filter, Thorlabs, USA) is placed in front of the NIR camera to isolate the signal from the laser source.
Fig. 1.
Overview of the laparoscopic LSCI system. (a) Schematic of the laparoscope system. (b) Image of the laparoscope with the cameras attached. (c) InTheSmart(ITS) dual light source. (d) Rotatable linear polarizer cap.
The NIR camera operates with a 2048x2048 pixel resolution and has an adjustable frames-persecond (FPS) range up to 90 depending on the selected exposure time. The data format of the NIR camera is set as MONO16 for a 16-bit depth greyscale image. The RBG camera operates with a 2048x2048 pixel resolution and was set to capture at 30 FPS; the data format of the RGB camera is set to RAW16 for a 16-bit depth in each channel of the RGB image. The two cameras are mounted on the Thorlabs cage plates (CP02-SM1-Threaded 30 mm Cage Plate, Thorlabs, USA), and can be manually focused by sliding them along their mounting rails.
When necessary, a crossed polarizer pair is used to reduce the specular reflection onto the camera. A linear polarizer (LPNIRE100-B, Thorlabs, USA) is placed in front of the long-pass filter. A second linear polarizer (Wire-grid polarizing film #33082, Edmund Optics, USA) is laser cut (Epilog Mini 40W, Trotec, Austria) from the film into a donut shape, covering only the illumination fibers of the laparoscope and not the lens tube. It is attached to a rotatable cap, which is then fastened to the tip of the laparoscope (Fig. 1(d)). The polarizer on the tip of the laparoscope is rotated until the specular reflection is minimized.
To illuminate the tissue, we used a clinically available (FDA approved) power-adjustable dual light source (ITSEL1711, InTheSmart Incorporated, USA) consisting of a visible spectrum (400–700 nm) high-power quad-LED and a NIR (810nm) laser, which share a common optical path (Fig. 1(c)). This source is then coupled to the illumination port of the laparoscope via a fiber-optic light guide cable (ITSEL1711-LGCBL-V01, InTheSmart Incorporated, USA). The maximum laser power is 1 W. The power of the visible and laser source can be separately controlled on a 0–100% scale in steps of 10%. To ensure tissue safety and prevent pixel saturation, the laser power measured 5 cm from the tip of the laparoscope was set as ≤ 50 mW, corresponding to a maximum power setting of 30%. Because the laser power could not be fine–tuned, the camera exposure times were set in a range between 8–25 ms to adjust the received signal. We find that this range of exposure times well demonstrates the capabilities of our system, and falls within a general range of the working exposure times demonstrated by Yuan et al. [9].
2.2. Image analysis
Imaged speckles are converted to a map of speckle contrast by applying Eq. (1) over some rolling pixel window [10]:
| (1) |
where K is the speckle contrast, σ is the standard deviation of the intensity over the window, and 〈I〉 is the mean intensity over the window. The pixel window can be purely spatial, (a square region of pixels from a single image) [10], temporal (the same pixel over multiple frames in time) [11], or a combination of the two, spatiotemporal (a square region of pixels over multiple frames) [12].
The laser speckle contrast is not directly proportional to blood flow velocity v; it is instead related to the decorrelation time of the speckle intensity fluctuations, τc, which is assumed to be inversely proportional to the flow [10]:
| (2) |
The speckle contrast is related to τc through Eq. (3) [13]:
| (3) |
where K is the speckle contrast, τc is the correlation time, T is the shutter speed, and β is a correction factor that accounts for the polarization and differences between the detector and speckle size. In theory, τc can be quantitatively related to the absolute blood flow rate [13]. However, many simplifying assumptions are made in the formulation of Eqs. (2) and (3) [10,14–16]. Therefore, in a real-world application, LSCI is restricted to creating maps of relative blood flow rather than determination of the absolute blood flow.
In cases where integration time T is much longer than correlation time τc (T/τc > 100), the inverse the of squared contrast can be approximated to be proportional to the flow velocity [17–19]:
| (4) |
Cheng et al. reported that in vivo values for T/τc typically lie between 100–400, within an acceptable range for the use of this approximation [19].
In this work, our system utilizes Eq. (4) to relate the speckle contrast to some measure of velocity. We utilize two different kernels to produce speckle contrast values. In the system used for real-time in vivo measurements, we utilize a 7×7 spatial window. A 7×7 spatial window has been widely settled upon as a good medium between spatial resolution and accuracy of estimated speckle contrast [13]. Additionally, our real-time system allows us to temporally blend a user-defined number of flow maps together to increase signal to noise ratio. For our in vitro measurements, we utilize a 3×3×10 spatiotemporal window for increased spatial resolution.
We choose to utilize different methods of computation for the in vivo and in vitro work due to presence of organ secondary to respiration and cardiac pulsation. This also accounts for the motion encountered during surgery with the movement of the laparoscope. Using a fixed spatiotemporal kernel may result in motion artifacts if the movement between frames is large. Our method of blending spatial windows allows the user to adjust for an appropriate number of frames (large number of frames for increased signal, no blending for lower latency). We set the spatial window size to 7×7 to ensure adequate sampling even if the user chooses to not blend any frames. In vitro, we do not need to worry about movement, and choose to use a spatiotemporal kernel for increased spatial resolution.
2.3. Real-time processing
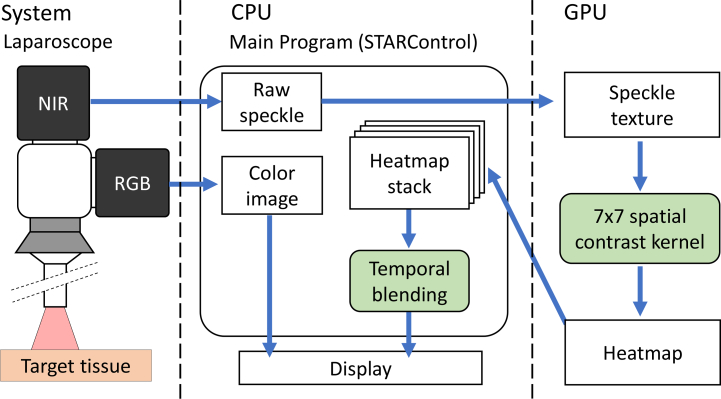
Most LSCI systems display post-processed images owing to the computational time required for serial, high-resolution image processing on a central processing unit (CPU). However, for clinical application, LSCI processing and visualization must be performed in real-time. The independence of each speckle contrast calculation enables the parallelization of the problem onto a GPU, significantly accelerating the processing speeds. Fig. 2 shows our real-time processing framework. Each high-resolution (2048×2048 pixels) image acquired from our NIR camera was transferred as a normalized 32-bit floating point array to the texture memory of the GPU. The inverse of the squared speckle contrast (1/K2) across the image was then calculated using a sliding spatial window of 7×7 pixels. The resulting array of the inverse of the squared speckle contrast was normalized and heat-mapped to a 32-bit integer using a linear colormap. Every 8 bits in the packed integer represents one of the R, B, G, and A channels. Heat maps were then copied from the device back to the host machine and stored in a dynamic buffer capable of holding up to 30 of the most-recently computed heat maps.The stored heat maps were used for equally weighted temporal blending of the alpha channels to increase the signal-to-noise ratio (SNR). The final image is displayed to the user via an OpenGL front end GUI, STARControl [20]. The user controls parameters including the number of blending frames, colormap alpha, colormap gamma, camera exposure time, and camera FPS. Our PC was equipped with an Intel Core i7-4770K Processor, 16 GB RAM, and an Nvidia GeForce GTX 1060Ti 6GB graphics card. At this specification, the system is capable of operating at 89FPS, limited by the camera, with an 11.13 ms processing time per frame. In our previous work, the GPU implementation performed approximately 67.2 times faster than a CPU-only approach, which had a processing time of 748 ms per image and was not sufficient for real-time visualization [20].
Fig. 2.
Processing flowchart for our real-time GPU-based LSCI visualization system.
2.4. System characteristics
The ITS system has a maximum laser power of 1 W, and is adjustable on a 0–100% scale in steps of 10%. We measure the spot power output 5 cm from the laparoscope tip for each laser source setting, shown in Fig. 3. For our experiments, we choose a maximum power of 50 mW from the laparoscope tip, which corresponds to a maximum setting of 30%.
Fig. 3.
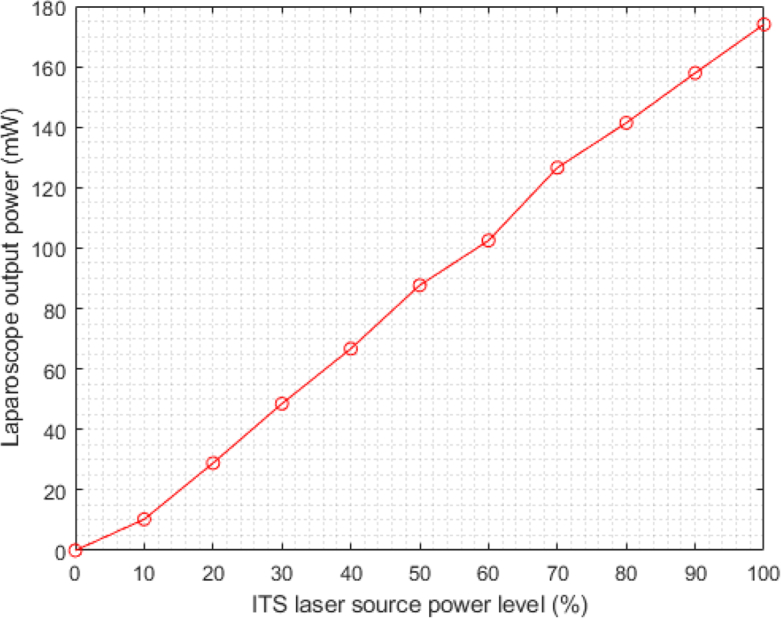
Laser power output from laparoscope measured at a 5 cm distance for each corresponding ITS laser source power setting.
The Field-of-View (FoV) and resolution of the system were measured using a Thorlabs resolution target (R3L3S1P, Thorlabs, USA) and 1cm square grid paper. The FoVs for a 5, 2, and 1cm distance were approximately 7 cm, 3.5 cm, and 2 cm respectively, and the resolutions were 125 μm, 70 μm, and 28 μm, respectively.
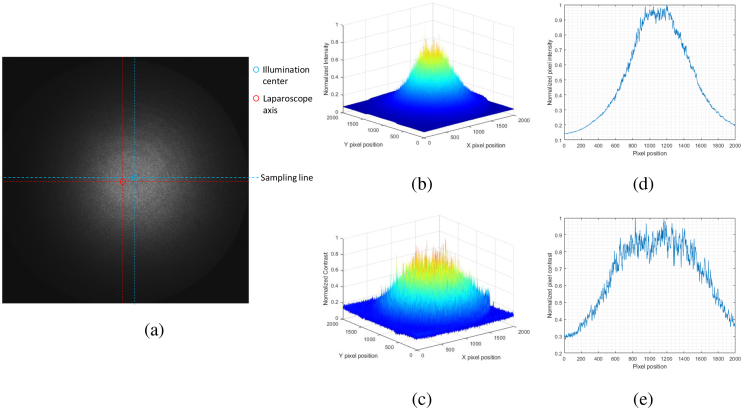
We then show the illumination distribution of the laparoscope system at a 5 cm distance in Fig. 4. The laparoscope was oriented normal to a flat paper surface at a 5 cm distance. As shown in Fig. 4(a), the center of illumination is offset from the actual laparoscope axis. Additionally, the illumination is not even, and is heavily biased to a central region. A surface plot of the intensity versus pixel coordinate is shown in Fig. 4(b), and the profile of intensities sampled across a horizontal line running through the center of intensity (labeled as “Sampling line” in 4(a)) is shown in Fig. 4(d). The intensity drops by over 50% about 500 pixels from the center of illumination and indicates that the lighting is very uneven.
Fig. 4.
Characteristics of system illumination. The laparoscope was placed normal to the paper at a 5 cm distance. (a) Raw NIR image of white paper. The laparoscope axis is marked and compared to the center of illumination. The line along which profiles of intensity and contrast is labeled as “Sampling line”. (b) Surface plot of normalized illumination intensity. (c) Surface plot of normalized contrast values using a 7×7 spatial window. (d) Plot of the normalized illumination intensity for a line sampled across the center of illumination which is marked in Fig 4(a). (e) Plot of the normalized contrast values along the sampling line.
To determine the effects this concentrated illumination might have on speckle contrast, the speckle contrast was calculated according to Eq. (1) using a 7×7 spatial window. A surface plot of the resulting contrast is shown in 4(c), and a profile of the contrasts sampled across “Sampling line” is presented in Fig. 4(e). Ideally, we expect a uniform distribution of speckle contrasts with respect to pixel position given that the surface is flat, non-moving, and is of a consistent material. However, speckle contrast is biased by the mean light intensity, which can affect results [21,22].
2.5. Flow phantom
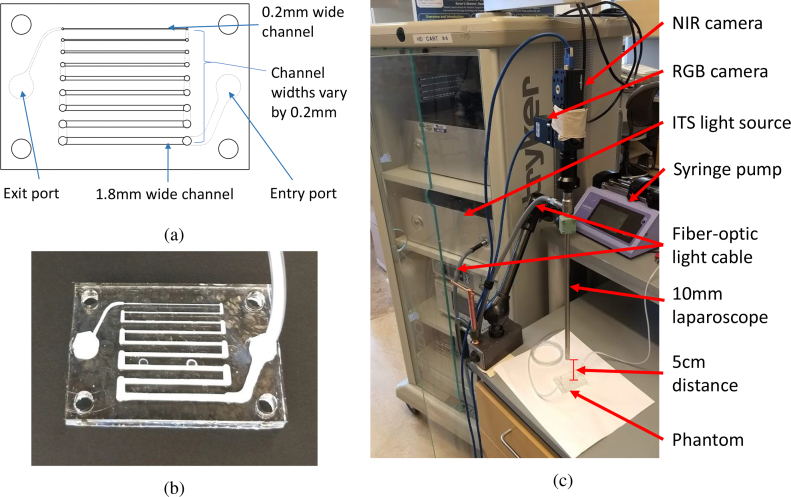
To characterize the ability of our system for resolving fine vessels and imaging the relative flow rates with values similar to those in vivo, we designed and fabricated a custom microfluidic phantom (Fig. 5).
Fig. 5.
Images of the LSCI flow phantom and experimental setup. (a) Microfluidic phantom schematic. Channel widths range from 0.2–1.8 mm in increments of 0.2 mm. (b) Fabricated acrylic flow phantom infused with Intralipid. (c) in vitro phantom experimental setup.
A schematic of our microfluidic phantom is shown in Fig. 5(a). It consists of rectangular channels ranging between 0.2–1.8 mm in width. The channel widths are chosen as approximately the diameter range of the vessels commonly encountered during surgery [23]. The phantom is comprised of cast acrylic sheets laser-machined using a commercial laser engraver (Trotec, Epilog Mini, 40w). Channels are created using through cuts on 1/16-in. (1 in. = 2.54 cm) thick layers, and the width of the channels ranges from 0.2–1.8 mm in increments of 0.2 mm. To seal the phantom, the channels are sandwiched between a 1/16-in. thick acrylic cover and a 3/16-in. thick acrylic base. A stack of acrylic layers is then clamped between two aluminum plates, and the entire assembly is placed on a hotplate and heated to 150°C for 1 h, allowing the acrylic to bond and seal the phantom. Subsequently, the assembly is allowed to cool to room temperature, and then unclamped and the phantom removed. Finally, holes for tubing are drilled, and the phantom is coupled to a syringe pump (Pump 11 Elite Infusion/Withdrawal Programmable Single Syringe, Harvard Apparatus, USA) via Polyvinyl chloride (PVC) tubing. The fabricated phantom is presented in Fig. 5(b).
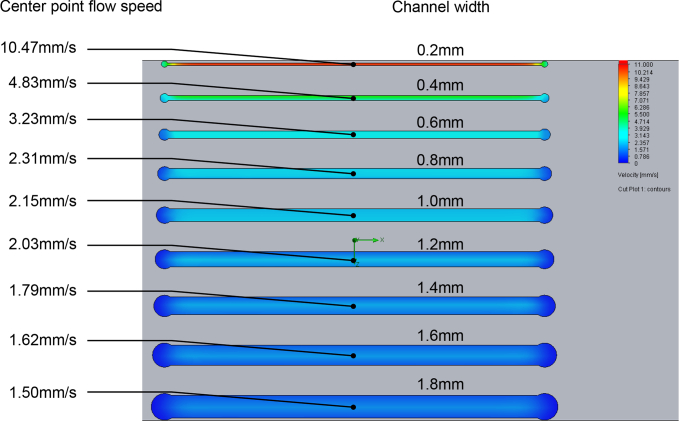
The phantom was infused with a 4.5%v/v dilution of Intralipid 30% and water, which approximates the scattering properties of whole blood at 810nm [24–27]. Computational fluid dynamics (CFD) was performed on the phantom using SolidWorks Flow Simulation to determine the corresponding flow velocities in each channel. The fluid is approximated as water, and the channel roughness is estimated at 0.5 μm [28]. The inlet volumetric flow rates were set as 0, 0.2, 0.4, 0.6, 0.8, and 1.0 mL/min. For each channel, the flow speed was sampled from a single point, centered about the width and length of each channel at a depth of 1/4 the channel thickness, approximately 0.4 mm below the top surface. The resulting flow speeds of the center point ranged from 0–52.55 mm/s, depending on the cross-sectional area of the channel, which reflects a practical range of in vivo blood velocities [29]. The syringe pump was then set to infuse at the same volumetric rates for the in vitro experiment.
For imaging, the laparoscope tip was fixed normal to the phantom surface at a 5 cm distance using a table-mounted positioning arm (Articulated Holder FAT MA61003, Noga, Israel). This represents a typical working distance that a 10mm laparoscope would be held from tissue during MIS [30]. The NIR camera exposure time was set as 8 ms, and the images were processed using a 3 ×3×10 spatiotemporal kernel. The experimental set-up is displayed in Fig. 5(c).
2.6. Rat study protocol (n=4)
All procedures were performed in the animal research facility with the approval of the Institutional Animal Care and Use Committee at the Children’s National Health System (protocol #30597).
Four female 250–300 g Sprague-Dawley rats from Charles River Laboratories (Wilmington, Massachusetts, USA) were used. Anesthesia was induced using 3% isoflurane and maintained using intramuscular injections of 2 mg/kg xylaxine and 75 mg/kg ketamine. The rats were placed in a supine position, and a mid-line laparotomy was performed to expose the abdominal organs. Given the small size of the organs of the rat, the laparoscope was supported above each rat at a distances of 1.5–3 cm from the tip to the regions of interest (ROIs) to better capture the organs within the imaging field-of-view and increase the image resolution.
Bowel ischemia was created by clamping a segment of the small intestine using two clamps placed across the bowel and occluding the arterial arcade, whereas a third clamp was placed on the feeding mesenteric vessel. This allowed for the control of the perfusion of the bowel segment with adjustment of the mesenteric clamp only. The occlusion duration was limited to a 30 s window, with at least 60 s in-between subsequent mesenteric clamping for recovery.
Real-time LSCI results were recorded during the experiment. Imaging was performed both with and without the polarizers for an exposure time between 10–25 ms. All the animals were euthanized per protocol after the experimental completion.
2.7. Pig study protocol (n=2)
All procedures were performed in an animal research facility under the approval of the Institutional Animal Care and Use Committee at the Children’s National Health System (protocol #30591).
To better correlate to an MIS experience, we performed laparoscopic surgeries in swine. Two 25–30 kg female Yorkshire pigs from Archer Farms (Darling, Maryland, USA) were used for the experiment. The pigs were sedated using an intramuscular injection of xylazine and ketamine, and anesthesia was maintained using 2.5% isoflurane. A 12-mm trocar was placed at the umbilicus as a camera port. The abdomen was insufflated at 8 mmHg with CO2. Laparoscopic LSCI was used to image perfusion of various structures at 10–25 ms exposure times, including the bowel, abdominal wall, and gallbladder. Owing to the difficulty in inserting the laparoscope through the trocar with the polarizers attached and fog forming on the polarizers in the abdomen, the polarizers were not used during the pig study.
3. Results
3.1. Flow phantom
Our system was able to differentiate the fluid flow rates and vessel sizes mimicking those found in vivo at a 5-cm working distance and exposure time of 8 ms. The phantom contained channels ranging from 0.2–1.8 mm in width, reflecting the typical encountered blood vessel diameters [23]. The phantom was driven at six volumetric flow rates from 0–1.0 mL/min.
3.1.1. CFD simulation
A CFD simulation was performed to determine the expected flow speed in each channel. The flow speeds were calculated by sampling a single point in each channel. The points were centered about the width and length of each channel at a depth of 1/4 the channel height, approximately 0.4 mm. The results for a 0.2 mL/min volumetric input are shown in Fig. 6. The resulting flow speeds across all the channels and volumetric flow rates cover a range of 0–52.55 mm/s, which approximates the expected range for the in vivo blood flow [29]. A detailed list of the flow speeds under each condition is listed in Table 1.
Fig. 6.
CFD simulation results for a microfluidic phantom at an inlet volumetric flow of 0.2 mL/min.
Table 1.
Calculated flow speed (mm/s) in each channel for each of the 6 volumetric flow rates.
| Expected flow velocity (mm/s) in each phantom channel | ||||||||||
|---|---|---|---|---|---|---|---|---|---|---|
|
| ||||||||||
| Channel width (mm) | ||||||||||
|
| ||||||||||
| 0.2 | 0.4 | 0.6 | 0.8 | 1.0 | 1.2 | 1.4 | 1.6 | 1.8 | ||
|
| ||||||||||
| Volumetric rate (mL/min) | 0 | 0 | 0 | 0 | 0 | 0 | 0 | 0 | 0 | 0 |
| 0.2 | 10.47 | 4.83 | 3.23 | 2.31 | 2.15 | 2.03 | 1.79 | 1.62 | 1.50 | |
| 0.4 | 21.02 | 9.67 | 6.45 | 4.62 | 4.30 | 4.07 | 3.58 | 3.24 | 3.01 | |
| 0.6 | 31.53 | 14.50 | 9.68 | 6.93 | 6.44 | 6.10 | 5.36 | 4.85 | 4.51 | |
| 0.8 | 42.04 | 19.36 | 12.09 | 9.25 | 8.59 | 8.14 | 7.16 | 6.47 | 6.01 | |
| 1.0 | 52.55 | 24.22 | 16.13 | 11.57 | 10.73 | 10.17 | 8.94 | 8.09 | 7.51 | |
3.1.2. Relative flow speed comparisons for a single frame
The laparoscope was oriented normal to the surface of the microfluidic phantom and fixed a distance of 5 cm. Each captured image was processed using a spatiotemporal window of 3×3×10 to calculate speckle contrast. Subsequently, the flow velocity in arbitrary units, which we refer to in laser speckle perfusion units, was calculated using the inverse of squared speckle contrast described in Eq. (4). For the smallest nonzero flow rate of 0.2 mL/min, we are able to visualize all channels except for the 1.8 mm channel (Fig. 7).
Fig. 7.
Visualization of all channels at a 5 cm range at 0.2mL/min.
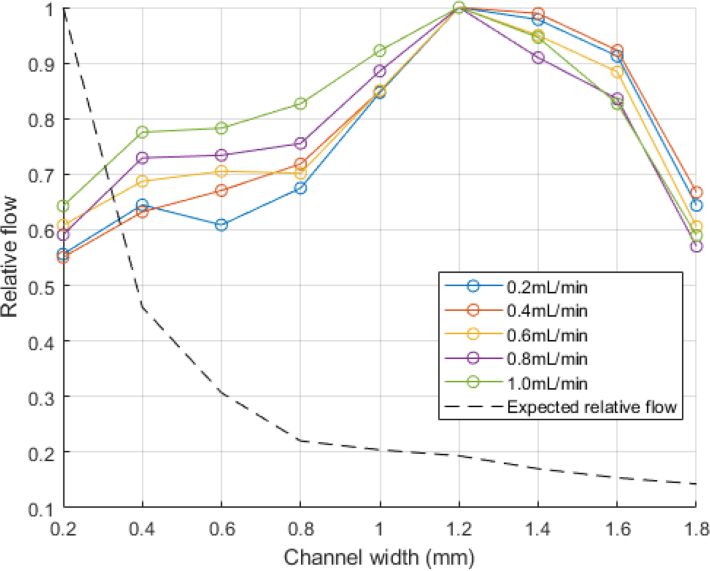
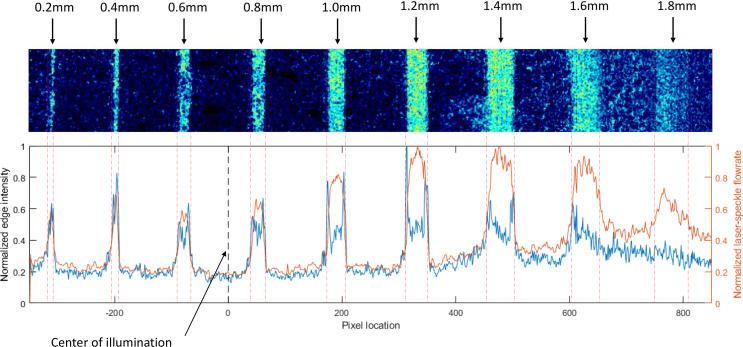
Flow in laser speckle perfusion units was then calculated from a rectangular region centered within the channel. The measured flow was normalized and compared to the expected relative flow based on the CFD computed flow speeds. This was repeated for each of the 5 nonzero volumetric flow inputs, and is shown in Fig. 8. The measured flow profiles are shown in Fig. 9.
Fig. 8.
Relative flow rates compared to the expected relative flow rates at all the channel sizes and volumetric flow rate inputs.
Fig. 9.
Left axis: Normalized edge intensity values resulting from the convolution of a 5×5 Gaussian derivative filter in the x-direction. Right axis: Normalized measured flow profile along the width of the image.
Figs. 7 and 8 demonstrate that the relative flow rates of the channels do not follow the expected trend calculated by the CFD. This is an important restriction of the current system: contrast values are heavily biased by the distribution of light from the laparoscope. As described in section 2.4, the contrast across a stationary, uniform white piece of paper is biased by the light distribution from the laparoscope (Fig. 4).
This point is best illustrated by the 1.6 and 1.8 mm channels, which are more difficult to differentiate from background noise. This is quantified by passing a 5×5 gaussian derivative kernel in the x-direction across the array of laser speckle perfusion values used to generate Fig. 7. This results in the detection of vertical edges, and the resulting edge signals are normalized and shown in Fig. 9 for the 0.2mL/min volumetric input data. It is apparent that the 1.8mm channel has no clear edges, and the 1.6mm channel does not have a clear right-side edge. Relating Fig. 4(d) to Fig. 7, the 1.6 and 1.8 mm channels are located further than 500 pixels from the illumination center, where the lighting intensity has dropped by over 50%.
In conclusion, for a single frame, we are unable to compare the relative flow speeds between different locations in the image due to the illumination distribution bias.
3.1.3. Relative flow speed comparisons over time
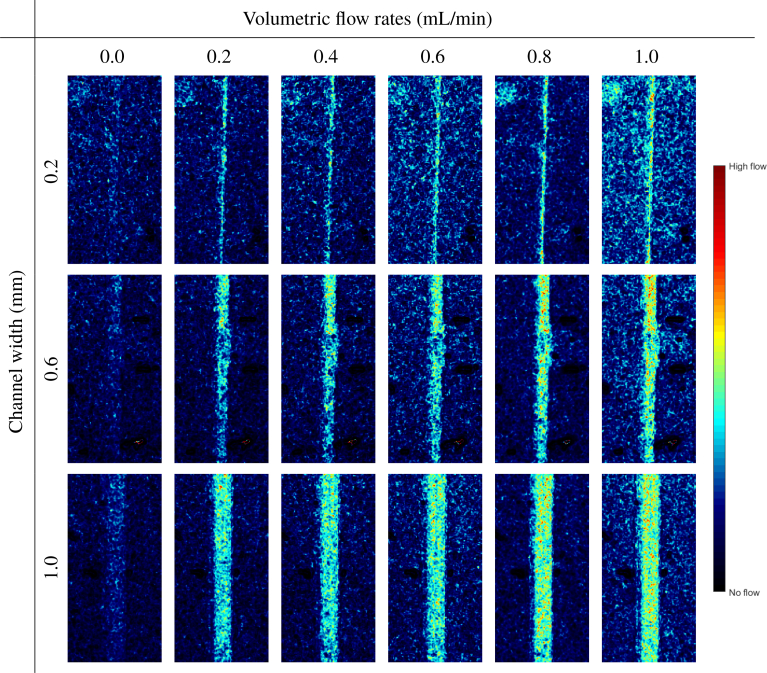
When we compare the same locations over multiple frames in time, we are able to show the appropriate relative flow rates. Individual examination of each channel separately over the range of the six flow rates provides a qualitative and visual indication of the increasing flow for all the channels except the 1.6 and 1.8 mm channels, which are limited by the illumination intensity. The processed images for the 0.2, 0.6, and 1.0 mL channels are displayed in Fig. 10. The granules present in some of the images are probably owing to the vibration from the laparoscope.
Fig. 10.
Display of the LSCI-processed images in the 0.2, 0.6, and 1.0-mm channels at all the six flow rates using a linear colormap. For each channel width, the increasing flow rate can be clearly distinguished.
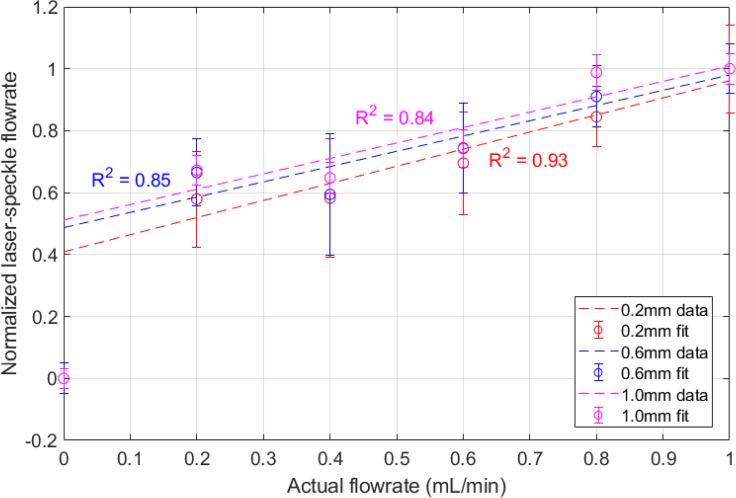
We then select a square region of pixels centered in the channel and calculate the mean of the laser speckle perfusion in the selected region. At 0 mL/min, measurements of the laser speckle perfusion units (1/K2) are larger than that of the solid background, so that the channels are still visible when there is no flow (Fig. 10). This is because in comparison to the solid background, the fluid in the channels still has a slight movement from Brownian motion [31]. To appropriately compare the relative flow rates for each channel, the calculated velocities are shifted by the zero offset and then normalized. There is a jump between the 0 and 0.2mL/min input flow rates, but for non-zero flow rates, the calculated relative flow rates in each channel appear to linearly increase with the actual flow rate (Fig. 11).
Fig. 11.
Normalized relative flows calculated from LSCI and Eq. (4) compared to the actual flow rates for 0.2, 0.6, and 1.0mm wide channels.
3.2. Rat bowel ischemia
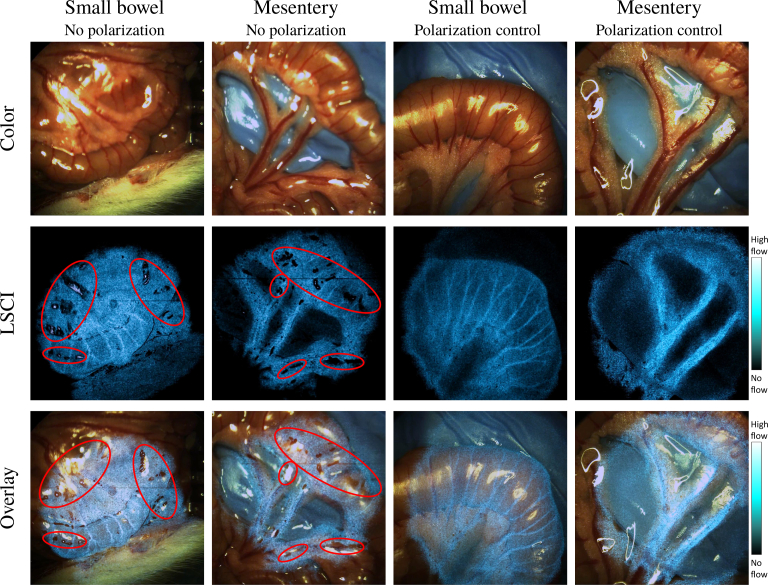
Imaging of various rat organs demonstrates that our system is able to acquire color images, LSCI processed images, and overlaid images for an augmented surgical field-of-view in real time (Fig. 12). Our LSCI images clearly highlight vascular structures. We also demonstrate the effectiveness of polarization control. As shown, Fig. 12 contrasts the LSCI-processed images of the small bowel and mesentery with and without polarization control. Compared to the images of the same regions with polarization control, the unpolarized LSCI images have many shadow spots, which are a result of the saturated pixels omitted from the final visualization.
Fig. 12.
Images captured of the small bowel and mesentery. Shown are color, LSCI-processed, and LSCI overlay images for the samples taken both with and without polarization control. Note the presence of grainy shadow spots distributed in the laser-speckle processed-images captured without polarization control circled in red. With polarization control, the shadows are absent. The small bowel visualization is presented in Visualization 1 (9.8MB, mp4) . Note that the transparency of the overlay is not factored into the display of the color bar.
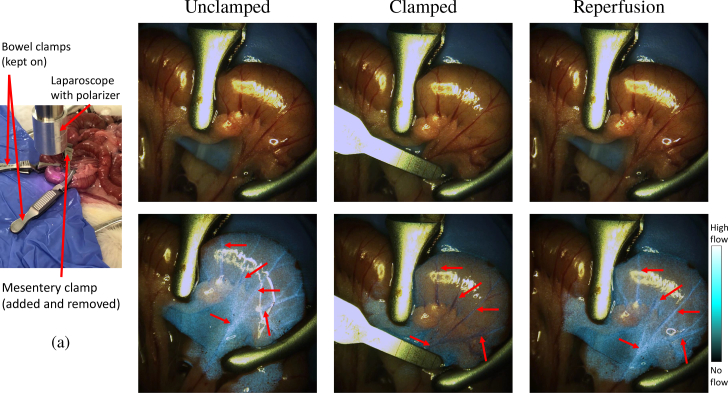
The system distinguishes between normal and ischemic tissues before early changes in the tissue color become fully developed. In this experiment, we used clamps to the obstruct blood flow in a section of the small bowel (Fig. 13). Images were captured before clamping the mesenteric vessel, 5 s after the clamping, and 5 s after releasing the clamp. When observing purely color images, there are no visual differences between the clamped and unclamped tissues. However, the LSCI-processed images reveal obvious differences in the flow. The vessels highlighted in the laser-speckle overlaid images shown in Fig. 13(c) are no longer highlighted after the occlusion presented in Fig. 13(e). A broad decrease in the blue hue outside of the vessels is also seen, indicating a widespread decrease in perfusion across the ischemic tissue. When comparing the corresponding RGB color images before, after, and during clamping, there are no visual indications of whether or not occlusion is occurring (Figs. 13(b), (d) and (f)). After the clamp is released, Fig. 13(g) shows that the vessels reappear.
Fig. 13.
Comparison of the raw RGB and LSCI overlay of the clamped and unclamped bowel mesentery. A distinct difference in perfusion is seen in the LSCI overlay images before and after vascular clamping (see Visualization 2 (33.7MB, mp4) ). (a) Experimental set-up showing clamp locations. (b) & (c) show unclamped bowel in RGB and LSCI overlay, respectively. In the LSCI overlay, notice the perfusing vessels indicated by the arrows are highlighted in the overlay. (d) During clamping, there are no visual differences in the vessels or tissue indicating ischemia. (e) However, on the LSCI overlay image, the chosen blood vessels have disappeared, and a general decrease LSCI intensity indicates a decrease in the perfusion. (f) & (g) Clamp removal and tissue reperfusion are seen in RGB and LSCI. Blood vessels are re-highlighted in LSCI. Note that the transparency of the overlay is not factored into the display of the color bar.
3.3. Pig minimally invasive surgery
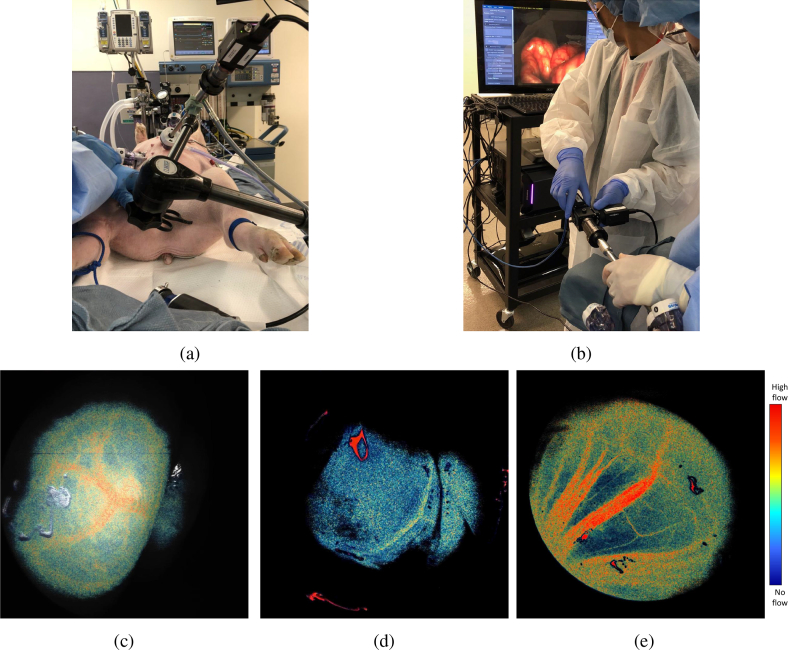
Our pig study shows that our system can be used during minimally invasive surgery. LSCI imaging of the various organs was achievable by a standard laparoscope with the perfusion data displayed in real-time, as displayed in Fig. 14. We monitored an area of the bowel and it clearly shows branching of large vessels as well as smaller vasculature along the edges (Fig. 14(c)). We also inspected the gallbladder and were able to clearly identify perfusing blood vessels(Fig. 14(d)).
Fig. 14.
Various pig organs imaged by the real-time laparoscopic LSCI system. The real-time gallbladder visualization is shown in Visualization 3 (11.4MB, mp4) , and the mesentery in Visualization 4 (6.5MB, mp4) . (a) Mounted set-up with an inserted laparoscope. (b) Color images acquired during handheld operation of the system. (c) LSCI bowel. (d) LSCI gallbladder. (e) LSCI mesentery. The colorbar is shared for c–e.
The pig mesentery is shown in Fig. 14(e). A notable point in this image is the visualization of both small and large vessels. Typically, small blood vessels have a slower flow than large blood vessels, which is shown in Fig. 14(e) - the small vessels have a lower signal than the large vessels. Thus, even with difficulties rising from spatial illumination bias presented in section 3.1.2, we believe our system still shows promise. Because of difficulty judging distance in vivo, it is possible that the laparoscope was held further than 5 cm from the tissue, allowing light to expand more. This may indicate that our system can operate further than the 5 cm observed in vitro given larger vessel sizes and environmental conditions. Furthermore, Visualization 4 (6.5MB, mp4) clearly shows increases of flow during cardiac pulsation, which supports our earlier claim, that despite illumination bias, relative flow rates at the same position over time can be monitored.
4. Discussion
Our studies exhibit that our integrated laparoscopic laser-speckle system is capable of imaging the relative flow rates over time using our microfluidic phantom. The in vivo experiments illustrate the ability of our system to highlight blood vessels and determine changes in the perfusion levels before physical tissue changes develop, as well as its ability to be used in an MIS setting.
We illustrate that using a crossed-polarizer pair is effective for reducing the specular reflection from the tissue, yielding smoother results. In our rat study, the reflections cause shadows to appear on our unpolarized acquisition, whereas our polarized images are free of aberrations from reflection. However, additional research is required to determine the impact of the polarization on the system. Polarization may reduce the speckle contrast, decreasing the quality of the resultant images. Additionally, scattering from polarizer material and surface imperfections may further degrade the speckle quality [32].
In large-animal MIS, the application of LSCI becomes more difficult owing to the artifacts from increased organ movement relative to the laparoscope caused by breathing and pulsation (see Visualization 3 (11.4MB, mp4) ). Additionally, the design of the laparoscope as a hand-held tool makes it more vulnerable to user movement and vibrations. Image registration has been proven to be capable of compensating for considerable motion, and in future studies this technique should be applied to our processing algorithm [5,33,34].
A limitation of our current system is the small illumination area and non-uniform light distribution which cause a spatial dependence of our speckle contrast, preventing us from relating the blood flows at different locations in the same imaging area. In systems that utilize laser sources on an optical axis separate from the laparoscope, the laser is easily expanded using diverging optics [16,35,36]. However, fitting such components to the geometry of a laparoscope is difficult. The laparoscope tip is not only small, but also contains a central lens stack to the camera surrounded by light fibers. Any lens fitted over the front of the laparoscope must have special geometry to not interfere with the optical path of the camera. Recently, Wu et al. presented an aspherical lens array attached to the tip of a laparoscope capable of producing a more uniformly illuminated and expanded field [37]. Such an approach may help to allow a better comparison of the relative blood flow speeds across an image. However, the addition of the lens array could reduce the coherence of the laser light, and subsequently, of the quality of the captured speckles. Song et al. demonstrated a method for computational compensation of illumination-related artifacts which may be a powerful approach that avoids the drawbacks and design challenges of additional lens [22].
Our technology holds promising advantages over other clinically available technologies for organ perfusion. Fluorescence angiography, for example, typically only provides a binary indication of the presence of perfusion in a region. Our technology can provide visualization of the relative flow speeds which can be compared temporally. This is best demonstrated in Visualization 4 (6.5MB, mp4) , where arterial pulsations are evident by their increased brightness. Time-to-peak of fluorescence signals during angiography can be related to perfusion levels, but requires a long imaging window for appropriate calculations [38]. Our system is label-free and not temporally limited; as demonstrated in Visualization 1 (9.8MB, mp4) , Visualization 2 (33.7MB, mp4) , Visualization 3 (11.4MB, mp4) , Visualization 4 (6.5MB, mp4) , the LSCI-processed images can be turned on and off at any time for any duration. This implies that our system offers increased flexibility and the ability to rapidly and continuously image areas over time to detect changes. In the future, improvement in the illumination distribution and processing software can increase the robustness of the system against spatial bias and motion dependencies, leading to an increased working range and enabling the comparison of the relative flow in vivo. Furthermore, implementation of multi-exposure LSCI can further improve the linearity of the system and has been demonstrated in real-time, providing measurements of the relative flow in environments with static scattering [39,40]. We believe that this technology holds promise to become a powerful clinical tool.
5. Conclusion
Laparoscopic LSCI has a strong potential for clinical application in intestinal surgery. We report a unique integrated laparoscopic LSCI system fit for application to MIS settings. We characterized and validated our system through in vitro microfluidic phantoms, presenting its ability to distinguish between the relative flow rates over time. in vivo rat models showed that our device was capable of rapidly differentiating between regions of healthy and low-perfusion tissue quickly after the occlusion, before visual indications appear. Our in vivo pig study demonstrated the ability of this system to perform in an MIS setting. To our knowledge, we are the first group to present a rigid laparoscopic real-time LSCI device with an integrated light source and working range of 1–5 cm. Our device provides the capability of continuously visualizing the vasculature and perfusion laparoscopically and in real time. In the future, this technology could be a powerful tool for intraoperative assessment of tissue perfusion and improved surgical decision making.
Acknowledgments
The authors thank Dr. Anthony Sandler for clinical advice and Dr. Bo Ning for insightful manuscript discussions. Tracy Thiels and Michael Barnett are acknowledged for assistance with the animal studies.
The content is solely the responsibility of the authors and does not necessarily represent the official views of the National Institute of Health.
Funding
National Institute of Biomedical Imaging and Bioengineering of the National Institutes of Health (R41EB026402); Sheikh Zayed Institute for Pediatric Surgical Innovation; InTheSmart USA (https://www.itsnuh.com).
Disclosures
The authors declare that there are no conflicts of interest related to this article.
References
- 1.Urbanavičius L., Pattyn P., Van de Putte D., Venskutonis D., “How to assess intestinal viability during surgery: a review of techniques,” World J. Gastrointest. Surg. 3, 59 (2011). 10.4240/wjgs.v3.i5.59 [DOI] [PMC free article] [PubMed] [Google Scholar]
- 2.Stoney R. J., Cunningham C. G., “Acute mesenteric ischemia,” Surgery 114, 489–490 (1993). [PubMed] [Google Scholar]
- 3.Matsui A., Winer J. H., Laurence R. G., Frangioni J. V., “Predicting the survival of experimental ischaemic small bowel using intraoperative near-infrared fluorescence angiography,” Br. J. Surg. 98, 1725–1734 (2011). 10.1002/bjs.7698 [DOI] [PMC free article] [PubMed] [Google Scholar]
- 4.Hecht N., Woitzik J., Dreier J. P., Vajkoczy P., “Intraoperative monitoring of cerebral blood flow by laser speckle contrast analysis,” Neurosurg. focus 27, E11 (2009). 10.3171/2009.8.FOCUS09148 [DOI] [PubMed] [Google Scholar]
- 5.dos Santos G. S., Maneas E., Nikitichev D., Barburas A., David A. L., Deprest J., Desjardins A., Vercauteren T., Ourselin S., “A registration approach to endoscopic laser speckle contrast imaging for intrauterine visualisation of placental vessels,” in International Conference on Medical Image Computing and Computer-Assisted Intervention, (Springer, 2015), pp. 455–462. [Google Scholar]
- 6.Bray R., Forrester K., Reed J., Leonard C., Tulip J., “Endoscopic laser speckle imaging of tissue blood flow: applications in the human knee,” J. Orthop. Res. 24, 1650–1659 (2006). 10.1002/jor.20178 [DOI] [PubMed] [Google Scholar]
- 7.Kong T. H., Yu S., Jung B., Choi J. S., Seo Y. J., “Monitoring blood-flow in the mouse cochlea using an endoscopic laser speckle contrast imaging system,” PloS one 13, e0191978 (2018). 10.1371/journal.pone.0191978 [DOI] [PMC free article] [PubMed] [Google Scholar]
- 8.Ponticorvo A., Cardenas D., Dunn A. K., Ts’o D., Duong T. Q., “Laser speckle contrast imaging of blood flow in rat retinas using an endoscope,” J. Biomed. Opt. 18, 090501 (2013). 10.1117/1.JBO.18.9.090501 [DOI] [PMC free article] [PubMed] [Google Scholar]
- 9.Yuan S., Devor A., Boas D. A., Dunn A. K., “Determination of optimal exposure time for imaging of blood flow changes with laser speckle contrast imaging,” Appl. Opt. 44, 1823–1830 (2005). 10.1364/AO.44.001823 [DOI] [PubMed] [Google Scholar]
- 10.Briers J. D., Webster S., “Laser speckle contrast analysis (lasca): a nonscanning, full-field technique for monitoring capillary blood flow,” J. Biomed. Opt. 1, 174–180 (1996). 10.1117/12.231359 [DOI] [PubMed] [Google Scholar]
- 11.Le T. M., Paul J. S., Al-Nashash H., Tan A., Luft A. R., Sheu F., Ong S., “New insights into image processing of cortical blood flow monitors using laser speckle imaging,” IEEE Trans. Med. Imaging 26, 833–842 (2007). 10.1109/TMI.2007.892643 [DOI] [PubMed] [Google Scholar]
- 12.Duncan D. D., Kirkpatrick S. J., Wang R. K., “Statistics of local speckle contrast,” JOSA A 25, 9–15 (2008). 10.1364/JOSAA.25.000009 [DOI] [PubMed] [Google Scholar]
- 13.Boas D. A., Dunn A. K., “Laser speckle contrast imaging in biomedical optics,” J. Biomed. Opt. 15, 011109 (2010). 10.1117/1.3285504 [DOI] [PMC free article] [PubMed] [Google Scholar]
- 14.Fercher A., Briers J., “Flow visualization by means of single-exposure speckle photography,” Opt. Commun. 37, 326–330 (1981). 10.1016/0030-4018(81)90428-4 [DOI] [Google Scholar]
- 15.Duncan D. D., Kirkpatrick S. J., “Can laser speckle flowmetry be made a quantitative tool?” J. Opt. Soc. Am. A 25, 2088–2094 (2008). 10.1364/JOSAA.25.002088 [DOI] [PMC free article] [PubMed] [Google Scholar]
- 16.Briers J. D., “Time-varying laser speckle for measuring motion and flow,” in Saratov Fall Meeting 2000: Coherent Optics of Ordered and Random Media, vol. 4242 (International Society for Optics and Photonics, 2001), pp. 25–40. 10.1117/12.427758 [DOI] [Google Scholar]
- 17.Ramirez-San-Juan J. C., Ramos-Garcia R., Guizar-Iturbide I., Martinez-Niconoff G., Choi B., “Impact of velocity distribution assumption on simplified laser speckle imaging equation,” Opt. Express 16, 3197–3203 (2008). 10.1364/OE.16.003197 [DOI] [PMC free article] [PubMed] [Google Scholar]
- 18.Ramirez-San-Juan J., Mendez-Aguilar E., Salazar-Hermenegildo N., Fuentes-Garcia A., Ramos-Garcia R., Choi B., “Effects of speckle/pixel size ratio on temporal and spatial speckle-contrast analysis of dynamic scattering systems: Implications for measurements of blood-flow dynamics,” Biomed. optics express 4, 1883–1889 (2013). 10.1364/BOE.4.001883 [DOI] [PMC free article] [PubMed] [Google Scholar]
- 19.Cheng H., Duong T. Q., “Simplified laser-speckle-imaging analysis method and its application to retinal blood flow imaging,” Opt. Lett. 32, 2188–2190 (2007). 10.1364/OL.32.002188 [DOI] [PMC free article] [PubMed] [Google Scholar]
- 20.Cha J., Broch A., Mudge S., Kim K., Namgoong J.-M., Oh E., Kim P., “Real-time, label-free, intraoperative visualization of peripheral nerves and micro-vasculatures using multimodal optical imaging techniques,” Biomed. Opt. Express 9, 1097–1110 (2018). 10.1364/BOE.9.001097 [DOI] [PMC free article] [PubMed] [Google Scholar]
- 21.Li P., Ni S., Zhang L., Zeng S., Luo Q., “Imaging cerebral blood flow through the intact rat skull with temporal laser speckle imaging,” Opt. Lett. 31, 1824–1826 (2006). 10.1364/OL.31.001824 [DOI] [PubMed] [Google Scholar]
- 22.Song L., Elson D. S., “Effect of signal intensity and camera quantization on laser speckle contrast analysis,” Biomed. Opt. Express 4, 89–104 (2013). 10.1364/BOE.4.000089 [DOI] [PMC free article] [PubMed] [Google Scholar]
- 23.Milnerowicz S., Milnerowicz A., Taboła R., “A middle mesenteric artery,” Surg. Radiol. Anat. 34, 973–975 (2012). 10.1007/s00276-012-0987-y [DOI] [PMC free article] [PubMed] [Google Scholar]
- 24.Michels R., Foschum F., Kienle A., “Optical properties of fat emulsions,” Opt. Express 16, 5907–5925 (2008). 10.1364/OE.16.005907 [DOI] [PubMed] [Google Scholar]
- 25.Yaroslavsky A. N., Yaroslavsky I. V., Goldbach T., Schwarzmaier H.-J., “Optical properties of blood in the near-infrared spectral range,” in Optical Diagnostics of Living Cells and Biofluids, vol. 2678 (International Society for Optics and Photonics, 1996), pp. 314–325. 10.1117/12.239516 [DOI] [Google Scholar]
- 26.Jacques S. L., “Optical properties of biological tissues: a review,” Phys. Medicine & Biol. 58, R37 (2013). 10.1088/0031-9155/58/11/R37 [DOI] [PubMed] [Google Scholar]
- 27.Bosschaart N., Edelman G. J., Aalders M. C., van Leeuwen T. G., Faber D. J., “A literature review and novel theoretical approach on the optical properties of whole blood,” Lasers Med. Sci. 29, 453–479 (2014). 10.1007/s10103-013-1446-7 [DOI] [PMC free article] [PubMed] [Google Scholar]
- 28.Noor M., Kadirgama K., Rahman M., Zuki N., Rejab M., Ruzaimi M., Muhamad K. F., Julie J. M., et al. , “Prediction modelling of surface roughness for laser beam cutting on acrylic sheets,” in Advanced Materials Research, vol. 83 (Trans Tech Publ, 2010), pp. 793–800. [Google Scholar]
- 29.Radegran G., “Ultrasound doppler estimates of femoral artery blood flow during dynamic knee extensor exercise in humans,” J. Appl. Physiol. 83, 1383–1388 (1997). 10.1152/jappl.1997.83.4.1383 [DOI] [PubMed] [Google Scholar]
- 30.Qin Y., Hua H., Nguyen M., “Characterization and in-vivo evaluation of a multi-resolution foveated laparoscope for minimally invasive surgery,” Biomed. Opt. Express 5, 2548–2562 (2014). 10.1364/BOE.5.002548 [DOI] [PMC free article] [PubMed] [Google Scholar]
- 31.Sadhwani A., Schomacker K. T., Tearney G. J., Nishioka N. S., “Determination of teflon thickness with laser speckle. i. potential for burn depth diagnosis,” Appl. Opt. 35, 5727–5735 (1996). 10.1364/AO.35.005727 [DOI] [PubMed] [Google Scholar]
- 32.Mehta D. S., Naik D. N., Singh R. K., Takeda M., “Laser speckle reduction by multimode optical fiber bundle with combined temporal, spatial, and angular diversity,” Appl. Opt. 51, 1894–1904 (2012). 10.1364/AO.51.001894 [DOI] [PubMed] [Google Scholar]
- 33.Miao P., Rege A., Li N., Thakor N. V., Tong S., “High resolution cerebral blood flow imaging by registered laser speckle contrast analysis,” IEEE Transactions on Biomed. Eng. 57, 1152–1157 (2010). 10.1109/TBME.2009.2037434 [DOI] [PubMed] [Google Scholar]
- 34.Miao P., Tong S., Lu H., Liu Q., Li Y., “Laser speckle contrast imaging of cerebral blood flow in freely moving animals,” J. Biomed. Opt. 16, 090502 (2011). 10.1117/1.3625231 [DOI] [PubMed] [Google Scholar]
- 35.Dunn A. K., Bolay H., Moskowitz M. A., Boas D. A., “Dynamic imaging of cerebral blood flow using laser speckle,” J. Cereb. Blood Flow & Metab. 21, 195–201 (2001). 10.1097/00004647-200103000-00002 [DOI] [PubMed] [Google Scholar]
- 36.Richards L. M., Kazmi S. S., Davis J. L., Olin K. E., Dunn A. K., “Low-cost laser speckle contrast imaging of blood flow using a webcam,” Biomed. Opt. Express 4, 2269–2283 (2013). 10.1364/BOE.4.002269 [DOI] [PMC free article] [PubMed] [Google Scholar]
- 37.Wu R., Qin Y., Hua H., “Improved illumination system of laparoscopes using an aspherical lens array,” Biomed. Opt. Express 7, 2237–2248 (2016). 10.1364/BOE.7.002237 [DOI] [PMC free article] [PubMed] [Google Scholar]
- 38.Diana M., Halvax P., Dallemagne B., Nagao Y., Diemunsch P., Charles A.-L., Agnus V., Soler L., Demartines N., Lindner V., et al. , “Real-time navigation by fluorescence-based enhanced reality for precise estimation of future anastomotic site in digestive surgery,” Surg. Endosc. 28, 3108–3118 (2014). 10.1007/s00464-014-3592-9 [DOI] [PubMed] [Google Scholar]
- 39.Parthasarathy A. B., Tom W. J., Gopal A., Zhang X., Dunn A. K., “Robust flow measurement with multi-exposure speckle imaging,” Opt. Express 16, 1975–1989 (2008). 10.1364/OE.16.001975 [DOI] [PubMed] [Google Scholar]
- 40.Dragojević T., Bronzi D., Varma H. M., Valdes C. P., Castellvi C., Villa F., Tosi A., Justicia C., Zappa F., Durduran T., “High-speed multi-exposure laser speckle contrast imaging with a single-photon counting camera,” Biomed. Opt. Express 6, 2865–2876 (2015). 10.1364/BOE.6.002865 [DOI] [PMC free article] [PubMed] [Google Scholar]


