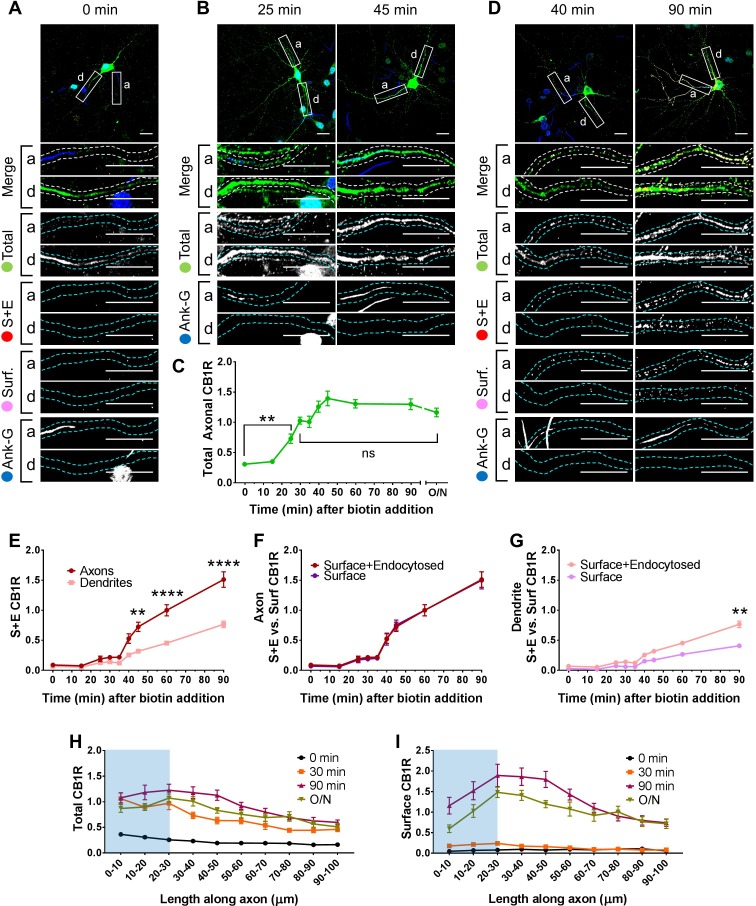
Figure 2. Newly synthesized CB1Rs are preferentially delivered to, and retained at, the axonal membrane to establish surface polarisation.
The trafficking of SBP-EGFP-CB1R following release with biotin was monitored after 0 (no biotin), 15, 25, 30, 35, 40, 45, 60, 90 min, and overnight (O/N; non-retained control) in DIV 13 hippocampal neurons. Upper panels for each condition show whole cell field of view and lower panels are enlargements of axonal (a) and dendritic (d) ROIs. Green = total; red = surface + endocytosed; magenta = surface; blue = axon marker (Ankyrin-G). In all images the scale bar = 20 µm. (A) Representative image of a hippocampal neuron expressing the RUSH construct SBP-EGFP-CB1R without biotin (0 min). SBP-EGFP-CB1R is anchored in the ER of the somatodendritic compartment and is not detected in the proximal 50 µm of axons or on the surface of dendrites. Merge: green = total; blue = Ankyrin G; red = surface + endocytosed; magenta = surface. (B) Representative confocal images of total SBP-EGFP-CB1R expressed in DIV 13 hippocampal neurons 25 min and 45 min after biotin release from the ER showing that SBP-EGFP-CB1R has entered the proximal axonal compartment (initial 50 µm). Merge: green = total; blue = Ankyrin G. (C) Quantification of data represented in (A and B). SBP-EGFP-CB1R was initially absent from the axon but entered after 25 min and continued to accumulate until it plateaued after 45 min to a level comparable to a non-retained control (O/N). One-way ANOVA with Tukey’s post hoc test. N = three to six independent experiments, n = 19–45 neurons per condition. 0 min vs. 25 min: mean ± SEM, 0.307 ± 0.0173 vs. 0.729 ± 0.0772; N = 6, n = 45 vs. N = 3, n = 19; **p = 0.0018. 30 min vs. ON: mean ± SEM, 1.03 ± 0.0597 vs. 1.2 ± 0.0632; N = 4, n = 32 vs. N = 4, n = 24, nsp = 0.8186. (D) Representative confocal images of total and surface expressed SBP-EGFP-CB1R in DIV 13 hippocampal neurons 40 min and 90 min after biotin-mediated release showing that SBP-EGFP-CB1R is preferentially delivered to, and retained at, the axonal surface. Merge: surface to total seen as white; endocytosed to total seen as yellow. (E) Quantification of data represented in (D). SBP-EGFP-CB1R reached the proximal surface of the axon 40 min after release and the surface of dendrites 60 min after release. Furthermore, significantly more SBP-EGFP-CB1R reached the axonal versus dendritic surface at 45, 60, and 90 min. 45 min, Axons vs. Dendrites: mean ± SEM, 0.723 ± 0.077 vs. 0.319 ± 0.035; N = 3, n = 20 vs. N = 3, n = 20; **p = 0.0054. 60 min, Axons vs. Dendrites: mean ± SEM, 1.00 ± 0.093 vs. 0.452 ± 0.023; N = 6, n = 46 vs. N = 6, n = 46; ****p < 0.0001. 90 min, Axons vs. Dendrites: mean ± SEM, 1.511 ± 0.129 vs. 0.566 ± 0.054; N = 4, n = 26 vs. N = 4, n = 26; ****p < 0.0001. (F) Quantification of data represented in (D). Comparison between surface + endocytosed (red; see E) and surface (magenta) curves show that SBP-EGFP-CB1R was retained on the surface of axons. (For all p > 0.9999). (G) Quantification of data represented in (D). Comparison between surface + endocytosed (pale red; see (E) and surface (pale magenta) curves show that SBP-EGFP-CB1R was internalised from the surface of dendrites. 90 min, SE vs. S: mean ± SEM, 0.766 ± 0.054 vs. 0.408 ± 0.038; N = 4, n = 26 vs. N = 4, n = 26; **p = 0.0046. Statistical analyses in (E-G); Two-way ANOVA with Tukey’s post hoc test (all analysed and corrected for multiple comparisons together). Three to six independent experiments, n = 19–45 neurons per condition. (H) Distribution of total CB1R along the first 100 µm of the axon indicates that CB1R is trafficked within the axon. By 30 min after release from the ER, and before CB1R reaches the surface, CB1R is present at least 100 µm away from the soma at levels comparable to an unretained control (O/N). The blue shaded portion indicates the location of the AIS (defined by Ankyrin-G immunostaining). Two-way ANOVA with Sidak’s post hoc test. Four to six independent experiments, n = 12–18. 90–100 µm, 0 vs. 30 min: mean ± SEM, 0.163 ± 0.014 vs. 0.452 ± 0.045; N = 6, n = 12 vs. N = 4, n = 18; *p = 0.0243. 90–100 µm, 30 min vs. O/N: mean ± SEM, 0.452 ± 0.045 vs. 0.511 ± 0.066; N = 4, n = 18 vs. N = 4, n = 15; nsp = 0.905. (I) Distribution of surface expressed CB1R along the first 100 µm of the axon shows an accumulation of CB1R at the distal region of the AIS 90 min after release from the ER. This accumulation in the AIS is reduced in the O/N unretained control consistent with lateral diffusion within the membrane. Two-way ANOVA with Sidak’s post hoc test. Four to six independent experiments, n = 12–18. 0–50 µm, 90 min vs. O/N: All points p ≤ 0.0285. 50–100 µm, 90 min vs. O/N: All points p ≥ 0.0878.

