

Abstract
Background
Poor medication adherence decreases treatment efficacy and worsens clinical outcomes, but average rates of adherence to long‐term pharmacological treatments for chronic illnesses are only about 50%. Interventions for improving medication adherence largely focus on patients rather than on physicians; however, the strategies shown to be effective are complex and difficult to implement in clinical practice. There is a need for new care models addressing the problem of medication adherence, integrating this problem into the patient care process. Physicians tend to overestimate how well patients take their medication as prescribed. This can lead to missed opportunities to change medications, solve adverse effects, or propose the use of reminders in order to improve patients' adherence. Thus, providing physicians with feedback on medication adherence has the potential to prompt changes that improve their patients' adherence to prescribed medications.
Objectives
To assess the effects of providing physicians with feedback about their patients' medication adherence for improving adherence. We also assessed the effects of the intervention on patient outcomes, health resource use, and processes of care.
Search methods
We conducted a systematic search of the Cochrane Central Register of Controlled Trials (CENTRAL), MEDLINE, and Embase, all from database inception to December 2016 and without any language restriction. We also searched ISI Web of Science, two trials registers, and grey literature.
Selection criteria
We included randomised trials, controlled before‐after studies, and interrupted time series studies that compared the effects of providing feedback to physicians about their patients' adherence to prescribed long‐term medications for chronic diseases versus usual care. We included published or unpublished studies in any language. Participants included any physician and any patient prescribed with long‐term medication for chronic disease. We included interventions providing the prescribing physician with information about patient adherence to medication. Only studies in which feedback to the physician was the sole intervention or the essential component of a multifaceted intervention were eligible. In the comparison groups, the physicians should not have had access to information about their patients' adherence to medication. We considered the following outcomes: medication adherence, patient outcomes, health resource use, processes of care, and adverse events.
Data collection and analysis
Two independent review authors extracted and analysed all data using standard methodological procedures expected by Cochrane and the Effective Practice and Organisation of Care group. Due to heterogeneity in study methodology, comparison groups, intervention settings, and measurements of outcomes, we did not carry out meta‐analysis. We describe the impact of interventions on outcomes in tabular form and make a qualitative assessment of the effects of studies.
Main results
We included nine studies (23,255 patient participants): eight randomised trials and one interrupted time series analysis. The studies took place in primary care and other outpatient settings in the USA and Canada. Seven interventions involved the systematic provision of feedback to physicians concerning all their patients' adherence to medication, and two interventions involved issuing an alert for non‐adherent patients only. Seven studies used pharmacy refill data to assess medication adherence, and two used an electronic device or self‐reporting. The definition of adherence differed across studies, making comparisons difficult. Eight studies were at high risk of bias, and one study was at unclear risk of bias. The most frequent source of bias was lack of protection against contamination.
Providing physicians with feedback may lead to little or no difference in medication adherence (seven studies, 22,924 patients), patient outcomes (two studies, 1292 patients), or health resource use (two studies, 4181 patients). Providing physicians with feedback on medication adherence may improve processes of care (e.g. more medication changes, dialogue with patient, management of uncontrolled hypertension) compared to usual care (four studies, 2780 patients). None of the studies reported an adverse event due to the intervention. The certainty of evidence was low for all outcomes, mainly due to high risk of bias, high heterogeneity across studies, and indirectness of evidence.
Authors' conclusions
Across nine studies, we observed little or no evidence that provision of feedback to physicians regarding their patients adherence to prescribed medication improved medication adherence, patient outcomes, or health resource use. Feedback about medication adherence may improve processes of care, but due to the small number of studies assessing this outcome and high risk of bias, we cannot draw firm conclusions on the effect of feedback on this outcome. Future research should use a clear, standardised definition of medication adherence and cluster‐randomisation to avoid the risk of contamination.
Plain language summary
Providing physicians with feedback on medication adherence for people with chronic diseases taking long‐term medication
What is the aim of this review?
The aim of this Cochrane Review was to find out whether providing physicians with feedback about the medication adherence of their patients with chronic disease that take long‐term medication can improve adherence, patient outcomes, health resource use, and processes of care.
Key messages
Providing physicians with feedback about the medication adherence of their patients may lead to little or no difference in patients' adherence to prescribed medications, patient outcomes, and health resource use, but it may improve processes of care. The certainty of the evidence is low.
What was studied in the review?
Physicians tend to overestimate how well their patients take medication as prescribed and therefore miss opportunities to improve adherence. These opportunities include actions such as changing medications, solving adverse effects, and proposing the use of medication reminders. Thus, informing physicians about their patients' medication adherence could change physician behaviour and in turn improve medication adherence.
What are the main results of the review?
We found nine well‐designed studies involving 23,255 patients. All of the studies took place in outpatient settings. We found that providing physicians with feedback about their patients' medication adherence may lead to little or no difference in adherence, patient outcomes, or health resource use, but it may improve processes of care. Feedback to physicians alone is probably insufficient to affect adherence. The certainty of the evidence for each outcome is low.
How up‐to‐date this review?
We searched for studies that had been published up to 2 December 2016.
Summary of findings
Summary of findings for the main comparison. Summary of findings: feedback on medication adherence to physicians versus usual care.
| Feedback on medication adherence to physicians versus usual care | |||
|
Patient or population: any physician, and any patient treated for chronic diseases with long‐term medication use Settings: hospitals or community, USA and Canada Intervention: feedback on medication adherence to physicians Comparison: usual care | |||
| Outcomes | Effect of providing feedback on medication adherence to physicians | No of patients (studies) | Certainty of the evidence (GRADE) |
|
Medication adherence Percentage of 'days covered' by medication (medication possession ratio), percentage of 'time covered', percentage of non‐adherent patients, 'time‐to‐refill' (i.e. the number of days between the date where the patient was declared 7 days overdue, and the date of the next refill) |
Intervention may lead to little or no difference to medication adherence | 22,924 (7 studies) |
⊕⊕⊝⊝ Lowa,b |
|
Patient outcomes Lipid levels, HbA1C level, HIV viral load, number of major atherosclerosis disease events |
Intervention may lead to little or no difference to patient outcomes | 1292 (2 studies) | ⊕⊕⊝⊝ Lowa,b |
|
Health resource use Rate of hospitalisations, rate of emergency department encounters, rate of outpatient encounters, rate of oral steroid use |
Intervention may lead to little or no difference to health resource use | 4181 (2 studies) | ⊕⊕⊝⊝ Lowa,b |
|
Processes of care Rate of medication change (medication discontinued, added, replaced), proportion of visits with appropriate management of uncontrolled hypertension, patient rating (quality of care, duration of the visit, communication with physician), patient‐physician dialogue (utterance related to treatment, medication adherence, side effects) |
Intervention may improve processes of care. | 2780 (4 studies) | ⊕⊕⊝⊝ Lowb,c |
| Adverse events | None of the 9 studies reported an adverse event due to the intervention. | — | — |
| GRADE Working Group grades of evidence
High quality: this research provides a very good indication of the likely effect. The likelihood that the effect will be substantially different* is low.
Moderate quality: this research provides a good indication of the likely effect. The likelihood that the effect will be substantially different* is moderate.
Low quality: this research provides some indication of the likely effect. However, the likelihood that it will be substantially different* is high.
Very low quality: this research does not provide a reliable indication of the likely effect. The likelihood that the effect will be substantially different* is very high. *Substantially different = a large enough difference that it might affect a decision. | |||
aEvidence downgraded one level due to limitations in the design and implementation: high risk of contamination bias. bEvidence downgraded one level due to indirectness of evidence: most studies used pharmacy refill data to measure adherence, while other methods could be used in other settings. cEvidence downgraded one level due to unexplained heterogeneity or inconsistency of results.
Background
Description of the condition
Medication adherence is the process by which people take their medications as prescribed (Vrijens 2012). In developed countries, rates of adherence to long‐term pharmacological treatments for chronic illnesses average 50% (Sabaté 2003). The consequences of poor medication adherence include compromised treatment efficacy, worsened clinical outcomes (DiMatteo 2002;Simpson 2006), and increased healthcare costs (Sokol 2005).
Description of the intervention
The intervention is a feedback method to the prescribing physician with information about patient adherence to medication, regardless of the method used to measure adherence (e.g. refill data, electronic device, self‐reporting), the way of providing feedback to the physician (e.g. printed report, electronic software), and the timing or frequency of feedback (e.g. alert for non‐adherent patients, systematic provision of feedback to physicians).
How the intervention might work
Providing physicians with feedback on medication adherence might address three barriers to the optimal management of patient compliance to prescribed medications identified by the World Health Organization (WHO) (Sabaté 2003): the lack of awareness about adherence among health professionals; the lack of clinical tools to assist health professionals in evaluating medication adherence and interventions to improve it; and suboptimal communication between patients and health professionals. Physicians are generally unable to identify non‐adherent patients. They tend to overestimate how well their patients take their medication and recognise fewer than half of non‐adherent patients (Meddings 2012; Miller 2002;Mushlin 1977; Zeller 2008). Physicians therefore miss many opportunities to improve adherence.
At the same time, the provider‐patient relationship is a major determinant of medication adherence (Arbuthnott 2009; Epstein 2004; Harmon 2006; Haskard Zolnierek 2009). Providing information about medication use to physicians might encourage dialogue with patients, potentially leading to more personalised strategies to improve adherence to treatment. In the absence of such information, physicians may mistakenly believe that the disease in non‐adherent patients is refractory to treatment, leading them to increase drug doses when, in reality, patients had not taken the medication as prescribed (Heisler 2008). Conversely, physicians may be unwilling to intensify treatment for a particular patient in cases where such intensification is really necessary, because they incorrectly suspect that the patient is not following the treatment correctly. Finally, information about medication adherence could help physicians to determine the causes of such non‐adherence. For example, adverse effects may account for a large proportion of cases of non‐adherence but, unfortunately, 37% of patients do not discuss such problems with their physicians, even though most of these effects can be prevented or attenuated (Gandhi 2003). Several studies have also suggested that cost and regimen complexity may increase non‐adherence rates (Ingersoll 2008; Piette 2004; Shrank 2006). Thus, informing physicians about their patients' adherence would provide them with opportunities to explain the disease and its treatment to the patient, assess and treat side effects, switch to less costly or reimbursed medication, or reduce the complexity of the medication regimen. These changes in the processes of care have the potential to ultimately improve adherence.
Why it is important to do this review
Some authors have suggested that improving medication adherence might have a greater impact on health than advances in the treatment itself (Sabaté 2003; Woolf 2005). Several reviews on the topic of medication non‐adherence have been published (Kripalani 2007; Nieuwlaat 2014; Viswanathan 2012), but they focus mainly on interventions targeting patients rather than physicians. There is some evidence that interventions targeting patients can have beneficial effects on patient medication adherence. However, all effective interventions are complex. They include combinations of components, such as patient counselling, information, behavioural support, and reminders, which are difficult to implement in clinical practice and do not lead to large improvements in adherence (Nieuwlaat 2014). This review studies an intervention that is relatively easy to implement in clinical practice and focuses on physicians.
Objectives
To assess the effects of providing physicians with feedback about their patients' medication adherence for improving adherence. We also assessed the effects of the intervention on patient outcomes, health resource use, and processes of care.
Methods
Criteria for considering studies for this review
Types of studies
We included individual‐ and cluster‐randomised trials; however as these are often not available to address questions about the effects of practice and organisation of care interventions, we also included controlled before‐after and interrupted time series studies, complying with the Cochrane Effective Practice and Organisation of Care (EPOC) study design criteria (EPOC 2013a). We included published or unpublished studies in any language.
Types of participants
We considered physicians in any area, regardless of their specialty, working in hospitals or in the community. Patients included any adult or child treated for chronic diseases with long‐term medication (i.e. without treatment period end date), regardless of the prescribed medication, the route of administration, or the initial medication adherence.
Types of interventions
We included interventions aiming to improve medication adherence, patient outcomes, health resource use, or processes of care by providing the prescribing physician with information about patient adherence to medication, regardless of the method used to measure adherence (e.g. refill data, electronic device, self‐reporting), the way of providing feedback to the physician (e.g. printed report, electronic software), or the timing and frequency of feedback (e.g. alert for non‐adherent patients, systematic provision of feedback to physicians). In the comparison groups, the physicians should not have had access to information about the medication adherence of their patients; we excluded studies in which both intervention and control group received information about medication adherence.
We included studies in which feedback to the physician is the sole intervention or the essential component of a multifaceted intervention. In multifaceted interventions, we made the distinction between 'essential component' and 'non‐essential component' using the same methodology as Ivers 2012: in cases where the feedback was an addition to a multifaceted intervention that could easily be offered in its absence, we considered it a non‐essential component and excluded the study because we could not have disentangled the effects of the different components. Conversely, when we judged the other components of the intervention as unlikely to be used in the absence of feedback, or when they were built around the feedback as the main intervention, we classified it as an essential component and included the study. We excluded studies directing the feedback to the patient (we determined patient‐directed feedback as a behavioural intervention of the 'rewards and reinforcement' type (Kripalani 2007).
Types of outcome measures
We considered the following outcomes: medication adherence, patient outcomes, health resource use, and processes of care. We included all studies reporting at least one of the primary or secondary outcomes described below.
Primary outcomes
Medication adherence, regardless of its definition and its calculation method (e.g. percentage of 'days covered' by medication, percentage of non‐adherent patients, number of days before a refill of medication).
Secondary outcomes
Patient outcomes (e.g. disease activity score, blood pressure control, lipid levels).
Health resource use (e.g. rate of hospitalisations).
Processes of care, related or not with medication adherence (e.g. prescribing practices, rate and nature of medication change, nature of the patient‐physician dialogue, time spent with the patient).
Adverse events: we looked for reports of adverse effects in the included studies (e.g. cancellation of medical consultation by the patient, who could react negatively to the intervention).
Search methods for identification of studies
Electronic searches
We conducted systematic searches in the following databases to December 2016 without restrictions on the basis of language or publication status.
The Cochrane Central Register of Controlled Trials (CENTRAL; 2016, issue 11) in the Cochrane Library (searched 6 December 2016).
MEDLINE Ovid (including Epub Ahead of Print, In‐Process & Other Non‐Indexed Citations) (1946 to 6 December 2016).
Embase Ovid (1974 to 6 December 2016).
Appendix 1 presents our search strategies.
Searching other resources
We also searched:
ongoing or unpublished trials in the International Clinical Trials Registry Platform (ICTRP) (apps.who.int/trialsearch) and in ClinicalTrials.gov, of the US National Institutes of Health (NIH);
grey literature in the Grey Literature Report (www.greylit.org) and in the System for Information on Grey Literature in Europe (OpenGrey) www.opengrey.eu, to avoid publication bias;
reference lists of all included papers and any key papers in the field manually, including relevant systematic reviews; and
ISI Web of Science (Science Citation Index and Social Science Citation Index) for studies citing the trials included in this review.
Data collection and analysis
Selection of studies
Two review authors (VZ, VKS) independently screened the titles and abstracts retrieved by the electronic searches. We excluded clearly irrelevant studies directly and retrieved full‐text copies of all potentially relevant papers. VZ and VKS applied inclusion criteria and resolved differences of opinion by discussion. If disagreement persisted, we sought consensus among the review author team (VZ, VKS, PD, and BS). We recorded the number of full‐text articles assessed and excluded, documented the reasons for exclusions, and used the PRISMA flow chart to record the study selection process (Moher 2009).
Data extraction and management
Two review authors (VZ, VKS) independently abstracted data from the included studies using an adapted version of the Cochrane Effective Practice and Organisation of Care (EPOC) data collection checklist (EPOC 2015a). We resolved disagreements by discussion between the review authors (VZ, VKS, PD, and BS). For multi‐arm studies, we selected the intervention group and the control group for which a pairwise comparison met the inclusion criteria. We extracted the factors most likely to account for differences in the efficacy of feedback, including study characteristics (author name, publication year, journal name, type of study), participants (setting, healthcare system, number of participants, specialty and physician training, age, socioeconomic status, disease, treatment, baseline medication adherence of the patients), intervention (description of feedback, delivery approach, duration, timing, secondary interventions, description of the control), and outcomes (methods of measuring adherence, outcomes assessed, results and their measures of variance, outcome assessor, timing of assessment). Factors selected for data extraction were based on previous research and clinical experience on this topic.
Assessment of risk of bias in included studies
Two of the review authors (VZ, VKS) independently assessed the risk of bias of each study, using the Cochrane Effective Practice and Organisation of Care (EPOC) suggested 'Risk of bias' criteria EPOC 2015b: we assessed the nine standard criteria for randomised trials (including an assessment of patient baseline characteristics, because patients were more frequently randomised than health professionals), and the seven standard criteria for ITS studies. We classified the risk of bias for each study and criterion as low, high, or unclear. We resolved disagreements by discussion between the review authors (VZ, VKS, PD, and BS). We assigned an overall assessment of the risk of bias to each of the included studies, using the approach suggested in Chapter 8 of the Cochrane Handbook for Systematic Reviews of Interventions (Higgins 2011).
Measures of treatment effect
The primary analysis of the included studies was a comparison of the mean improvement in medication adherence, without reanalysing adherence measurements, that is, we retained the definitions of adherence used in primary studies. For dichotomous variables, we reported absolute risk (with 95% confidence intervals and/or P values where possible). For continuous variables, we reported postintervention mean differences adjusted for baseline differences (with 95% confidence intervals and/or P values where possible). For time series studies, we reported time trends before and after the intervention if the study authors used an appropriate statistical analysis. In situations where we deemed the analysis to be inappropriate, we considered re‐analysing the data.
Unit of analysis issues
There were no unit of analysis issues.
Dealing with missing data
For each trial, we reported whether or not the investigators stated if the analysis was performed according to the intention‐to‐treat principle. We attempted to contact authors of the primary studies to obtain relevant missing data.
Assessment of heterogeneity
As we included fewer than 10 studies and we did not carry out a meta‐analysis, we did not conduct subgroup statistical analyses to measure heterogeneity.
Assessment of reporting biases
As we included fewer than 10 studies and we did not carry out a meta‐analysis, we did not assess the likelihood of reporting biases.
Data synthesis
Due to the heterogeneity found in study methodology, comparison groups, intervention settings (e.g. alert for non‐adherent patients, systematic provision of feedback to physicians), and measurements of adherence (e.g. percentage of 'days covered' by medication, percentage of non‐adherent patients, number of days before a refill of medication), we did not carry out a meta‐analysis. We described the impact of interventions on outcomes in tabular form and made a qualitative assessment of the effects of studies. We summarised the findings for the most important outcomes in a 'Summary of findings' table. Two review authors (VZ, VKS) independently assessed the certainty of the evidence (high, moderate, low, and very low) using the five GRADE considerations (risk of bias, consistency of effect, imprecision, indirectness, and publication bias) (Guyatt 2011). We used methods and recommendations described in Section 8.5 and Chapter 12 of the Cochrane Handbook for Systematic Reviews of interventions (Higgins 2011), and we consulted the EPOC Worksheets for preparing 'Summary of findings' tables using GRADE (EPOC 2013b, Appendix 2; Appendix 3). The four authors (VZ, VKS, PD and BS) resolved disagreements on certainty ratings by discussion and provided justification for decisions to down‐ or upgrade the ratings.
Subgroup analysis and investigation of heterogeneity
Owing to heterogeneity in design, interventions and outcomes, we did not perform meta‐analysis. Therefore we were unable to conduct subgroup analyses or formal tests of heterogeneity.
Sensitivity analysis
For the same reason, we did not examine the effects of excluding trials at high risk of bias.
Results
Description of studies
Results of the search
In total, we identified 5717 records from electronic database searches and 1197 records from other sources (see the flow diagram for study selection in Figure 1). We eliminated duplicates and screened 4045 studies by title and abstract, and we excluded 4006 studies that did not meet the eligibility criteria. We identified 34 full‐text articles that appeared to be relevant. We excluded 25 (see Characteristics of excluded studies) and included 9 (Bambauer 2006; Bieszk 2003; Kronish 2016; Nietert 2009; Pladevall 2015; Tamblyn 2010; Williams 2010; Willis 2013; Wilson 2010; see Characteristics of included studies),
1.
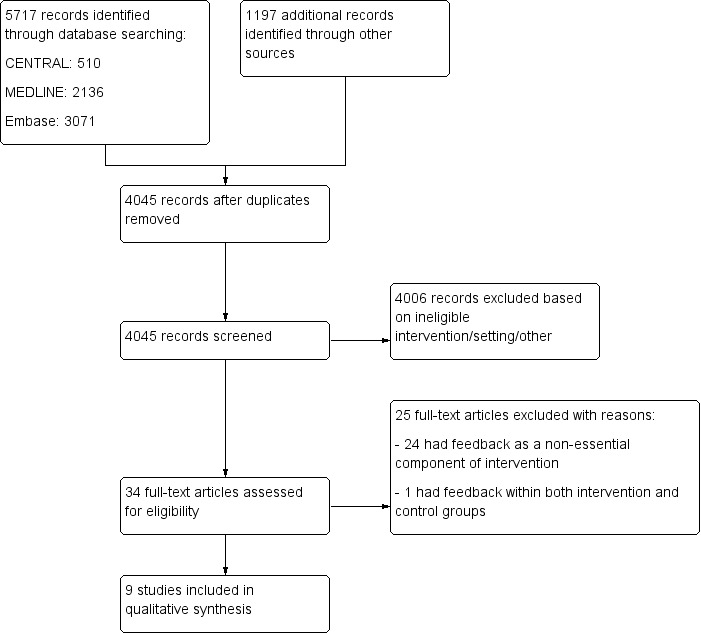
Flow diagram for study selection.
Included studies
Study characteristics
We summarise the key features of the nine included studies in the Characteristics of included studies. Five studies were randomised trials (including one cross‐over design) in individuals, three were cluster‐randomised trials, and one was an interrupted time series study. Eight studies were based in the USA and one in Canada (Tamblyn 2010). Publication dates ranged from 2003 to 2016, with six studies published in 2010 or later. All studies took place in an outpatient setting. Three studies involved between 156 and 231 patients, five between 1136 and 2698 patients, and one involved 13,128 patients.
Five of the nine studies specified that the number of physician participants ranged from 24 to 193 (Bieszk 2003; Kronish 2016; Nietert 2009; Williams 2010; Wilson 2010). Physician characteristics were poorly reported; one study specified their age. Most were primary care providers.
In accordance with the inclusion criteria, all studies concerned patient adherence to long‐term treatments: cardiovascular medications, antidiabetic drugs, antidepressants, antipsychotics, antiretroviral drugs, and/or asthma treatments. All studies included mainly adults (mean age 42 to 73 years). Two studies included a significant proportion of children with asthma (Williams 2010, with 44% patients under 18 years old, and Willis 2013, with 45% patients under 21 years old).
Table 2 shows details of the interventions implemented. We identified two main categories: one involved issuing alerts (e.g. fax alerts) for non‐adherent patients (Bambauer 2006; Nietert 2009), and the second involved the systematic provision of information about medication adherence for all patients. In four studies, physicians received a printed report before each patient's encounter (Bieszk 2003; Kronish 2016; Willis 2013; Wilson 2010), and in three studies, they received the information about adherence via electronic prescription software (Pladevall 2015; Tamblyn 2010; Williams 2010). Five of the nine included studies precisely described the support provided to the physician: three supports displayed adherence as a graph (Tamblyn 2010; Williams 2010; Willis 2013), one as a table (Kronish 2016), and one as text (Bambauer 2006). One study provided feedback twice for each patient (during two office visits) (Wilson 2010). The others studies did not clearly report the number of alerts or the number of visits for which the physician received feedback. Seven studies assessed adherence to treatment using refill data, and two other studies via an electronic device or a combination of an electronic device and self‐reporting (Kronish 2016; Wilson 2010).
1. Details of the interventions implemented.
| Study/country | Study type | Medication | Feedback type/delivery approach | Data source | Intervention description | Intervention received by control group of physicians group | N patients (N physicians)a |
|
Bambauer 2006 USA |
ITS analysis | Antidepressants | Alert/faxed | Pharmacy refill data | Physicians were alerted via fax in real‐time when their patient had a gap of more than 10 days in refilling antidepressant prescription. | No intervention | 13,128 (NR) |
|
Bieszk 2003 USA |
Cluster‐RT | Any medication | Systematic/printed report | Pharmacy refill data | A printed medication refill history report was provided to physicians before the patient's encounter. | No intervention | 231 (32) |
|
Kronish 2016 USA |
Cluster‐RT | Antihypertensive drugs | Systematic/printed report | Electronic device | A printed adherence report was provided to physicians before the patient's encounter. The report also provided clinical decision support by listing suggested clinical actions according to adherence status. | No intervention | 100 (49) |
|
Nietert 2009 USA |
RT | Medication used to treat diabetes, hypertension, hyperlipidaemia, heart failure, depression, or psychosis. | Alert/faxed | Pharmacy refill data | Physicians were alerted via fax once per week about patients with a gap of more than 7 days in refilling medication. Fax included patient adherence data and prompts to assist the patient. | No intervention | 2030 (175) |
|
Pladevall 2015 USA |
RT | Oral diabetes medication and a lipid‐lowering medication | Systematic/electronic prescription software | Pharmacy refill data | Physicians were provided, via electronic prescription software, with medication adherence of their patients, along with HbA1C (glycated haemoglobin) and LDL‐C (low‐density lipoprotein cholesterol) measurements. Physicians could also view trends in a patient's medication adherence over time by drug class. Physicians were given instruction on how to interpret and discuss this information with patients. | No intervention | 1136 (NR) |
|
Tamblyn 2010 Canada |
RT | Lipid‐lowering or antihypertensive drugs | Systematic/Electronic prescription software | Pharmacy refill data | Physicians were provided, via electronic prescription software, with the list of prescribed and dispensed drugs; medication adherence for each drug; drug costs; out‐of‐pocket expenses; and received an alert for non‐adherent patients. | List of prescribed and dispensed drugs in the electronic prescription software. | 2293 (NR) |
|
Williams 2010 USA |
Cluster‐RT | Anti‐asthma drugs | Systematic/electronic prescription software | Pharmacy refill data | Physicians were provided, via electronic prescription software, with adherence data for inhaled corticosteroid (ICS) use; the frequency of short‐acting beta‐agonist use; and the strength of each patient's current ICS prescription. In addition, the physician received asthma guidelines and methods for discussing non‐adherence with patients. | The physician received asthma guidelines and methods for discussing non‐adherence with patients. | 2698 (193) |
|
Willis 2013 USA |
RT | Medication used to treat asthma, diabetes, hypertension, congestive heart failure, ischemic heart disease or stroke | Systematic/Printed report | Pharmacy refill data | A printed report was provided to physicians before the patient's encounter. The report contained a list of dispensed drugs with a calculation and a graphical depiction of adherence, and recommendations addressing possible deficiencies relative to pharmacotherapy guidelines. | No intervention | 1483 (NR) |
|
Wilson 2010 USA |
Cross‐over‐RT | Antiretroviral drugs | Systematic/Printed report | Electronic device + self report | A printed report was provided to physicians before the patient's encounter. The report included electronic adherence data and patient survey data (self‐reported adherence, reminder use, beliefs about antiretroviral drugs, reasons for missed doses, alcohol and drug use, and depression). | No intervention | 156 (41) |
ITS: Interrupted time series; MPR: medication possession ratio; NR: not reported; RT: randomised (controlled) trial. aNumbers of participants refer to those included in the statistical analyses.
In the control arms, physicians did not receive any feedback about medication adherence and conducted office visits as usual.
Eight studies combined a secondary intervention with adherence feedback to the physician. These secondary interventions were the provision of additional information concerning the patients or their treatment to the physician (e.g. drugs costs, non‐formulary drug and alternatives, reminder use, beliefs about treatment, depression score, biological results) (Bieszk 2003; Tamblyn 2010; Wilson 2010), recommendations addressing issues related to medication adherence (e.g. clinical actions suggested according to adherence status, methods for discussing medication non‐adherence) (Kronish 2016; Nietert 2009; Williams 2010; Willis 2013), or both (Pladevall 2015). A secondary intervention occurred in the control arms of two studies. These interventions consisted of a list of prescribed and dispensed drugs in Tamblyn 2010 or asthma guidelines and recommendations addressing issues relating to adherence in Williams 2010.
Excluded studies
We describe 25 studies that initially seemed to meet the eligibility criteria and our reasons for subsequently excluding them in Characteristics of excluded studies.
Risk of bias in included studies
Figure 2 and Figure 3 show the results of the 'Risk of bias' assessment. Eight studies were at high overall risk because they were at high risk of bias in at least one domain. One study was at unclear risk of bias (Kronish 2016). The most common source of risk of bias was a lack of protection against contamination. The clarity of reporting regarding the risk of bias variables was frequently inadequate. The interrupted time series study was at high risk of bias because the outcome might have been influenced by confounding events during the study period. The three cluster‐randomised trials accounted for design effects in their analysis (Bieszk 2003; Kronish 2016; Williams 2010), as did the cross‐over study (Wilson 2010), so they were not affected by unit‐of‐analysis issues. One study had a reporting bias (Willis 2013), but this bias probably had no impact on the review's findings.
2.
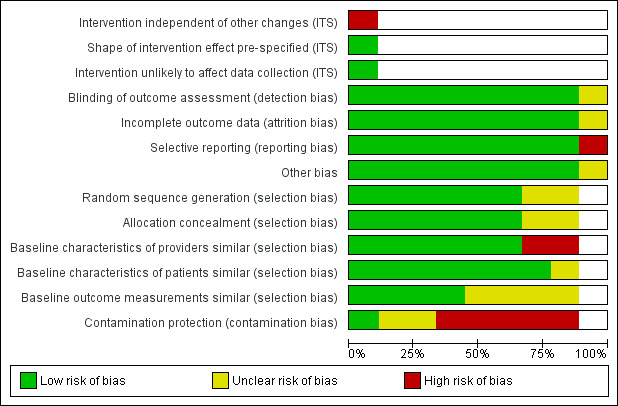
Risk of bias graph: review authors' judgements about each risk of bias item presented as percentages across all included studies.
3.
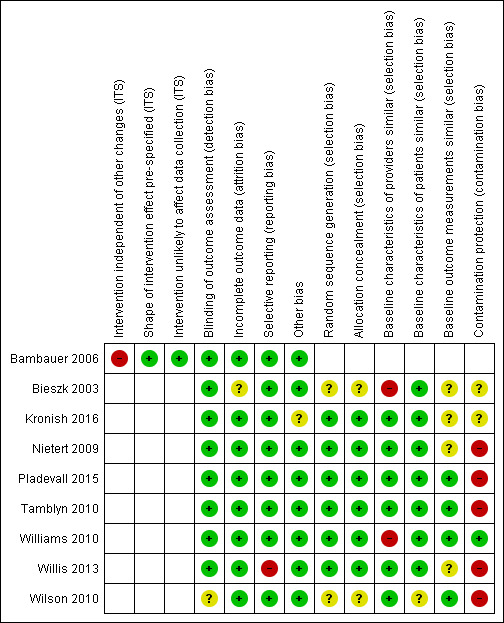
Risk of bias summary: review authors' judgements about each risk of bias item for each included study.
Allocation
Of the eight randomised trials, randomisation was adequate for six. (Kronish 2016; Nietert 2009; Pladevall 2015; Tamblyn 2010; Williams 2010; Willis 2013), and it was unclear for two studies (Bieszk 2003; Wilson 2010). The allocation unit was generally patients rather than physicians or practices. Only Williams 2010 included randomised groups of physicians, the best method for preventing the contamination of control participants.
Four of the nine studies correctly measured and reported the baseline outcomes (Pladevall 2015; Tamblyn 2010; Williams 2010; Wilson 2010). Two of the three studies in which providers differed between the intervention and control groups failed to report the baseline characteristics of the providers (Bieszk 2003; Williams 2010).
Blinding
Eight studies assessed the primary outcome variables blindly (Bambauer 2006; Bieszk 2003; Kronish 2016; Nietert 2009; Pladevall 2015; Tamblyn 2010; Williams 2010; Willis 2013). Blinded outcome assessment was unclear in one study (Wilson 2010): the primary outcome was objective, but self‐reported adherence and dialogue between physician and patient were not.
Incomplete outcome data
In eight studies, risk of bias was low in relation to incomplete outcome data. In Bieszk 2003, it was unclear owing to the fact that there is no indication of how the 51 data sets excluded from analyses were distributed between control and intervention groups.
Selective reporting
One study failed to report two outcomes (Willis 2013): 'medication adherence across all drug classes and conditions' and the secondary analyses on 'touched subjects' (subset of patients who actually received intervention). All other studies reported the results of all relevant outcomes described in the Methods.
Other potential sources of bias
One trial stopped early because an efficacy stopping rule was met at midpoint (Kronish 2016).
Effects of interventions
See: Table 1
See: Table 1.
The heterogeneity of study outcome definitions and reporting measures precluded meta‐analysis.
Medication adherence
Seven of the nine included studies assessed changes in medication adherence. However, the calculation methods differed between studies: four studies defined adherence as the percentage of 'days covered' by medication, or the 'medication possession ratio' (MPR) (Pladevall 2015; Tamblyn 2010; Williams 2010; Willis 2013), and one study defined adherence as the percentage of 'time covered', measured by medication using micro electro mechanical systems (MEMS) (Wilson 2010). Another study defined adherence as the percentage of non‐adherent patients and as the percentage of 'days uncovered' by medication (Bambauer 2006). Finally, the last study defined this outcome as the 'time‐to‐refill' (i.e. the number of days between the date when the patient was declared 7 days overdue and the date of the next refill) (Nietert 2009).
The intervention may lead to little or no difference to medication adherence (seven studies, 22,924 patients, low‐certainty evidence). Table 3 presents detailed results for medication adherence.
2. Principal results of studies for the outcome 'medication adherence'.
| Study | Definitions of the outcome 'medication adherence' | Result |
| Bambauer 2006 | Rate of patients more than 30 days overdue for prescription refilla | Immediate decrease of 2% (P = 0.15) then increase of 0.3% (P = 0.22) each month during the intervention. Over the entire study period, constant average of 75% (95% CI 72.7% to 77.3%) |
| Proportion of days without treatment ('days uncovered')a | Immediate decrease of 2% (P = 0.15) then increase of 0.4% (P = 0.04) each month during the intervention. Over the entire study period, constant average of 40% (95% CI 38.4% to 41.6%) | |
| Nietert 2009 | Median number of days from alert date to the next date of refill for any medication indicated for the patient's index disease (time‐to‐refill)a | Intervention group: 116 days; control group: 106 days HR 0.87 (98.3% CI 0.76 to 1.00; P > 0.05) |
| Within 30 days of index date, filled prescription for any medication indicated for the patient's index disease | Intervention group: N = 213 (21.0%); control group: N = 243 (24.0%) OR 0.83 (97.5% CI 0.65 to 1.06; P > 0.05) |
|
| Within 60 days of index date, filled prescription for any medication indicated for the patient's index disease | Intervention group: N = 342 (33.7%); control group: N = 373 (36.8%) OR 0.83 (98.3% CI 0.65 to 1.07; P > 0.05) |
|
| Within 30 days of index date, filled prescription for any medication | Intervention group: N = 484 (47.6%); control group: N = 490 (48.3%) OR 0.99 (95% CI 0.81 to 1.19; P > 0.05) |
|
| Pladevall 2015 | Adherence to oral diabetes medications at 6 months (MPR) | Intervention group: 0.74 ± 0.36; control group: 0.75 ± 0.35 Postintervention MD −0.01 (95% CI −0.72 to 0.70; P = 0.67) |
| Adherence to oral diabetes medications at 12 months (MPR) | Intervention group: 0.74 ± 0.36; control group: 0.75 ± 0.35. Postintervention MD −0.01 (95% CI −0.72 to 0.70; P = 0.57) | |
| Adherence to oral diabetes medications at 18 months (MPR) | Intervention group: 0.73 ± 0.37; control group: 0.75 ± 0.36 Postintervention MD −0.02 (95% CI −0.75 to 0.71; P = 0.47) | |
| Adherence to lipid lowing medications at 6 months (MPR) | Intervention group: 0.69 ± 0.36; control group: 0.70 ± 0.37 Postintervention MD −0.01 (95% CI −0.74 to 0.72; P = 0.88) | |
| Adherence to lipid lowing medications at 12 months (MPR) | Intervention group: 0.69 ± 0.37; control group: 0.70 ± 0.36 Postintervention MD −0.01 (95% CI −0.74 to 0.72; P = 0.78) | |
| Adherence to lipid lowing medications at 18 months (MPR) | Intervention group: 0.70 ± 0.37; control group: 0.70 ± 0.37 Postintervention MD 0.00 (95% CI −0.74 to 0.74; P = 0.95) | |
| Tamblyn 2010 | Change in medication adherence (MPR) | Difference between postintervention and preintervention periods, intervention group: −6.2% (95% CI 79.7% to 73.5%); control group: −6.4% (95% CI −79.2% to 72.9%). Adjusted postintervention MD 0.11% (95% CI −1.8 to 2.1; P = 0.90) |
| Williams 2010 | Inhaled corticosteroid adherence at the end of the study (MPR)a | Intervention group: 23.3% ± 2.2; control group: 21.3 % ± 2.5 (P = 0.55) Difference between study end and preintervention period, intervention group: −4.4% ± 1.2; control group: −4.4% ± 0.7. Postintervention MD 0.0% (95% CI −1.9 to 1.9; P = 0.99) |
| Willis 2013 | Overall medication adherence (MPR)a | Data not provided |
| Medication adherence by drug class (MPR) | 'All medication classes': intervention group: 41.2%; control group: 41.3% Postintervention MD −0.01% (P = 0.82) | |
| Medication adherence by disease condition (MPR) | 'All diseases': intervention group: 40.6%; control group: 39.3% Postintervention MD 1.3% (P = 0.77) | |
| Wilson 2010 | Antiretroviral adherence, electronic data (percentage of 'time covered') between the first physician visit and the crossover physician visita | Postintervention MD 2.0% (95% CI −5.1 to 9.1; P = 0.57) |
| Medication adherence, self‐report data | No significant difference, i.e. P > 0.05 (data not shown in study) |
CI: confidence interval; HR: hazard ratio; MD: mean difference; MPR: medication possession ratio; OR: odds ratio. aStudy's primary outcome.
Patient outcomes
Two studies measured patient outcomes. Wilson 2010 measured HIV RNA viral loads, and Pladevall 2015 used glycated haemoglobin and low‐density lipoprotein cholesterol levels along with the number of major atherosclerosis disease events. Providing physicians with feedback on medication adherence may lead to little or no difference on the patient outcomes (two studies, 1292 patients, low‐certainty evidence). Table 4 presents detailed results for patient outcomes.
3. Principal results of studies on patient outcomes.
| Study | Definitions of the patient outcome | Result |
| Pladevall 2015 | HbA1C at 18 months (%)a | Intervention group: 7.91 ± 1.53; control group: 7.88 ± 1.53 Postintervention MD 0.03% (95% CI −3.03 to 3.09; P = 0.76) |
| LDL‐C at 18 months (%)a | Intervention group: 87.27 ± 35.67; control group: 89.02 ± 32.11 Postintervention MD −1.75% (95% CI −69.53 to 66.03; P = 0.38) |
|
| HbA1C at 6 months (%) | Intervention group: 7.90 ± 1.44; control group: 7.81 ± 1.42 Postintervention MD 0.09% (95% CI −2.77 to 2.95; P = 0.29) |
|
| HbA1C at 12 months (%) | Intervention group: 7.96 ± 1.54; control group: 7.94 ± 1.60 Postintervention MD 0.02% (95% CI −3.12 to 3.16; P = 0.83) |
|
| LDL‐C at 6 months (%) | Intervention group: 92.07 ± 36.68; control group: 92.92 ± 32.33 Postintervention MD ‐0.85% (95% CI −69.86 to 68.16; P = 0.67) |
|
| LDL‐C at 12 months (%) | Intervention group: 90.70 ± 36.90; control group: 90.63 ± 32.41 Postintervention MD 0.07% (95% CI −69.24 to 69.38; P = 0.97) |
|
| Number of major atherosclerosis disease event by 18 months | Intervention group: 43 (7.6%); control group: 29 (5.1%) Postintervention MD 1.49% (P = 0.091) |
|
| Number of major atherosclerosis disease event by 24 months | Intervention group: 80 (14.1%); control group: 63 (11.1%) Postintervention MD 1.27% (P = 0.13) |
|
| Number of major atherosclerosis disease event by 36 months | Intervention group: 112 (19.7%); control group: 101 (17.8%) Postintervention MD 1.11% (P = 0.42) |
|
| Wilson 2010 | Plasma HIV RNA viral loads | No significant difference between the intervention and control groups, i.e. P > 0.05 (data not shown) |
CI: confidence interval; HbA1C: glycated haemoglobin; LDL‐C: low density lipoprotein cholesterol; MD: mean difference; RNA: ribonucleic acid. aStudy's primary outcome.
Health resource use
Two studies assessed changes in health resource use: Willis 2013 expressed these outcomes as the numbers of outpatient encounters, emergency department visits, and hospitalisations; Williams 2010 used the rates of asthma‐related emergency room visits, asthma‐related hospitalisations, and oral steroid use. In these studies, none of the health resource use outcomes improved with the interventions. Thus, providing physicians with feedback on medication adherence may lead to little or no difference in health resource use (two studies, 4181 patients, low‐certainty evidence). Table 5 presents detailed results for health resource use.
4. Principal results of studies for the outcome "health resource use".
| Study | Definitions of the outcome 'health resource use' | Result |
| Williams 2010 | Rate of asthma‐related emergency room visits | RR 1.13 (95% CI 0.71 to 1.80; P = 0.61) |
| Rate of asthma‐related hospitalisations | RR 0.93 (95% CI 0.34 to 2.56; P = 0.89) | |
| Rate of oral steroid use | RR 1.07 (95% CI 0.89 to 1.29; P = 0.45) | |
| Willis 2013 | Rate of outpatient encounters (per 100 participants during 6 months) | Intervention group: 46.6%; control group: 46.0% RR 1.01 (P = 0.42) |
| Rate of emergency department encounters (per 100 participants during 6 months) | Intervention group: 0.84%; control group: 0.87% RR 0.97 (P = 0.77) |
|
| Rate of hospitalisations (per 100 participants during 6 months) | Intervention group: 0.21%; control group: 0.19% RR 1.11 (P = 0.96) |
CI: confidence interval; RR: relative rate.
Processes of care
Four studies evaluated processes of care. Two assessed this outcome by determining the number and type of medication changes (Bieszk 2003; Tamblyn 2010). Another study evaluated the proportion of visits with appropriate management of the treatment, using patient ratings around quality of care during the visit (Kronish 2016). The last study investigated the characteristics of patient‐physician dialogue, particularly the amount and type of dialogue relating to adherence (Wilson 2010). Three studies suggested that physicians' practices differed between intervention and control groups (Bieszk 2003; Kronish 2016; Wilson 2010). Bieszk 2003 showed that physicians in the intervention group were more likely to modify patient treatment than those in the control group. There were more dose changes, drug additions, drug changes, and drug discontinuation in the intervention group compared to the control group. Wilson 2010 analysed dialogue between the physician and patient during medical encounters, using a system called the Generalized Medical Interaction Analysis System (GMIAS) (Mayfield 2014). This study suggested that the intervention increased the amount of dialogue, particularly concerning the number of utterances related to treatment adherence and solving problems with antiretroviral therapy. Kronish 2016 showed that the management of uncontrolled hypertension during visits was more appropriate in the intervention group than in the control group (more adherent patients had their BP regimen intensified, and more non‐adherent patients received adherence counselling). Moreover, physicians assigned to the intervention group had higher patient ratings on quality of care and communication during the visit. Finally, Tamblyn 2010 observed that physicians accessed the drug profiles more often (the list of prescribed and dispensed drugs) in the intervention group than in the control group. However, trialists found no other difference in physician practice: rates of changes in treatment (treatment intensification or drug discontinuation due to adverse effects) were similar between the intervention and control groups.
Feedback about medication adherence may improve processes of care (four studies, 2780 patients, low‐certainty evidence). Table 6 presents detailed results for processes of care.
5. Principal results of studies for the outcome 'processes of care'.
| Study | Definitions of the outcome 'processes of care' | Result |
| Bieszk 2003 | Rate of patients with medication change | Intervention group: 70.5%; control group: 22.2% RR 3.18 (P = 0.001) |
| Rate of patients with dosage change | Intervention group: 21.0%; control group: 7.1% RR 2.96 (P = 0.002) |
|
| Rate of patients with change in medication usage directions | Intervention group: 1.9%; control group: 0% RR not calculable (P = 0.16) |
|
| Rate of patient with medication added | Intervention group: 41.9%; control group: 13.5% RR 3.10 (P = 0.001) |
|
| Rate of patients with medication discontinued | Intervention group: 15.2%; control group: 4% RR 3.8 (P = 0.008) |
|
| Rate of patients with a non‐formulary medication replaced with a formulary agent | Intervention group: 18.1%; control group: 0% RR not calculable (P = 0.001) |
|
| Kronish 2016 | Proportion of visits with appropriate management of uncontrolled hypertensiona | Intervention group: 69%; control group: 34% RR 2.03 (P = 0.001) |
| Patient rating: quality of care during the visit | Intervention group: 71%; control group: 53% RR 1.34 (P = 0.05) |
|
| Patient rating: satisfaction with the amount of time spent during the visit | Intervention group: 92%; control group: 80% RR 1.15 (P = 0.11) |
|
| Patient rating: perceptions of patient‐centred communication | Intervention group: 59%; control group: 37% RR 1.59 (P = 0.001) |
|
| Patient rating: perceptions of collaborative communication | Intervention group: 49%; control group: 29% RR 1.69 (P = 0.02) |
|
| Tamblyn 2010 | Rate of access to the list of prescribed and dispensed drugs ('drug profile review')a | Intervention group: 44.5%; control group: 35.5% OR 1.46 (95% CI 1.21 to 1.76; P < 0.001) |
| Change in therapy: rate of increase in therapya | Intervention group: 28.5%; control group: 29.1% OR: 0.98 (95% CI 0.80 to 1.21; P = 0.86) |
|
| Change in therapy: rate of discontinuation due to adverse effectsa | Intervention group: 2.3%; control group: 2.0% OR: 1.18 (95% CI 0.63 to 2.19; P = 0.61) |
|
| Wilson 2010 | Median number of ART‐related utterances in patient‐physician dialogue | Intervention group: 76 (IQR 52 to 127); control group: 49.5 (IQR 28 to 113) (P = 0.07) |
| Median number of utterances about adherence to the ART regimen | Intervention group: 51.5 (IQR 37 to 77); control group: 32.5 (IQR 17 to 52) (P < 0.001) | |
| Median number of utterances about ART side effects | Intervention group: 0 (IQR 0 to 11); control group: 0 (IQR 0 to 8) (P = 0.96) | |
| Median number of utterances about ART prescription | Intervention group: 0 (IQR 0 to 15); control group: 0 (IQR 0 to 17) (P = 1.00) | |
| Median number of utterances classified as 'ART problem solving' | Intervention group: 0 (IQR 0 to 12); control group: 0 (IQR 0 to 2) (P = 0.05) |
ART: antiretroviral therapy; CI: confidence interval;IQR: interquartile range; OR: odds ratio; RR: relative rate. aStudy's primary outcome
Adverse events
None of the studies reported an adverse event due to the intervention.
Discussion
Summary of main results
Providing physicians with feedback about their patients' use of medication may lead to little or no difference in medication adherence, patient outcomes, or health resource use in patients receiving long‐term drug treatment for chronic disease. However, providing feedback may improve the processes of care (low‐certainty evidence). None of the included studies reported any adverse events.
Improving processes of care could lead to better medication adherence by patients. The four studies evaluating the effect of feedback on processes of care gave conflicting results. Three of these four studies suggested that feedback concerning adherence to treatment may improve clinical practice. Identifying non‐adherent patients could help physicians modify treatment according to the cause of non‐adherence, such as side effects or complexity of the medication regimen. Feedback might also encourage dialogue with patients around their adherence issues and efforts to resolve them, a factor associated with better adherence (Arbuthnott 2009). However, due to the small number of studies assessing this outcome and their discordant results, we cannot draw firm conclusions on the effect of feedback on processes of care.
Overall completeness and applicability of evidence
Seven of the nine included studies used pharmacy refill data to measure adherence, although numerous other methods of medication adherence exist, limiting the applicability of evidence. Only two countries were represented in the included studies, which also limits the generalisability of the results.
The potentially effective approaches for enhancing adherence are complex and difficult to integrate into routine clinical care. These approaches involve multiple contributors (patients, physicians and other healthcare professionals) and behaviour change, either at individual or organisational levels. Effective approaches may include enhanced support from family or allied health professionals, education, counselling, and the use of reminders, but the characteristics for their success are not clearly identified (Nieuwlaat 2014). There is a need for new care models addressing the problem of medication adherence, integrating this problem into the patient care process. Most studies included in this systematic review used pharmacy refill data to measure adherence. This is an objective and relatively inexpensive method appropriate for use on large numbers of patients, facilitating its smooth integration into the medical workflow. Surprisingly, we found only one study that used a self‐report questionnaire to measure adherence (Wilson 2010). This method is a low cost approach that is easy to implement in clinical practice. Though self‐report questionnaires are somewhat subjective, this quality could be advantageous for this type of intervention. Indeed, assessing adherence to treatment on the basis of patient reporting might allow the physician to evaluate the patient experience and the reasons for non‐adherence, facilitating patient‐physician communication, as shown in Wilson 2010. Feedback regarding adherence could include feedback on patient beliefs of treatment necessity and concerns about medication use; indeed, Horne 2013 showed a relationship between this factor and medication adherence. Taking into account patients' perceptions about treatment necessity, beliefs, and concerns could improve processes of care and medication adherence. Self‐report questionnaires may help patients feel they are being listened to, emphasising the partnership between physician and patient (Lutfey 1999). In contrast, sharing refill data between health professionals does not engage patients directly in monitoring medication adherence, which may limit its effectiveness. The approach used for delivering the feedback might also play a role in intervention effects, on processes of care and thus on patient adherence. Three of the interventions considered in this review provided clinicians with adherence data directly via electronic prescription software (Pladevall 2015; Tamblyn 2010; Williams 2010). These interventions did not improve adherence, but this approach to deliver the feedback is easy to integrate into the medical workflow and may be easily enhanced by feedback of other data, such as clinical or biological outcomes, probably rendering this system more attractive to physicians (Dixon 2013).
With regard to the certainty of the evidence, five studies randomised intervention by individual (including one cross‐over design), three were cluster‐randomised trials, and one study was an interrupted time series. Based on our GRADE assessment, we found the certainty of the evidence from the included studies to be low due to limitations in study designs and implementation, high risk of bias, indirectness of the evidence, high heterogeneity and inconsistent results. Consequently the certainty of the evidence does not allow robust conclusions about interventions providing physicians with information about medication adherence of their patients.
Potential biases in the review process
In the screening phase, we encountered many articles describing multifaceted interventions in which feedback to the physician was not an essential component. We excluded these studies because it would not have been possible to isolate the effect of feedback from the effect of the other interventions. When there was a narrow line between 'essential component' feedback and 'non‐essential component' feedback in a multifaceted intervention, our review team discussed the pros and cons of including the study. There was only one difference in opinion, so it is unlikely that we excluded relevant studies or included non‐relevant studies.
Agreements and disagreements with other studies or reviews
There are several systematic reviews on interventions for improving adherence to medical treatment, but most have focused on interventions targeting patients (Kripalani 2007; Nieuwlaat 2014; Viswanathan 2012). Some reviews have focused on interventions targeting physicians (such as training about adherence issues or recommendations for medication changes), but these studies did not include feedback to physicians about adherence as an essential component of the intervention. Laba 2013 found that interventions simultaneously targeting patients and physicians were more effective than strategies targeting only patients or physicians. Cutrona 2010 observed that physician‐based adherence interventions for improving adherence were less effective than strategies involving other healthcare professionals. Thus, physicians may not be the ideal targets for feedback interventions because they would not make optimal use of adherence data. This could explain why improvements in processes of care following a feedback intervention do not seem to translate to improvement in adherence.
Professionals with expertise in behavioural interventions or pharmaceutical counselling may be better able to address challenges relating to adherence. Some systematic reviews focused on providing feedback to healthcare professionals have done so using a review question that was broader in scope. Ivers 2012 showed that feedback of clinical performance to healthcare professionals could lead to small but potentially important improvements in professional practice. Effect on patient outcome seemed uncertain, with low‐certainty evidence. Boyce 2013 assessed the impact of providing healthcare professionals with feedback on patient‐reported outcome measures. This systematic review showed that the impact of this feedback on patient outcomes was weak, but the included studies were of poor quality. In many studies aiming to improve patient adherence, medication adherence data are used to provide feedback to another target, the patient. Such approaches are referred to as 'measurement‐guided medication management' (MGMM) (Hughes 2007). Several systematic reviews have shown that providing medication adherence feedback to patients was an effective method for improving adherence to treatment (Christensen 2009; Demonceau 2013). The authors of these reviews identified interventions based on the measurement of adherence by electronic methods, with feedback of the results to patients. This type of intervention differs in several ways from the interventions evaluated in our systematic review. First, feedback to the patient is a different type of intervention from feedback to the physician in that it can be classified as a behavioural intervention of the 'rewards and reinforcement' type (Kripalani 2007; Touchette 2008). Second, the electronic monitoring may itself lead to a slight improvement in adherence as a reactive effect (Sutton 2014), as patients are aware of being monitored. Third, even if feedback seems to be more effective when addressed to the patient rather than physician, this type of intervention is more difficult to implement routinely in clinical practice because it is almost exclusively based on electronic methods.
Authors' conclusions
Implications for practice.
Those interested in providing physicians with feedback on medication adherence should be aware that there is currently no evidence that such interventions are effective. Despite the limitations of the evidence currently available, our results are consistent with those of Nieuwlaat 2014, in which most of the effective interventions were complex and multifaceted. However, these findings do not imply that feedback about adherence is of no use. Such feedback is probably insufficient to affect adherence when used as single intervention, but it could be a useful tool as part of overall good clinical management, with other resources available to physicians to address poor adherence.
Implications for research.
There is a need for longitudinal studies and cluster‐randomised studies across multiple sites to provide better evidence of the efficacy of interventions. Randomising groups of physicians should be privileged to prevent contamination of control participants and avoid underestimating the effect of the intervention. Clear, standardised definitions of adherence to treatment and more detailed information about interventions are needed. In parallel, efforts should be made to improve our understanding of the consequences of feedback to physicians on their practices and on communication with their patients. Future studies should also investigate the use of drug adherence data in other ways. It might be interesting to determine whether feedback data on adherence are more effective when supplied to health professionals other than physicians. There is also a need to analyse complex multifaceted interventions with feedback adherence, to identify the best way to employ this feedback to support other interventions, and to determine which combinations of interventions are effective for improving medication adherence. The evidence in this review is limited to studies conducted in two countries (USA and Canada), and most interventions used refill data to measure adherence. In the European context, such methods could be more difficult to implement because of data protection issues and less widespread linkage of prescribing and dispensing data. Researchers in these countries should use other methods to measure adherence, as it would be interesting to assess intervention effects in these contexts.
Acknowledgements
We would like to acknowledge our external referees: Heather Colquhoun, Katie MacLure, Noah Ivers, and Tamasine Grimes; the EPOC editors: Carmel Hughes, Jemma Hudson, Julia Worswick, and Daniela Gonçalves‐Bradley; and Sophie Guiquerro (University Library of European Georges Pompidou Hospital), who all provided feedback on this review.
We also acknowledge the National Institute for Health Research, via Cochrane Infrastructure funding to the Effective Practice and Organisation of Care Group. The views and opinions expressed therein are those of the authors and do not necessarily reflect those of the Systematic Reviews Programme, NIHR, NHS, or the Department of Health.
Appendices
Appendix 1. Search strategies
Medline (OVID)
Epub Ahead of Print, In‐Process & Other Non‐Indexed Citations, Ovid MEDLINE(R) Daily and Ovid MEDLINE(R) 1946 to Present
| No. | Search terms | Results |
| 1 | exp patient compliance/ | 69706 |
| 2 | ((medication? or pharmaceutical? or drug? or medicament? or medicine?) adj2 (adhere* or complian* or nonadhere* or noncomplian*)).ti,ab. | 15546 |
| 3 | or/1‐2 | 76648 |
| 4 | exp feedback/ | 52053 |
| 5 | (feedback or feed back or fed back).ti,ab. | 120122 |
| 6 | or/4‐5 | 143509 |
| 7 | (refill* adj2 (adhere* or complian* or nonadhere* or noncomplian* or feedback or data or persistence)).ti,ab. | 398 |
| 8 | ((prescriber* or provider* or physician* or clinician* or doctor*) adj5 (know* or furnish* or deliver* or fax* or email* or facsimile or share* or provid* or feed back or feedback or fed back or phone or telephone or alert* or notify* or notifi* or supply* or suppli* or inform* or report* or disclos* or result* or recei* or summar* or availab* or data) adj5 (complian* or adhere* or noncomplian* or nonadhere* or persistence)).ti,ab. | 2307 |
| 9 | 3 and 6 | 950 |
| 10 | or/7‐9 | 3588 |
| 11 | randomized controlled trial.pt. | 469812 |
| 12 | controlled clinical trial.pt. | 95075 |
| 13 | multicenter study.pt. | 236210 |
| 14 | pragmatic clinical trial.pt. | 496 |
| 15 | (randomis* or randomiz* or randomly).ti,ab. | 759953 |
| 16 | groups.ab. | 1763247 |
| 17 | (trial or multicenter or multi center or multicentre or multi centre).ti. | 210243 |
| 18 | (intervention? or effect? or impact? or controlled or control group? or (before adj5 after) or (pre adj5 post) or ((pretest or pre test) and (posttest or post test)) or quasiexperiment* or quasi experiment* or pseudo experiment* or pseudoexperiment* or evaluat* or time series or time point? or repeated measur*).ti,ab. | 8379824 |
| 19 | non‐randomized controlled trials as topic/ | 104 |
| 20 | interrupted time series analysis/ | 261 |
| 21 | controlled before‐after studies/ | 208 |
| 22 | or/11‐21 | 9363290 |
| 23 | exp animals/ | 22100570 |
| 24 | humans/ | 17431084 |
| 25 | 23 not (23 and 24) | 4669486 |
| 26 | review.pt. | 2358156 |
| 27 | meta analysis.pt. | 81219 |
| 28 | news.pt. | 195263 |
| 29 | comment.pt. | 722035 |
| 30 | editorial.pt. | 445704 |
| 31 | cochrane database of systematic reviews.jn. | 16739 |
| 32 | comment on.cm. | 722036 |
| 33 | (systematic review or literature review).ti. | 92921 |
| 34 | or/25‐33 | 8067793 |
| 35 | 22 not 34 | 6498732 |
| 36 | 10 and 35 | 2292 |
Embase (OVID)
Embase 1974 to 2016 December 05
| No. | Search terms | Results |
| 1 | *patient compliance/ | 21616 |
| 2 | *medication compliance/ | 5111 |
| 3 | ((medication? or pharmaceutical? or drug? or medicament? or medicine?) adj2 (adhere* or complian* or nonadhere* or noncomplian*)).ti,ab. | 21710 |
| 4 | or/1‐3 | 40912 |
| 5 | *feedback system/ | 18750 |
| 6 | (feedback or feed back or fed back).ti,ab. | 130669 |
| 7 | or/5‐6 | 135895 |
| 8 | 4 and 7 | 585 |
| 9 | (refill* adj2 (adhere* or complian* or nonadhere* or noncomplian* or feedback or data or persistence)).ti,ab. | 594 |
| 10 | ((prescriber* or provider* or physician* or clinician* or doctor*) adj5 (know* or furnish* or deliver* or fax* or email* or facsimile or share* or provid* or feed back or feedback or fed back or phone or telephone or alert* or notify* or notifi* or supply* or suppli* or inform* or report* or disclos* or result* or recei* or summar* or availab* or data) adj5 (complian* or adhere* or noncomplian* or nonadhere* or persistence)).ti,ab. | 3141 |
| 11 | or/8‐10 | 4234 |
| 12 | randomized controlled trial/ | 466151 |
| 13 | controlled clinical trial/ | 456651 |
| 14 | quasi experimental study/ | 4234 |
| 15 | pretest posttest control group design/ | 342 |
| 16 | time series analysis/ | 23780 |
| 17 | experimental design/ | 24788 |
| 18 | multicenter study/ | 158722 |
| 19 | (randomis* or randomiz* or randomly).ti,ab. | 945950 |
| 20 | groups.ab. | 2190863 |
| 21 | (trial or multicentre or multicenter or multi centre or multi center).ti. | 261940 |
| 22 | (intervention? or effect? or impact? or controlled or control group? or (before adj5 after) or (pre adj5 post) or ((pretest or pre test) and (posttest or post test)) or quasiexperiment* or quasi experiment* or pseudo experiment* or pseudoexperiment* or evaluat* or time series or time point? or repeated measur*).ti,ab. | 9769307 |
| 23 | or/12‐22 | 10912010 |
| 24 | (systematic review or literature review).ti. | 104048 |
| 25 | "cochrane database of systematic reviews".jn. | 5102 |
| 26 | exp animals/ or exp invertebrate/ or animal experiment/ or animal model/ or animal tissue/ or animal cell/ or nonhuman/ | 24171479 |
| 27 | human/ or normal human/ or human cell/ | 18326884 |
| 28 | 26 not (26 and 27) | 5891413 |
| 29 | 24 or 25 or 28 | 5999800 |
| 30 | 23 not 29 | 8360987 |
| 31 | 11 and 30 | 3006 |
The Cochrane Library
| No. | Search terms | Results |
| #1 | [mh "patient compliance"] | 10372 |
| #2 | ((medication* or pharmaceutical* or drug* or medicament* or medicine*) near/2 (adhere* or complian* or nonadhere* or noncomplian*)):ti,ab | 3016 |
| #3 | {or #1‐#2} | 12149 |
| #4 | [mh feedback] | 2744 |
| #5 | (feedback or feed back or fed back):ti,ab | 6998 |
| #6 | {or #4‐#5} | 8155 |
| #7 | (refill* near/2 (adhere* or complian* or nonadhere* or noncomplian* or feedback or data or persistence)):ti,ab | 65 |
| #8 | ((prescriber* or provider* or physician* or clinician* or doctor*) near/5 (know* or furnish* or deliver* or fax* or email* or facsimile or share* or provid* or feed back or feedback or fed back or phone or telephone or alert* or notify* or notifi* or supply* or suppli* or inform* or report* or disclos* or result* or recei* or summar* or availab* or data) near/5 (complian* or adhere* or noncomplian* or nonadhere* or persistence)):ti,ab | 241 |
| #9 | #3 and #6 | 275 |
| #10 | {or #7‐#9} | 564 |
Appendix 2. Assessing the relative importance of outcomes and deciding which ones to include in the Summary of Findings table
| Outcome | Initials of people assessing the relative importance of the outcomes | Consensus | |||
| VZ | VKS | PD | BS | ||
| Relative importance (1‐9) | |||||
| Medication adherence | 9 | 9 | 9 | 9 | 9 |
| Patient outcomes | 8 | 8 | 7 | 8 | 8 |
| Health resource use | 5 | 7 | 7 | 7 | 6 |
| Processes of care | 8 | 8 | 7 | 7 | 7 |
| Adverse events | 4 | 6 | 5 | 5 | 5 |
| Relative importance for each outcome on a 9‐point scale ranging from 1 (not important) to 9 (critical). 1‐3: not important and not included in the SoF table 4‐6: important but not critical for making a decision (inclusion in the 'Summary of findings' table may depend on how many other important outcomes there are) 7‐9: critical for making a decision and should definitely be included in the 'Summary of findings' table | |||||
Appendix 3. Certainty assessment of evidence for each outcome
| No of studies | Design (initial quality rating) | Risk of bias | Inconsistency | Indirectnessa | Imprecision | Otherb |
Certainty (overall score)c |
| Outcome: medication adherence | |||||||
| 7 | 6 RT + 1 ITS (High) |
High risk of contamination bias (downgraded 1 level) |
No serious inconsistency | Applicability: most studies used pharmacy refill data to measure adherence, while other methods could be used in other settings (downgraded 1 level) |
Not applicable | None | Low |
| Outcome: patient outcomes | |||||||
| 2 | RT (High) |
High risk of contamination bias (downgraded 1 level) |
No serious inconsistency | Applicability: most studies used pharmacy refill data to measure adherence, while other methods could be used in other settings (downgraded 1 level) |
Not applicable | None | Low |
| Outcome: health resource use | |||||||
| 2 | RT (High) |
High risk of contamination bias (downgraded 1 level) |
No serious inconsistency | Applicability: most studies used pharmacy refill data to measure adherence, while other methods could be used in other settings (downgraded 1 level) |
Not applicable | None | Low |
| Outcome: processes of care | |||||||
| 4 | RT (High) |
High risk of contamination bias, but results would suggest an effect of the intervention (no downgrading) |
Unexplained heterogeneity or inconsistency of results (downgraded 1 level) |
Applicability: most studies used pharmacy refill data to measure adherence, while other methods could be used in other settings (downgraded 1 level) |
Not applicable | None | Low |
| Outcome: adverse events | |||||||
| Not applicable | |||||||
aIndirectness includes consideration of indirectness between study comparisons, indirect surrogate outcomes, and applicability (study populations, interventions or comparisons that are different than those of interest). bOther considerations for downgrading include publication bias. Other considerations for upgrading include a strong association with no plausible confounders, a dose‐response relationship, and if all plausible confounders or biases would decrease the size of the effect (if there is evidence of an effect), or increase it if there is evidence of no harmful effect (safety).
cGRADE Working Group grades of evidence
High quality: this research provides a very good indication of the likely effect. The likelihood that the effect will be substantially different* is low. Moderate quality: this research provides a good indication of the likely effect. The likelihood that the effect will be substantially different* is moderate. Low quality: this research provides some indication of the likely effect. However, the likelihood that it will be substantially different* is high. Very low quality: this research does not provide a reliable indication of the likely effect. The likelihood that the effect will be substantially different* is very high.
*Substantially different = a large enough difference that it might affect a decision.
Characteristics of studies
Characteristics of included studies [ordered by study ID]
Bambauer 2006.
| Methods | Interrupted time series analysis. 13,128 patients were included: 6387 (49%) during the pre‐intervention period and 6741 (51%) during the post‐intervention period | |
| Participants | Inclusion criteria were: adult patients beginning the use of one antidepressant, continuously enrolled in a managed care organisation in New England (Harvard Pilgrim Health Care insurance plan) for at least 6 months before and after first antidepressant use. Physicians were any type of provider, not just psychiatrists or primary care physicians. | |
| Interventions | The intervention was an antidepressant compliance programme (ACP) that alerted physicians to patients with gaps of more than 10 days in refilling antidepressant prescription ('delayed refill'), via fax, during the first 6 months of treatment. Fax alerts to physicians were based on real‐time pharmacy claims data. | |
| Outcomes | Outcomes were the rate of non‐adherence (gap exceeding 30 days) among patients with 'delayed refill' (gap exceeding 10 days) and the proportion of days without treatment within the first 6 months of treatment, before and after the implementation of the ACP. | |
| Notes | Funding sources: faculty grant from the Harvard Pilgrim Health Care (HPHC) Foundation | |
| Risk of bias | ||
| Bias | Authors' judgement | Support for judgement |
| Intervention independent of other changes (ITS) | High risk | Quote, p 502: "During the study period (May 2002‐May 2004), HPHC engaged in other efforts (in addition to the ACP) targeting physicians to improve antidepressant adherence" and "In independent analyses (not shown), we found that neither of these interventions, alone or combined with the antidepressant fax program, improved the rates of antidepressant adherence" Comment: it is not possible to evaluate the extent to which these interventions influenced the outcome |
| Shape of intervention effect pre‐specified (ITS) | Low risk | Comment: the point of analysis is the point of intervention The intervention (antidepressant compliance programme) did not affect either the source or method of data collection |
| Intervention unlikely to affect data collection (ITS) | Low risk | Comment: the intervention (antidepressant compliance programme) did not affect either the source or method of data collection |
| Blinding of outcome assessment (detection bias) All outcomes | Low risk | Comment: the outcome was objective |
| Incomplete outcome data (attrition bias) All outcomes | Low risk | Quote, p 499: "Using 3 years of pharmacy claims data (November 2001‐November 2004) obtained from HPHC and Med‐Impact" Comment: missing data, if any, were likely to be similar pre‐ and postintervention |
| Selective reporting (reporting bias) | Low risk | Comment: all relevant outcomes in the Methods section were reported in the Results section |
| Other bias | Low risk | Comment: there was no evidence of other risks of bias |
Bieszk 2003.
| Methods | Cluster‐randomised trial. 32 physicians were randomised between the treatment and the control group. 231 patients were included for analysis, 105 were assigned to treatment physicians and 126 to control physicians. A clinical pharmacist served as the blinded abstracter. | |
| Participants | Physicians participating in the study worked in 4 primary clinics of a health maintenance organization in Detroit, Michigan (Henry Ford Health system). The patients included were Health Alliance Plan‐covered patients with scheduled appointments in one of the clinics. | |
| Interventions | For the treatment group, pharmacy claims data comprised 6 months of paid prescription claims data formatted as a comprehensive refill history report (drug name, dosage form, drug strength, date last filled, days supply, quantity filled, prescription cost, and bold print highlighting of non‐formulary agents and formulary alternatives) provided to physicians just before each patient's encounter. Physicians reviewed the pharmacy claims summary during the course of the patient's visit. For the control group, data were not supplied to physicians and the office visit was conducted as usual. | |
| Outcomes | The blinded abstracter examined electronic data to identify medication changes (number of dosage changes, changes in usage directions, drugs added, drugs discontinued, and drug substitutions) in prescription regimens. The abstracter also examined dictated office notes to quantify 'physician‐detected non‐adherence' (medication non‐adherence suspected or determined by the physician), and pharmacy claims data to quantify 'abstracter‐detected non‐adherence' (number of days supplied/number of days between refills < 80%). These outcomes were compared between treatment and control groups. | |
| Notes | The physicians were not supplied with adherence rates, but they could evaluate medication adherence for the treatment group, on the basis of the pharmacy claims data. Funding sources: not specified |
|
| Risk of bias | ||
| Bias | Authors' judgement | Support for judgement |
| Blinding of outcome assessment (detection bias) All outcomes | Low risk | Quote, p 361: "A clinical pharmacist not involved in physician practices served as the blinded abstracter" Comment: the authors state explicitly that the primary outcome variables were assessed blindly |
| Incomplete outcome data (attrition bias) All outcomes | Unclear risk | Quote, p 362: "Of these, 51 data sets were excluded from analyses as there were no dictated office notes or patients did not attend their scheduled appointment" Comment: reasons are provided for the 51 patients who were included in the study but did not form part of the group analysed, but there is no indication of the distribution between control and intervention groups |
| Selective reporting (reporting bias) | Low risk | Comment: all relevant outcomes in the Methods section were reported in the Results section |
| Other bias | Low risk | Comment: there was no evidence of other risks of bias |
| Random sequence generation (selection bias) | Unclear risk | Quote, p 365: "Treatment and control group physicians did not receive specific instructions for detecting non‐adherence as they were blinded to the study objectives and randomized" Comment: the method of randomisation is not specified |
| Allocation concealment (selection bias) | Unclear risk | Comment: the unit of allocation is the physician, but it is unclear whether allocation was performed on all units at the start of the study |
| Baseline characteristics of providers similar (selection bias) | High risk | Comment: no baseline characteristics are provided for the intervention and control providers |
| Baseline characteristics of patients similar (selection bias) | Low risk | Quote, p 362: "Patient demographic information for the entire study population is listed in Table 1. There were no significant differences in the demographic variables between groups" Comment: the baseline characteristics of the intervention and control patients were reported and similar |
| Baseline outcome measurements similar (selection bias) | Unclear risk | Comment: no baseline measurement of outcome |
| Contamination protection (contamination bias) | Unclear risk | Comment: professionals were possibly allocated within a clinic, and it is possible that communication between intervention and control professionals could have occurred |
Kronish 2016.
| Methods | Cluster‐randomised trial. 24 physicians were randomised between the intervention and the control group. 100 patients were included for analysis, 65 were assigned to intervention physicians and 35 to control physicians. Staff blinded to group assignment examined data pertaining to outcome assessments. Generalised estimating equation (GEE) models, fitted with physician as the cluster variable and intervention group as the explanatory variable, were used to assess the effect of the intervention on outcomes. | |
| Participants | The physicians included were primary care providers, working in 2 hospital‐based primary care practices in New York City. 83% of patients had Medicaid or self‐pay health insurance status. Patients were eligible for electronic monitoring of adherence (run‐in) if they had an established diagnosis of hypertension, were prescribed at least 1 blood pressure (BP) medication, had at least 2 consecutive clinic visits with elevated BP, were 18‐80 years old and had at least 1 prior visit with a clinician enrolled in the study. Finally, patients were included in the analysis if they continued to have elevated BP at the next visit and had electronic adherence data available at this visit. | |
| Interventions | Physicians in the intervention group received a one‐time adherence report immediately prior to a visit with eligible patients. The one page printed report displayed the percent adherence to each BP medication and to the overall regimen for the entire monitoring period and the 7 days preceding the intervention visit. Medication adherence was assessed using an electronic pillbox. The report also provided clinical decision support by listing suggested clinical actions according to adherence status. Control group physicians did not receive an adherence report. | |
| Outcomes | The primary outcome was the "proportion of visits with appropriate management of uncontrolled hypertension". Appropriate management of uncontrolled hypertension depended on adherence status: in adherent patients (regimen adherence during the 7 days prior to intervention visit ≥ 80%), management was categorised as appropriate if providers intensified the regimen, ordered testing for identifiable causes of hypertension, or referred patients to a hypertension specialist. In non‐adherent patients (regimen adherence during the 7 days prior to intervention visit ≤ 80%) management was categorised as appropriate if providers conducted adherence counselling or simplified the regimen to facilitate adherence. Secondary outcomes were patients' rating: 'quality of care during the visit', 'satisfaction with the amount of time spent during the visit', 'perceptions of patient‐centered communication' and 'perceptions of collaborative communication'. Outcomes were assessed once per patient, at patient encounter. | |
| Notes | Funding sources: study funded by the NIH (K23HL098359, UL1 TR000040) and the American Heart Association (SDG 2600321). Dr Gallagher received support from NHLBI (T35 HL‐007616). Dr Davidson received support from NHLBI (K24 HL084034). | |
| Risk of bias | ||
| Bias | Authors' judgement | Support for judgement |
| Blinding of outcome assessment (detection bias) All outcomes | Low risk | Quote, p 3: "Two medically trained study personnel blinded to group assignment independently abstracted data pertaining to outcome assessments from medical records after a third person had reviewed records to redact wording that could reveal group assignment". Quote, p 2: "To assess blinding, research assistants guessed which group patients had been assigned to after completing outcome assessments". |
| Incomplete outcome data (attrition bias) All outcomes | Low risk | Comment: no missing outcome data. |
| Selective reporting (reporting bias) | Low risk | Comment: all relevant outcomes in the Methods section were reported in the Results section. |
| Other bias | Unclear risk | Comment: the trial was stopped early because an efficacy stopping rule was met at midpoint (z‐score positive and P value ≤ 0.001). 100 patients were enrolled, while 200 were planned. |
| Random sequence generation (selection bias) | Low risk | Quote, p 2: "Randomization was generated by a computerized random number sequence. Provider assignments were known only to a third party who had no role in outcome assessments." |
| Allocation concealment (selection bias) | Low risk | Comment: the unit of allocation was by professional, and allocation was performed on all units at the start of the study. |
| Baseline characteristics of providers similar (selection bias) | Low risk | Comment: characteristics of providers in the intervention and control groups were similar (Table 1). |
| Baseline characteristics of patients similar (selection bias) | Low risk | Comment: characteristics of patients in the intervention and control groups were similar (Table 2). |
| Baseline outcome measurements similar (selection bias) | Unclear risk | Comment: there was no baseline measure of the outcomes. |
| Contamination protection (contamination bias) | Unclear risk | Comment: physicians were randomised within a practice, and it is possible that communication between intervention and control clinicians could have occurred. |
Nietert 2009.
| Methods | Randomised trial. 3048 patients were randomised to two treatment arms ('phone patient' arm, N = 1018 and 'fax physician' arm, N = 1016) and one control group ('usual care arm', N = 1014). Randomisation was stratified by pharmacy. | |
| Participants | Nine pharmacies in South Carolina were included, representing patients from various socioeconomic backgrounds. Patients were included if they were non‐persistent (at least 7 days refill overdue) with their prescriptions used to treat one of the following 6 chronic diseases: diabetes, hypertension, hyperlipidaemia, heart failure, depression or psychosis. | |
| Interventions | Over a period of 7.5 months, a list of all non‐persistent patients (at least 7 days refill overdue) was faxed to the pharmacies once weekly. These patients were included in one of the following 3 trial arms.
|
|
| Outcomes | The primary outcome (time‐to‐refill) was the number of days from the date on which the patient was declared 7 days overdue (index date), until the patient filled a prescription for any drug relevant to their chronic disease (index disease). This primary outcome allowed for patients filling prescriptions for alternative drugs for their index disease. Secondary outcomes included binary indicators of whether the patient filled any prescription, for their index disease, or for another disease, within a period of 30 or 60 days of their index date. | |
| Notes | Only the fax physician arm and usual care arm were eligible for our review. Funding sources: grant P01 HS10871 from the Agency for Healthcare Research and Quality. |
|
| Risk of bias | ||
| Bias | Authors' judgement | Support for judgement |
| Blinding of outcome assessment (detection bias) All outcomes | Low risk | Comment: the outcomes were objective |
| Incomplete outcome data (attrition bias) All outcomes | Low risk | Comment: the reasons for patients being lost to the study were similar and the proportions were similar, 153/1016 = 15.1% in the intervention group and 156/1014 = 15.4% in the control group |
| Selective reporting (reporting bias) | Low risk | Comment: all relevant outcomes in the Methods section were reported in the Results section |
| Other bias | Low risk | Comment: there was no evidence of other risks of bias |
| Random sequence generation (selection bias) | Low risk | Quote, p 33: "Identified patients were randomized to 2 arms and usual care control using a permuted block design with randomly chosen block sizes stratified on pharmacy" |
| Allocation concealment (selection bias) | Low risk | Comment: the unit of allocation is by patient, and there is a form of centralised randomisation scheme, not disclosed to the participating pharmacists. |
| Baseline characteristics of providers similar (selection bias) | Low risk | Comment: the providers may belong to both the intervention and control groups |
| Baseline characteristics of patients similar (selection bias) | Low risk | Quote, p 35: "There were no significant differences detected across treatment arms in any of the characteristics of interest" Comment: the baseline characteristics of the intervention and control patients were reported and similar. |
| Baseline outcome measurements similar (selection bias) | Unclear risk | Comment: no baseline measurement of outcome |
| Contamination protection (contamination bias) | High risk | Comment: allocation was by patient rather than by professional. The control group probably received the intervention. |
Pladevall 2015.
| Methods | Randomised trial. 1692 patients were randomised: 569 to the 'adherence information given to physicians' group (AI), 567 to the 'usual care' group (UC), and 556 to the AI + 'motivational interviewing group' (MI) group. Only AI and UC groups were included in this review (N = 1136). Differences in glycated haemoglobin (HbA1C), low density lipoprotein cholesterol (LDL‐C), and adherence to medications were compared using analysis of variance. The number of atherosclerotic disease events was compared using a chi‐squared test. | |
| Participants | Patients were members of a large health system serving southeast Michigan and metropolitan Detroit. Patients were aged ≥ 18 years, member the health plan with prescription drug coverage in both 2007 and 2008, HbA1C measurement ≥ 7%, one LDL‐C measurement ≥ 100 mg/dL, and ≥ 1 prescription for both an oral diabetes medication and a lipid‐lowering medication. There was no information about number and characteristics of physicians. | |
| Interventions | Medication adherence was calculated using electronic prescription and fill information. In the intervention group, medication adherence measures were provided to the patient's physicians via the electronic prescribing application. Physicians could view these data, along with the latest HbA1C and LDL‐C measurements, at the time of reviewing prescriptions. Physicians were also given instruction on how to interpret and discuss adherence with their patients. In the control group, no information was provided to physicians. | |
| Outcomes | Primary outcomes were HbA1C level and LDL‐C level at 18 months following randomisation. Secondary outcomes were HbA1C and LDL‐C level at 6 and 12 months, adherence to oral diabetes and lipid‐lowering medications at 6, 12, and 18 months, and number of major atherosclerotic disease (AD) events at 18, 24, and 36 months. | |
| Notes | Only the AI and UC arms were eligible for our review. Funding sources: funding from the National Institute of Diabetes and Digestive and Kidney (R01DK064695 to Drs Pladevall and Williams), the National Institute of Allergy and Infectious Diseases (R01AI079139 to Dr Williams), and the National Heart Lung and Blood Institute (R01HL079055 and R01HL118267 to Dr Williams), National Institutes of Health and the Fund for Henry Ford Hospital (to Drs Pladevall and Williams). |
|
| Risk of bias | ||
| Bias | Authors' judgement | Support for judgement |
| Blinding of outcome assessment (detection bias) All outcomes | Low risk | Comment: The authors did not state that the primary outcomes were assessed blindly, but the outcomes are objective. |
| Incomplete outcome data (attrition bias) All outcomes | Low risk | Comment: Loss to follow‐up was similar in the intervention arm (69/569) and control group (57/567), and the reasons for loss were similar (p 6). |
| Selective reporting (reporting bias) | Low risk | Comment: all relevant outcomes in the Methods section were reported in the Results section. |
| Other bias | Low risk | Comment: there was no evidence of other risks of bias |
| Random sequence generation (selection bias) | Low risk | Quote, p 3: "a two‐step randomization process was used. A random number generator was first used to randomly sort each participating physician's list of enrolled patients. The order of treatment arm assignment was then randomly selected for each physician's patient list of participating patients." Comment: a random number generator was used |
| Allocation concealment (selection bias) | Low risk | Quote, p 3: "a two‐step randomization process was used. A random number generator was first used to randomly sort each participating physician's list of enrolled patients. The order of treatment arm assignment was then randomly selected for each physician's patient list of participating patients." Comment: the unit of allocation was by patient, and there was a form of centralised randomisation. |
| Baseline characteristics of providers similar (selection bias) | Low risk | Comment: the providers may belong to both the intervention and control groups |
| Baseline characteristics of patients similar (selection bias) | Low risk | Quote, p 5: "The baseline characteristics of study individuals are shown in Table 1. There were small but statistically significant differences in the mean age (P=0.029)" Quote, p 6: "Adjusting for demographic characteristics … did not reveal any significant differences (Supplemental Tables E4 and E5)" Comment: an appropriate adjusted analysis was performed |
| Baseline outcome measurements similar (selection bias) | Low risk | Quote, p 5: "The baseline characteristics of study individuals are shown in Table 1. There were small but statistically significant differences in … baseline HbA1C levels, and baseline high‐density lipoprotein cholesterol levels" Quote, p 6: "Adjusting for … baseline status for each outcome also did not reveal any significant differences (Supplemental Tables E4 and E5)" Comment: an appropriate adjusted analysis was performed |
| Contamination protection (contamination bias) | High risk | Comment: allocation was by patients rather than professionals. It is likely that the control group received the intervention. |
Tamblyn 2010.
| Methods | Randomised trial. 2293 patients were randomised to the intervention group (N = 1166) or the control group (N = 1127). Physicians and patients were blinded to the outcome assessed but not to intervention status. Analysis was based on generalised estimating equations to account for the clustering of patients treated by the same physician. | |
| Participants | The study took place in the Canadian province of Quebec. Primary care physicians and patients participating in the MOXXI research programme, in which physicians used an electronic health record consisting of an electronic prescribing pad and information on the drugs received by each patient, retrieved from the Quebec provincial health insurance databases. Patients were eligible for the study if they and their physicians had consented to participate in the MOXXI research programme, they were insured with the provincial drug insurance programme, and they had been prescribed at least 1 active lipid‐lowering or antihypertensive drug by the study physician in the 3 months preceding the index visit. | |
| Interventions | In the intervention group, physicians were provided, via the computerised medical record system, with the drug profile (list and graphic representation of the patient's current prescribed and dispensed drugs, costs of the drugs dispensed and out‐of‐pocket expenditure) and the refill compliance calculation for each drug. They received an alert on opening the chart if the patient's adherence to lipid‐lowering and antihypertensive drugs was less than 80%. In the control group, physicians had access only to the current list of prescribed and dispensed drugs and did not receive alerts. | |
| Outcomes | Primary outcomes were the drug profile access rate (recorded by the application) and changes in therapy (intensification, switch or drug discontinuation). The secondary outcome was medication adherence, defined as the proportion of days in which an individual had a supply of prescribed medication on the basis of prescription refills. Outcomes were assessed from 3 months before the index visit to 6 months after the index visit. | |
| Notes | Funding sources: support from the Canadian Institutes of Health Research and Pfizer Canada Inc. | |
| Risk of bias | ||
| Bias | Authors' judgement | Support for judgement |
| Blinding of outcome assessment (detection bias) All outcomes | Low risk | Comment: the outcomes were objective |
| Incomplete outcome data (attrition bias) All outcomes | Low risk | Quote, p 183: "we could follow all patients to the end of follow‐up to assess study outcomes" Comment: there was 100% follow‐up |
| Selective reporting (reporting bias) | Low risk | Comment: allocation was by patient rather than by health professional. The control group probably received the intervention. |
| Other bias | Low risk | Comment: no evidence of other risks of bias |
| Random sequence generation (selection bias) | Low risk | Quote, p 178: "The central database server conducted real‐time assessment of patent eligibility, and eligible patients were randomized to intervention or control groups using a randomized block design with randomly selected block sizes of 6, 8, and 12" |
| Allocation concealment (selection bias) | Low risk | Quote, p 178: "The central database server conducted real‐time assessment of patent eligibility, and eligible patients were randomized to intervention or control groups using a randomized block design" |
| Baseline characteristics of providers similar (selection bias) | Low risk | Comment: the providers may belong to both the intervention and control groups |
| Baseline characteristics of patients similar (selection bias) | Low risk | Quote, p 181: "Patient characteristics in the control and intervention groups were similar (Table 1)" Comment: the baseline characteristics of the intervention and control patients were reported and similar |
| Baseline outcome measurements similar (selection bias) | Low risk | Quote, p 181: "Patient characteristics in the control and intervention groups were similar (Table 1)" |
| Contamination protection (contamination bias) | High risk | Comment: Allocation was by patient rather than by health professional. The control group probably received the intervention |
Williams 2010.
| Methods | Cluster‐randomised trial. 34 practices were randomised, with stratification for the nature of the practice (paediatric or otherwise). 17 practices were randomised to the intervention group, representing 88 providers and 1335 patients, and 17 to the control group, representing 105 providers and 1363 patients. Analyses accounted for clustering at the practice level. The study staff were blinded to individual practice treatment assignment. | |
| Participants | The study took place in a large health maintenance organisation (HMO) serving southeast Michigan and including metropolitan Detroit. The physicians were primary care providers (i.e. in the areas of family practice, internal medicine and paediatrics). The inclusion criteria for patients were: age 5 to 56 years; continuous enrolment in the HMO for at least 1 year; electronic prescription for an inhaled corticosteroid (ICS); diagnosis of asthma and no diagnosis of chronic obstructive pulmonary disease or congestive heart failure; and at least one visit to a primary care provider in the previous year. | |
| Interventions | Physicians in the intervention arm could view general adherence information via the ePrescribing system, i.e. ICS adherence, frequency of short‐acting beta‐agonist use, and strength of each patient's current ICS prescription. Physicians interested in the specific details of their patients' ICS adherence could view this information, referred to as "detailed adherence information". Control group physicians also used the ePrescribing system, but adherence information was not available for their patients with asthma. The intervention was carried out over a period of one year. Physicians assigned to the two groups received information about national asthma guidelines and methods for discussing medication non‐adherence with their patients. | |
| Outcomes | The primary outcome measure was patient adherence to ICS, defined as cumulative days of treatment supplied/number of days of observation in the last 3 months of intervention. Secondary outcome measures included the time to events and the numbers of the following events during the intervention period: asthma‐related emergency room visits, asthma‐related hospitalisations, oral steroid use. Differences in ICS adherence were also investigated between patients who had a primary care visit, those whose provider viewed general adherence information, and those whose provider viewed detailed adherence information. | |
| Notes | Funding sources: grants from the National Heart, Lung, and Blood Institute (HL79055) and the National Institute of Allergy and Infectious Diseases (AI61774), National Institutes of Health; the Fund for Henry Ford Hospital, and the Strategic Program for Asthma Research of the American Asthma Foundation | |
| Risk of bias | ||
| Bias | Authors' judgement | Support for judgement |
| Blinding of outcome assessment (detection bias) All outcomes | Low risk | Quote, p 4: "Outcomes were ascertained by staff without knowledge of the treatment assignment" |
| Incomplete outcome data (attrition bias) All outcomes | Low risk | Comment: the intervention arm (295/1335) and the control group (329/1363) had similar numbers of patients lost to follow‐up, and the reasons for these losses were similar (p 12, Figure 1) |
| Selective reporting (reporting bias) | Low risk | Comment: all relevant outcomes in the Methods section were reported in the Results section |
| Other bias | Low risk | Comment: there was no evidence of other risks of bias |
| Random sequence generation (selection bias) | Low risk | Quote, p 3: "one researcher (ELP) generated the random allocation sequence within strata" |
| Allocation concealment (selection bias) | Low risk | Quote, p 3: "the identities of the practices were concealed at the time of randomization" |
| Baseline characteristics of providers similar (selection bias) | High risk | Comment: no baseline characteristics were provided for the intervention and control providers |
| Baseline characteristics of patients similar (selection bias) | Low risk | Quote, p 5: "The baseline characteristics of these patients are shown in Table 1. Only patient age differed significantly between patients in both study arms" Quote, p 5: "additionally adjusting for patient age, sex, and race‐ethnicity did not impact these findings" Comment: an appropriate adjusted analysis was performed |
| Baseline outcome measurements similar (selection bias) | Low risk | Quote, p 5: "Baseline ICS adherence for the two comparison groups was similar at 25.6% and 27.7% for intervention arm and control arm patients, respectively (P=0.210)" |
| Contamination protection (contamination bias) | Low risk | Comment: the unit of allocation was the practice |
Willis 2013.
| Methods | Randomised trial. 2219 patients were randomised to two intervention arms ('adherence report to clinician' arm, N = 744, and 'adherence reports to clinicians + notices to care managers' arm, N = 736) and one control group ('usual care' arm, N = 739). | |
| Participants | Patients were included if they were Medicaid beneficiaries, members of Northern Piedmont Community Care Network (NPCCN) (North Carolina), with at least one of these 6 conditions: persistent asthma, diabetes, hypertension, congestive heart failure, ischaemic heart disease or stroke. | |
| Interventions | The study included two interventions: the first, 'adherence reports to clinicians', included reports with a summary list of filled prescription claims, a numeric calculation of medication adherence, a graphical depiction of 'days covered', along with recommendations addressing possible deficiencies in drug prescriptions with respect to evidence‐based pharmacotherapy guidelines. These medication summary reports were printed and placed in the patient's records for review by the clinician during the patient's encounter. The second intervention, 'adherence reports to clinicians + notices to care managers', comprised the first intervention together with email notices sent to network care managers for patients with low medication adherence, no primary care clinic appointments in the previous 6 months and no appointments scheduled for the future. The patients included in the control group were treated as usual, without interventions targeting health professionals. | |
| Outcomes | The primary outcome was medication adherence across all drug classes and conditions. Other outcomes included medication adherence by class or condition, measurements of clinical outcomes, care coordination and costs. Outcomes were assessed during the 6 months following the first contact. | |
| Notes | Only the 'adherence reports to clinicians' arm and the 'usual care' arm were eligible for our review. Funding sources: funded by the Department of Health and Human Services, Agency for Healthcare Research and Quality (R18‐HS017072). |
|
| Risk of bias | ||
| Bias | Authors' judgement | Support for judgement |
| Blinding of outcome assessment (detection bias) All outcomes | Low risk | Comment: the outcomes were objective |
| Incomplete outcome data (attrition bias) All outcomes | Low risk | Comment: there was 100% follow‐up (data presented in a flow chart, p 6) |
| Selective reporting (reporting bias) | High risk | Comment: the outcome 'medication adherence across all drug classes and conditions' set out in the Methods section (p 5, table 2) was not reported in the Results section; results of secondary analyses performed on 'touched subjects' (subset of patients who actually received intervention) were not reported |
| Other bias | Low risk | Comment: there was no evidence of other risks of bias |
| Random sequence generation (selection bias) | Low risk | Quote, p 4: "NPCCN enrollees were randomly assigned using a 1:1:1 allocation by family unit using a pseudo‐random number generator" |
| Allocation concealment (selection bias) | Low risk | Quote, p 4: "NPCCN enrollees were randomly assigned using a 1:1:1 allocation by family unit using a pseudo‐random number generator" Comment: the unit of allocation was the patient and there was a centralised randomisation scheme |
| Baseline characteristics of providers similar (selection bias) | Low risk | Comment: the providers may belong to both the intervention and control groups |
| Baseline characteristics of patients similar (selection bias) | Low risk | Quote, p 5: "patients in the control and intervention groups were well matched with regard to baseline characteristics" Comment: the data are presented in table 3, p 7 |
| Baseline outcome measurements similar (selection bias) | Unclear risk | Comment: no baseline measurement of outcome |
| Contamination protection (contamination bias) | High risk | Comment: allocation was by patient rather than by health professional. The control group probably received the intervention |
Wilson 2010.
| Methods | Randomised crossover trial. 156 patients were randomised to 2 groups: the first group had 2 intervention visits first, then 2 control visits (the cross‐over). The second group had 2 control visits first, then 2 intervention visits (the cross‐over). The median between‐visit interval was 63 days. | |
| Participants | Patients were included if they used human immunodeficiency virus (HIV) antiretroviral drugs and had detectable levels of HIV ribonucleic acid (RNA) at their most recent clinical visit. The participating providers included 41 physicians, working at 5 sites (2 academic medical centres, a community health centre, a general medicine practice, and a private infectious diseases practice). | |
| Interventions | At each of the 4 study visits, patients completed a survey asking about various types of behaviour relating to medication adherence or possible non‐adherence, and adherence data from an electronic pillbox (MEMS) were downloaded. During the intervention phase, the data collected were summarised in a 3‐page report that was given to the provider just before each intervention visit. The report included data on MEMS adherence, self‐reported adherence, reminder use, beliefs about ART, reasons for missed doses, alcohol and drug use, and depression. During the control phase, no report was given to the provider. | |
| Outcomes | Primary outcome was medication adherence, expressed as a percentage of time covered, measured by MEMS. For each dose, a 3‐hour grace period was allowed, and the time 'uncovered' was the interval from the end of the grace period to the time that the next dose was taken. Secondary outcomes were self‐reported adherence, HIV RNA viral loads, and the characteristics of adherence‐related dialogue between physician and patient. | |
| Notes | Funding sources: grants from the National Institute on Drug Abuse (R01DA015679, R21MH073420), the National Institute for Mental Health (R21MH073420), the Lifespan/Tufts/Brown Centers for AIDS Research (P30AI042853), and the National Center for Research Resources (K24 RR020300) | |
| Risk of bias | ||
| Bias | Authors' judgement | Support for judgement |
| Blinding of outcome assessment (detection bias) All outcomes | Unclear risk | Comment: the authors do not state explicitly that the outcome variables were assessed blindly. Primary outcome was objective, but self‐reported adherence and dialogue between physician and patient were not. |
| Incomplete outcome data (attrition bias) All outcomes | Low risk | Quote, p 3: "The number of patients and the number of follow‐up visits completed are shown in Fig. 2: 156 (1 visit), 141 (2 visits), 126 (3 visits), 114 (4 visits) and 106 (5 visits). Assignment to intervention first or control first did not predict dropout, suggesting that study dropout did not bias our comparisons" Comment: the intervention and control groups had similar amounts of missing data |
| Selective reporting (reporting bias) | Low risk | Comment: all relevant outcomes in the Methods section were reported in the Results section |
| Other bias | Low risk | Comment: there was no evidence of other risks of bias |
| Random sequence generation (selection bias) | Unclear risk | Comment: no information was provided |
| Allocation concealment (selection bias) | Unclear risk | Comment: no information was provided |
| Baseline characteristics of providers similar (selection bias) | Low risk | Comment: the providers may belong to both the intervention and control groups |
| Baseline characteristics of patients similar (selection bias) | Unclear risk | Quote, p 3: "no study variables (including baseline MEMS and self reported adherence) predicted treatment assignment" Comment: there are no data tables or raw data in the text |
| Baseline outcome measurements similar (selection bias) | Low risk | Quote, p 3: "no study variables (including baseline MEMS and self reported adherence) predicted treatment assignment" Quote, p 1: "Using a linear regression model that adjusted for site and baseline MEMS adherence" Comment: even if baseline numerical data were not provided, an appropriate adjusted analysis was performed |
| Contamination protection (contamination bias) | High risk | Comment: allocation was by patient rather than by health professional. The control group probably received the intervention |
ACP: antidepressant compliance programme; AD: atherosclerotic disease; BP: blood pressure; GEE: generalised estimating equation; HIV: Human immunodeficiency virus; HMO: health maintenance organisation; HPHC: Harvard Pilgrim Health Care; ICS: inhaled corticosteroid; MEMS: micro electro mechanical systems (electronic pillbox); NPCCN: Northern Piedmont Community Care Network; RNA: ribonucleic acid.
Characteristics of excluded studies [ordered by study ID]
| Study | Reason for exclusion |
|---|---|
| Brath 2013 | Feedback to the physician not essential component |
| Burgess 2010 | Feedback to the physician not essential component |
| Calvert 2012 | Feedback to the physician not essential component |
| Frangou 2005 | Feedback to the physician not essential component |
| Friedman 1996 | Feedback to the physician not essential component |
| Gamble 2010 | Feedback to the physician not essential component |
| Gamble 2011 | Feedback to the physician not essential component |
| Gensichen 2009 | Feedback to the physician not essential component |
| Gifford 2014 | Feedback to the physician not essential component |
| Hyman 2012 | Feedback to the physician not essential component |
| Lockwood 2016 | Feedback to the physician not essential component |
| Onyirimba 2003 | Feedback to the physician not essential component |
| Proeschold‐Bell 2010 | Feedback to the physician not essential component |
| Reese 2015 | Feedback to the physician not essential component |
| Rosen 2004 | Feedback to the physician not essential component |
| Roux 2012 | Feedback to the physician not essential component |
| Sabin 2010 | Feedback within intervention and control groups |
| Santschi 2008 | Feedback to the physician not essential component |
| Schmidt 2008 | Feedback to the physician not essential component |
| Stip 2013 | Feedback to the physician not essential component |
| Svarstad 2009 | Feedback to the physician not essential component |
| Svarstad 2013 | Feedback to the physician not essential component |
| Touchette 2012 | Feedback to the physician not essential component |
| Valenstein 2011 | Feedback to the physician not essential component |
| Wetzels 2007 | Feedback to the physician not essential component |
Contributions of authors
V Zaugg contributed to the conception of the work, the acquisition, analysis, and interpretation of data, and the drafting of the review. V Korb‐Savoldelli contributed to the acquisition, analysis, and interpretation of data. P Durieux contributed to the conception of the work, the analysis and interpretation of data, and the critical review of the work for important intellectual content, and he approved the final version to be published. B Sabatier contributed to the analysis and interpretation of data, revised the work critically for important intellectual content, and approved the final version to be published.
Sources of support
Internal sources
No sources of support supplied
External sources
-
French Ministry of Health, AMGEN, ONYX, Haute Autorité de santé (HAS), France.
Pierre Durieux has received in the past three years research grants from the French Ministry of Health (PREQHOS, PHRC). He has received consultancies from AMGEN and ONYX, and the Haute Autorité de santé (HAS).
Declarations of interest
Vincent Zaugg: none known.
Virginie Korb‐Savoldelli: none known.
Pierre Durieux: none known.
Brigitte Sabatier: none known.
New
References
References to studies included in this review
Bambauer 2006 {published data only}
- Bambauer ZKZ, Adams AS, Zhang F, Minkoff N, Grande A, Weisblatt R, et al. Physician alerts to increase antidepressant adherence: fax or fiction?. Archives of Internal Medicine 2006;166(5):498‐504. [DOI] [PubMed] [Google Scholar]
Bieszk 2003 {published data only}
- Bieszk N, Patel R, Heaberlin A, Wlasuk K, Zarowitz B. Detection of medication nonadherence through review of pharmacy claims data. American Journal of Health‐System Pharmacy 2003;60(4):360‐6. [DOI] [PubMed] [Google Scholar]
Kronish 2016 {published data only}
- Kronish I, Moise N, McGinn T, Quan Y, Chaplin W, Gallagher B, et al. An electronic adherence measurement intervention to reduce clinical inertia in the treatment of uncontrolled hypertension: the MATCH cluster randomized clinical trial. Journal of General Internal Medicine 2016;31(11):1294‐300. [DOI] [PMC free article] [PubMed] [Google Scholar]
Nietert 2009 {published data only}
- Nietert P, Tilley B, Zhao W, Edwards P, Wessell A, Mauldin P, et al. Two pharmacy interventions to improve refill persistence for chronic disease medications: a randomized, controlled trial. Medical Care 2009;47(1):32‐40. [DOI] [PubMed] [Google Scholar]
Pladevall 2015 {published data only}
- Pladevall M, Divine G, Wells KE, Resnicow K, Williams LK. A randomized controlled trial to provide adherence information and motivational interviewing to improve diabetes and lipid control. Diabetes Educator 2015;41(1):136‐46. [DOI] [PMC free article] [PubMed] [Google Scholar]
Tamblyn 2010 {published data only}
- Tamblyn R, Reidel K, Huang A, Taylor L, Winslade N, Bartlett G, et al. Increasing the detection and response to adherence problems with cardiovascular medication in primary care through computerized drug management systems: a randomized controlled trial. Medical Decision Making 2010;30(2):176‐88. [DOI] [PubMed] [Google Scholar]
Williams 2010 {published data only}
- Williams L, Peterson E, Wells K, Campbell J, Wang M, Chowdhry V, et al. A cluster‐randomized trial to provide clinicians inhaled corticosteroid adherence information for their patients with asthma. Journal of Allergy and Clinical Immunology 2010;126(2):225‐31. [DOI] [PMC free article] [PubMed] [Google Scholar]
Willis 2013 {published data only}
- Willis J, Edwards R, Anstrom K, Johnson F, Fiol G, Kawamoto K, et al. Decision support for evidence‐based pharmacotherapy detects adherence problems but does not impact medication use. Studies in Health Technology and Informatics 2013;183:116‐25. [PubMed] [Google Scholar]
Wilson 2010 {published data only}
- Wilson I, Laws M, Safren S, Lee Y, Lu M, Coady W, et al. Provider‐focused intervention increases adherence‐related dialogue but does not improve antiretroviral therapy adherence in persons with HIV. Journal of Acquired Immune Deficiency Syndromes 2010;53(3):338‐47. [DOI] [PMC free article] [PubMed] [Google Scholar]
References to studies excluded from this review
Brath 2013 {published data only}
- Brath H, Morak J, Kästenbauer T, Modre‐Osprian R, Strohner‐Kästenbauer H, Schwarz M, et al. Mobile health (mHealth) based medication adherence measurement ‐ a pilot trial using electronic blisters in diabetes patients. British Journal of Clinical Pharmacology 2013;76(S1):47–55. [DOI] [PMC free article] [PubMed] [Google Scholar]
Burgess 2010 {published data only}
- Burgess SW, Sly PD, Devadason SG. Providing feedback on adherence increases use of preventive medication by asthmatic children. Journal of Asthma 2010;47(2):198–201. [DOI] [PubMed] [Google Scholar]
Calvert 2012 {published data only}
- Calvert SB, Kramer JM, Anstrom KJ, Kaltenbach LA, Stafford JA, Allen LaPointe NM. Patient‐focused intervention to improve long‐term adherence to evidence‐based medications: a randomized trial. American Heart Journal 2012;163(4):657‐65. [DOI] [PubMed] [Google Scholar]
Frangou 2005 {published data only}
- Frangou S, Sachpazidis I, Stassinakis A, Sakas G. Telemonitoring of medication adherence in patients with schizophrenia. Telemedecine Journal and E‐health 2005;11(6):675‐83. [DOI] [PubMed] [Google Scholar]
Friedman 1996 {published data only}
- Friedman RH, Kazis LE, Jette A, Smith MB, Stollerman J, Torgerson J, et al. A telecommunications system for monitoring and counseling patients with hypertension. Impact on medication adherence and blood pressure control. American Journal of Hypertension 1996;9(4 Pt 1):285‐92. [DOI] [PubMed] [Google Scholar]
Gamble 2010 {published data only}
- Gamble J, Heaney LG. An individualised nurse‐led programme to improve adherence in patients with difficult asthma‐ 12 month outcomes. American Journal of Respiratory and Critical Care Medicine 2010;181(1):A3258. [Google Scholar]
Gamble 2011 {published data only}
- Gamble J, Stevenson M, Heaney LG. A study of a multi‐level intervention to improve non‐adherence in difficult to control asthma. Respiratory Medicine 2011;105(9):1308‐15. [DOI] [PubMed] [Google Scholar]
Gensichen 2009 {published data only}
- Gensichen J, Korff M, Peitz M, Muth C, Beyer M, Güthlin C, et al. Case management for depression by health care assistants in small primary care practices: a cluster randomized trial. Annals of Internal Medicine 2009;151(6):369‐78. [DOI] [PubMed] [Google Scholar]
Gifford 2014 {published data only}
- Gifford AL, McDannold S, McInnes K, Devasia J, Glickman M, Goetz M. A tablet‐computer clinical intervention to support antiretroviral (ART) adherence: initial results of the MedCHEC randomized trial. International AIDS Society. 20th International AIDS Conference; 2014 July 20‐25. Melbourne. Available from pag.aids2014.org/Abstracts.aspx?AID=1890, 2014.
Hyman 2012 {published data only}
- Hyman DJ, Pavlik VN, Greisinger AJ, Chan W, Bayona J, Mansyur C, et al. Effect of a physician uncertainty reduction intervention on blood pressure in uncontrolled hypertensives ‐ a cluster randomized trial. Journal of General Internal Medicine 2012;27(4):413‐9. [DOI] [PMC free article] [PubMed] [Google Scholar]
Lockwood 2016 {published data only}
- Lockwood M, Potter L, Kane B, Lourenco L, Bodzin A, Millis JL. Prospective randomized controlled study evaluating the impact of an electronic feedback system on medication adherence in solid organ transplantation. American Journal of Transplantation 2016;16:394. [Google Scholar]
Onyirimba 2003 {published data only}
- Onyirimba F, Apter A, Reisine S, Litt M, McCusker C, Connors M, et al. Direct clinician‐to‐patient feedback discussion of inhaled steroid use: its effect on adherence. Annals of Allergy, Asthma & Immunology 2003;90(4):411‐5. [DOI] [PubMed] [Google Scholar]
Proeschold‐Bell 2010 {published data only}
- Proeschold‐Bell RJ, Belden CM, Parnell H, Cohen S, Cromwell M, Lombard F. A randomized controlled trial of health information exchange between human immunodeficiency virus institutions. Journal of Public Health Management and Practice 2010;16(6):521‐8. [DOI] [PubMed] [Google Scholar]
Reese 2015 {published data only}
- Reese PP, Bloom RD, Trofe‐Clark J, Mussell A, Leidy D, et al. Automated reminders and physician notification to promote immunosuppression adherence among kidney transplant recipients: a randomized trial. American Journal of Kidney Diseases 2017;69(3):400‐9. [DOI] [PubMed] [Google Scholar]
Rosen 2004 {published data only}
- Rosen MI, Rigsby MO, Salahi JT, Ryan CE, Cramer JA. Electronic monitoring and counseling to improve medication adherence. Behaviour Research and Therapy 2004;42(4):409‐22. [DOI] [PubMed] [Google Scholar]
Roux 2012 {published data only}
- Roux C, Garnero P, Thomas T, Sabatier JP, Orcel P, Audran M, et al. Monitoring of bone turnover markers does not improve persistence with ibandronate treatment. Joint Bone Spine 2012;79(4):389‐92. [DOI] [PubMed] [Google Scholar]
Sabin 2010 {published data only}
- Sabin LL, DeSilva MB, Hamer DH, Xu K, Zhang J, Li T, et al. Using electronic drug monitor feedback to improve adherence to antiretroviral therapy among HIV‐positive patients in China. AIDS and Behavior 2010;14(3):580‐9. [DOI] [PMC free article] [PubMed] [Google Scholar]
Santschi 2008 {published data only}
- Santschi V, Rodondi N, Bugnon O, Burnier M. Impact of electronic monitoring of drug adherence on blood pressure control in primary care: a cluster 12‐month randomised controlled study. European Journal of Internal Medicine 2008;19(6):427‐34. [DOI] [PubMed] [Google Scholar]
Schmidt 2008 {published data only}
- Schmidt S, Sheikzadeh S, Beil B, Patten M, Stettin J. Acceptance of telemonitoring to enhance medication compliance in patients with chronic heart failure. Telemedicine Journal and E‐health 2008;14(5):426‐33. [DOI] [PubMed] [Google Scholar]
Stip 2013 {published data only}
- Stip E, Vincent PD, Sablier J, Guevremont C, Zhornitsky S, Tranulis C. A randomized controlled trial with a Canadian electronic pill dispenser used to measure and improve medication adherence in patients with schizophrenia. Frontiers in Pharmacology 2013;4:article 100. [DOI] [PMC free article] [PubMed] [Google Scholar]
Svarstad 2009 {published data only}
- Svarstad BL, Kotchen JM, Shireman TI, Crawford SY, Palmer PA, Vivian EM, et al. The Team Education and Adherence Monitoring (TEAM) trial: pharmacy interventions to improve hypertension control in blacks. Circulation: Cardiovascular Quality and Outcomes 2009;2(3):264‐71. [DOI] [PMC free article] [PubMed] [Google Scholar]
Svarstad 2013 {published data only}
- Svarstad BL, Kotchen JM, Shireman TI, Brown RL, Crawford SY, Mount JK, et al. Improving refill adherence and hypertension control in black patients: Wisconsin TEAM trial. Journal of the American Pharmacists Association 2013;53(5):520‐9. [DOI] [PMC free article] [PubMed] [Google Scholar]
Touchette 2012 {published data only}
- Touchette DR, Rao S, Dhru PK, Zhao W, Choi YK, Bhandari I, et al. Identification of and intervention to address therapeutic gaps in care. American Journal of Managed Care 2012;18(10):e364‐71. [PubMed] [Google Scholar]
Valenstein 2011 {published data only}
- Valenstein M, Kavanagh J, Lee T, Reilly P, Dalack GW, Grabowski J, et al. Using a pharmacy‐based intervention to improve antipsychotic adherence among patients with serious mental illness. Schizophrenia Bulletin 2011;37(4):727‐36. [DOI] [PMC free article] [PubMed] [Google Scholar]
Wetzels 2007 {published data only}
- Wetzels GE, Nelemans PJ, Schouten JS, Dirksen CD, Weijden T, Stoffers HE, et al. Electronic monitoring of adherence as a tool to improve blood pressure control. A randomized controlled trial. American Journal of Hypertension 2007;20(2):119‐25. [DOI] [PubMed] [Google Scholar]
Additional references
Arbuthnott 2009
- Arbuthnott A, Sharpe D. The effect of physician‐patient collaboration on patient adherence in non‐psychiatric medicine. Patient Education and Counseling 2009;77(1):60‐7. [DOI] [PubMed] [Google Scholar]
Boyce 2013
- Boyce MB, Browne JP. Does providing feedback on patient‐reported outcomes to healthcare professionals result in better outcomes for patients? A systematic review. Quality of Life Research 2013;22(9):2265‐78. [DOI] [PubMed] [Google Scholar]
Christensen 2009
- Christensen A, Osterberg LG, Hansen EH. Electronic monitoring of patient adherence to oral antihypertensive medical treatment: a systematic review. Journal of Hypertension 2009;27(8):1540‐51. [DOI] [PubMed] [Google Scholar]
Cutrona 2010
- Cutrona SL, Choudhry NK, Stedman M, Servi A, Liberman JN, Brennan T, et al. Physician effectiveness in interventions to improve cardiovascular medication adherence: a systematic review. Journal of General Internal Medicine 2010;25(10):1090‐6. [DOI] [PMC free article] [PubMed] [Google Scholar]
Demonceau 2013
- Demonceau J, Ruppar T, Kristanto P, Hughes DA, Fargher E, Kardas P, et al. Identification and assessment of adherence‐enhancing interventions in studies assessing medication adherence through electronically compiled drug dosing histories: a systematic literature review and meta‐analysis. Drugs 2013;73(6):545‐62. [DOI] [PMC free article] [PubMed] [Google Scholar]
DiMatteo 2002
- DiMatteo MR, Giordani PJ, Lepper HS, Croghan TW. Patient adherence and medical treatment outcomes: a meta‐analysis. Medical Care 2002;40(9):794–811. [DOI] [PubMed] [Google Scholar]
Dixon 2013
- Dixon BE, Jabour AM, Phillips EO, Marrero DG. An informatics approach to medication adherence assessment and improvement using clinical, billing, and patient‐entered data. JAMA 2013;21(3):517‐21. [DOI] [PMC free article] [PubMed] [Google Scholar]
EPOC 2013a
- Effective Practice, Organisation of Care (EPOC). What study designs should be included in an EPOC review? EPOC Resources for review authors. Oslo: Norwegian Knowledge Centre for the Health Services, 2013. Available from epoc.cochrane.org/epoc‐specific‐resources‐review‐authors.
EPOC 2013b
- Effective Practice, Organisation of Care (EPOC). EPOC worksheets for preparing a Summary of Findings (SoF) table using GRADE. EPOC Resources for review authors. Oslo: Norwegian Knowledge Centre for the Health Services, 2013. Available from epoc.cochrane.org/epoc‐specific‐resources‐review‐authors.
EPOC 2015a
- Effective Practice, Organisation of Care (EPOC). Data collection checklist. EPOC Resources for review authors. Oslo: Norwegian Knowledge Centre for the Health Services, 2015. Available from epoc.cochrane.org/epoc‐specific‐resources‐review‐authors.
EPOC 2015b
- Effective Practice, Organisation of Care (EPOC). Suggested risk of bias criteria for EPOC reviews. EPOC Resources for review authors. Oslo: Norwegian Knowledge Centre for the Health Services, 2015. Available from epoc.cochrane.org/epoc‐specific‐resources‐review‐authors.
Epstein 2004
- Epstein RM, Alper BS, Quill TE. Communicating evidence for participatory decision making. Journal of the American Medical Association 2004;291(19):2359–66. [DOI] [PubMed] [Google Scholar]
Gandhi 2003
- Gandhi TK, Weingart SN, Borus J, Seger AC, Peterson J, Burdick E, et al. Adverse drug events in ambulatory care. New England Journal of Medicine 2003;348(16):1556–64. [DOI] [PubMed] [Google Scholar]
Guyatt 2011
- Guyatt GH, Oxman AD, Schünemann HJ, Tugwell P, Knottnerus A. GRADE guidelines: a new series of articles in the Journal of Clinical Epidemiology. Journal of Clinical Epidemiology 2011;64(4):380‐2. [DOI] [PubMed] [Google Scholar]
Harmon 2006
- Harmon G, Lefante J, Krousel‐Wood M. Overcoming barriers: the role of providers in improving patient adherence to antihypertensive medications. Current Opinion in Cardiology 2006;21(4):310‐5. [DOI] [PubMed] [Google Scholar]
Haskard Zolnierek 2009
- Haskard Zolnierek KB, DiMatteo MR. Physician communication and patient adherence to treatment: A Meta‐Analysis. Medical Care 2009;47(8):826–34. [DOI] [PMC free article] [PubMed] [Google Scholar]
Heisler 2008
- Heisler M, Hogan MM, Hofer TP, Schmittdiel JA, Pladevall M, Kerr EA. When more is not better: treatment intensification among hypertensive patients with poor medication adherence. Circulation 2008;117(22):2884–92. [DOI] [PubMed] [Google Scholar]
Higgins 2011
- Higgins JPT, Green S (editors). Cochrane Handbook for Systematic Reviews of Interventions Version 5.1.0 (updated March 2011). The Cochrane Collaboration, 2011. Available from www.cochrane‐handbook.org.
Horne 2013
- Horne R, Chapman SC, Parham R, Freemantle N, Forbes A, Cooper V. Understanding patients' adherence‐related beliefs about medicines prescribed for long‐term conditions: a meta‐analytic review of the Necessity‐Concerns Framework. PLOS ONE 2013;8(12):e80633. [DOI] [PMC free article] [PubMed] [Google Scholar]
Hughes 2007
- Hughes D. When drugs don't work: economic assessment of enhancing compliance with interventions supported by electronic monitoring devices. Pharmacoeconomics 2007;25(8):621‐35. [DOI] [PubMed] [Google Scholar]
Ingersoll 2008
- Ingersoll KS, Cohen J. The impact of medication regimen factors on adherence to chronic treatment: a review of literature. Journal of Behavioral Medicine 2008;31(3):213–24. [DOI] [PMC free article] [PubMed] [Google Scholar]
Ivers 2012
- Ivers N, Jamtvedt G, Flottorp S, Young JM, Odgaard‐Jensen J, French SD, et al. Audit and feedback: effects on professional practice and healthcare outcomes. Cochrane Database of Systematic Reviews 2012, Issue 6. [DOI: 10.1002/14651858.CD000259.pub3] [DOI] [PMC free article] [PubMed] [Google Scholar]
Kripalani 2007
- Kripalani S, Yao X, Haynes RB. Interventions to enhance medication adherence in chronic medical conditions: a systematic review. Archives of Internal Medicine 2007;167(6):540–50. [DOI] [PubMed] [Google Scholar]
Laba 2013
- Laba TL, Bleasel J, Brien JA, Cass A, Howard K, Peiris D, et al. Strategies to improve adherence to medications for cardiovascular diseases in socioeconomically disadvantaged populations: a systematic review. International Journal of Cardiology 2013;167(6):2430‐40. [DOI] [PubMed] [Google Scholar]
Lutfey 1999
- Lutfey KE, Wishner WJ. Beyond 'compliance' is 'adherence'. Improving the prospect of diabetes care. Diabetes Care 1999;22(4):635‐9. [DOI] [PubMed] [Google Scholar]
Mayfield 2014
- Mayfield E, Laws MB, Wilson IB, Penstein Rosé C. Automating annotation of information‐giving for analysis of clinical conversation. JAMIA 2015;21(e1):e122‐8. [DOI] [PMC free article] [PubMed] [Google Scholar]
Meddings 2012
- Meddings J, Kerr EA, Heisler M, Hofer TP. Physician assessments of medication adherence and decisions to intensify medications for patients with uncontrolled blood pressure: still no better than a coin toss. BioMed Central Health Services Research 2012;12:270. [DOI] [PMC free article] [PubMed] [Google Scholar]
Miller 2002
- Miller LG, Liu H, Hays RD, Golin CE, Beck CK, Asch SM, et al. How well do clinicians estimate patients' adherence to combination antiretroviral therapy?. Journal of General Internal Medicine 2002;17(1):1‐11. [DOI] [PMC free article] [PubMed] [Google Scholar]
Moher 2009
- Moher D, Liberati A, Tetzlaff J, Altman DG, for the PRISMA Group. Preferred reporting items for systematic reviews and meta‐analyses: the PRISMA statement. BMJ 2009;339:b2535. [DOI] [PMC free article] [PubMed] [Google Scholar]
Mushlin 1977
- Mushlin AI, Appel FA. Diagnosing potential noncompliance. Physicians' ability in a behavioral dimension of medical care. Archives of Internal Medicine 1977;137(3):318–21. [DOI] [PubMed] [Google Scholar]
Nieuwlaat 2014
- Nieuwlaat R, Wilczynski N, Navarro T, Hobson N, Jeffery R, Keepanasseril A, et al. Interventions for enhancing medication adherence. Cochrane Database of Systematic Reviews 2014, Issue 11. [DOI: 10.1002/14651858.CD000011.pub4] [DOI] [PMC free article] [PubMed] [Google Scholar]
Piette 2004
- Piette JD, Heisler M, Wagner TH. Cost‐related medication underuse among chronically ill adults: the treatments people forgo, how often, and who is at risk. American Journal of Public Health 2004;94(10):1782–7. [DOI] [PMC free article] [PubMed] [Google Scholar]
Sabaté 2003
- Sabaté E. Adherence to Long‐term Therapies: Evidence for Action. Geneva: World Health Organization, 2003. [Google Scholar]
Shrank 2006
- Shrank WH, Hoang T, Ettner SL, Glassman PA, Nair K, DeLapp D, et al. The implications of choice: prescribing generic or preferred pharmaceuticals improves medication adherence for chronic conditions. Archives of Internal Medicine 2006;166(3):332–7. [DOI] [PubMed] [Google Scholar]
Simpson 2006
- Simpson SH, Eurich DT, Majumdar SR, Padwal RS, Tsuyuki RT, Varney J, et al. A meta‐analysis of the association between adherence to drug therapy and mortality. BMJ 2006;333(7557):15. [DOI] [PMC free article] [PubMed] [Google Scholar]
Sokol 2005
- Sokol MC, McGuigan KA, Verbrugge RR, Epstein RS. Impact of medication adherence on hospitalization risk and healthcare cost. Medical Care 2005;43(6):521‐30. [DOI] [PubMed] [Google Scholar]
Sutton 2014
- Sutton S, Kinmonth AL, Hardeman W, Hughes D, Boase S, Prevost AT, et al. Does electronic monitoring influence adherence to medication? Randomized controlled trial of measurement reactivity. Annals of Behavioral Medicine 2014;48(3):293‐9. [DOI] [PMC free article] [PubMed] [Google Scholar]
Touchette 2008
- Touchette DR, Shapiro NL. Medication compliance, adherence, and persistence: current status of behavioral and educational interventions to improve outcomes. Journal of Managed Care Pharmacy 2008;14(6):S2‐S10. [Google Scholar]
Viswanathan 2012
- Viswanathan M, Golin CE, Jones CD, Ashok M, Blalock SJ, Wines RCM, et al. Interventions to improve adherence to self‐administered medications for chronic diseases in the United States: a systematic review. Annals of Internal Medicine 2012;157(11):785–95. [DOI] [PubMed] [Google Scholar]
Vrijens 2012
- Vrijens B, Geest S, Hughes DA, Przemyslaw K, Demonceau J, Ruppar T, et al. A new taxonomy for describing and defining adherence to medications. British Journal of Clinical Pharmacology 2012;73(5):691‐705. [DOI] [PMC free article] [PubMed] [Google Scholar]
Woolf 2005
- Woolf SH, Johnson RE. The break‐even point: when medical advances are less important than improving the fidelity with which they are delivered. Annals of Family Medicine 2005;3(6):545–52. [DOI] [PMC free article] [PubMed] [Google Scholar]
Zeller 2008
- Zeller A, Taegtmeyer A, Martina B, Battegay E, Tschudi P. Physicians' ability to predict patients' adherence to antihypertensive medication in primary care. Hypertension Research 2008;31(9):1765–71. [DOI] [PubMed] [Google Scholar]
References to other published versions of this review
Zaugg 2016
- Zaugg V, Korb‐Savoldelli V, Durieux P, Sabatier B. Providing physicians with feedback on medication adherence. Effect on processes of care and patient outcomes. Cochrane Database of Systematic Reviews 2016, Issue 1. [DOI: 10.1002/14651858.CD012042] [DOI] [PMC free article] [PubMed] [Google Scholar]