

Abstract
Background
Although the benefits of vision screening seem intuitive, the value of such programmes in junior and senior schools has been questioned. In addition there exists a lack of clarity regarding the optimum age for screening and frequency at which to carry out screening.
Objectives
To evaluate the effectiveness of vision screening programmes carried out in schools to reduce the prevalence of correctable visual acuity deficits due to refractive error in school‐age children.
Search methods
We searched the Cochrane Central Register of Controlled Trials (CENTRAL) (which contains the Cochrane Eyes and Vision Trials Register) (2017, Issue 4); Ovid MEDLINE; Ovid Embase; the ISRCTN registry; ClinicalTrials.gov and the ICTRP. The date of the search was 3 May 2017.
Selection criteria
We included randomised controlled trials (RCTs), including cluster‐randomised trials, that compared vision screening with no vision screening, or compared interventions to improve uptake of spectacles or efficiency of vision screening.
Data collection and analysis
Two review authors independently screened search results and extracted data. Our pre‐specified primary outcome was uncorrected, or suboptimally corrected, visual acuity deficit due to refractive error six months after screening. Pre‐specified secondary outcomes included visual acuity deficit due to refractive error more than six months after screening, visual acuity deficit due to causes other than refractive error, spectacle wearing, quality of life, costs, and adverse effects. We graded the certainty of the evidence using GRADE.
Main results
We identified seven relevant studies. Five of these studies were conducted in China with one study in India and one in Tanzania. A total of 9858 children aged between 10 and 18 years were randomised in these studies, 8240 of whom (84%) were followed up between one and eight months after screening. Overall we judged the studies to be at low risk of bias. None of these studies compared vision screening for correctable visual acuity deficits with not screening.
Two studies compared vision screening with the provision of free spectacles versus vision screening with no provision of free spectacles (prescription only). These studies provide high‐certainty evidence that vision screening with provision of free spectacles results in a higher proportion of children wearing spectacles than if vision screening is accompanied by provision of a prescription only (risk ratio (RR) 1.60, 95% confidence interval (CI) 1.34 to 1.90; 1092 participants). The studies suggest that if approximately 250 per 1000 children given vision screening plus prescription only are wearing spectacles at follow‐up (three to six months) then 400 per 1000 (335 to 475) children would be wearing spectacles after vision screening and provision of free spectacles. Low‐certainty evidence suggested better educational attainment in children in the free spectacles group (adjusted difference 0.11 in standardised mathematics score, 95% CI 0.01 to 0.21, 1 study, 2289 participants). Costs were reported in one study in Tanzania in 2008 and indicated a relatively low cost of screening and spectacle provision (low‐certainty evidence). There was no evidence of any important effect of provision of free spectacles on uncorrected visual acuity (mean difference ‐0.02 logMAR (95% CI adjusted for clustering ‐0.04 to 0.01) between the groups at follow‐up (moderate‐certainty evidence). Other pre‐specified outcomes of this review were not reported.
Two studies explored the effect of an educational intervention in addition to vision screening on spectacle wear. There was moderate‐certainty evidence of little apparent effect of the education interventions investigated in these studies in addition to vision screening, compared to vision screening alone for spectacle wearing (RR 1.11, 95% CI 0.95 to 1.31, 1 study, 3177 participants) or related outcome spectacle purchase (odds ratio (OR) 0.84, 95% CI 0.55 to 1.31, 1 study, 4448 participants). Other pre‐specified outcomes of this review were not reported.
Three studies compared vision screening with ready‐made spectacles versus vision screening with custom‐made spectacles. These studies provide moderate‐certainty evidence of no clinically meaningful differences between the two types of spectacles. In one study, mean logMAR acuity in better and worse eye was similar between groups: mean difference (MD) better eye 0.03 logMAR, 95% CI 0.01 to 0.05; 414 participants; MD worse eye 0.06 logMAR, 95% CI 0.04 to 0.08; 414 participants). There was high‐certainty evidence of no important difference in spectacle wearing (RR 0.98, 95% CI 0.91 to 1.05; 1203 participants) between the two groups and moderate‐certainty evidence of no important difference in quality of life between the two groups (the mean quality‐of‐life score measured using the National Eye Institute Refractive Error Quality of Life scale 42 was 1.42 better (1.04 worse to 3.90 better) in children with ready‐made spectacles (1 study of 188 participants). Although none of the studies reported on costs directly, ready‐made spectacles are cheaper and may represent considerable cost‐savings for vision screening programmes in lower income settings. There was low‐certainty evidence of no important difference in adverse effects between the two groups. Adverse effects were reported in one study and were similar between groups. These included blurred vision, distorted vision, headache, disorientation, dizziness, eyestrain and nausea.
Authors' conclusions
Vision screening plus provision of free spectacles improves the number of children who have and wear the spectacles they need compared with providing a prescription only. This may lead to better educational outcomes. Health education interventions, as currently devised and tested, do not appear to improve spectacle wearing in children. In lower‐income settings, ready‐made spectacles may provide a useful alternative to expensive custom‐made spectacles.
Plain language summary
Screening school‐age children and adolescents for reduced vision caused by the need for spectacles
What is the aim of this review? The aim of this Cochrane Review was to find out if vision screening of school‐age children and adolescents reduces the number of children who need spectacles but who either don't have any or who are wearing the wrong prescription.
Key messages Vision screening and provision of free spectacles improves the number of children who have and wear the spectacles they need. In lower‐income settings, ready‐made spectacles may provide a useful alternative to expensive custom‐made spectacles.
What was studied in the review? Worldwide, an unmet need for corrective spectacles is the leading cause of reduced vision in children; short‐sightedness (unable to see objects in the distance clearly) has become the commonest eye condition. Reduced vision may affect academic performance and therefore choice of occupation and socio‐economic status in adult life. It can also be associated with other symptoms such as headaches. Vision screening programmes designed to identify children who need spectacles have therefore been introduced into schools. Such programmes improve access to health care for some children who would not otherwise have it, but the value of these screening programmes is debatable. This review was therefore designed to collect and evaluate any evidence regarding how well such programmes are working.
What are the main results of the review? Cochrane Review authors found seven relevant studies. These studies tested ways of improving the take‐up of spectacle prescriptions given as part of a screening programme. Five studies were from China, one from India and one from Tanzania. These studies compared: vision screening with free spectacles with vision screening alone; vision screening with education with vision screening alone; and vision screening and ready‐made spectacles with vision screening and custom‐made spectacles.
The review shows that:
• There are no studies comparing vision screening with no vision screening (evidence gap). • Vision screening with provision of free spectacles results in more children wearing spectacles after screening compared with giving the children a prescription on its own (high‐certainty evidence). Children in the free‐spectacle group had better educational attainment (low‐certainty evidence). • Vision screening with health education designed to increase spectacle uptake did not appear to improve the number of children wearing spectacles after screening compared with no education (moderate‐certainty evidence). • Ready‐made and custom‐made spectacles appear to give similar visual results and similar spectacle wearing (moderate‐ and high‐certainty evidence).
How up‐to‐date is this review? Cochrane Review authors searched for studies that had been published up to 3 May 2017.
Summary of findings
Summary of findings for the main comparison. Free spectacles versus no free spectacles (prescription only).
| Vision screening and provision of free spectacles compared with vision screening and provision of prescription for correctable visual acuity deficits in school‐age children and adolescents | ||||||
|
Patient or population: school‐age children and adolescents Settings: schools Intervention: vision screening and provision of free spectacles Comparison: vision screening and provision of prescription | ||||||
| Outcomes | Illustrative comparative risks* (95% CI) | Relative effect (95% CI) | No of participants (studies) | Certainty of the evidence (GRADE) | Comments | |
| Assumed risk1 | Corresponding risk | |||||
| prescription | free spectacles | |||||
|
Uncorrected visual acuity deficit due to refractive error Follow‐up: 6 months |
‐ | ‐ | ‐ | ‐ | ‐ | Not reported |
|
Uncorrected visual acuity deficit due to refractive error Follow‐up: more than 6 months |
‐ | ‐ | ‐ | ‐ | ‐ | Not reported |
| Visual acuity deficit due causes other than refractive error Follow‐up: 6 months | ‐ | ‐ | ‐ | ‐ | ‐ | Not reported |
|
Spectacle wearing Follow‐up: 6 months |
Low uptake of spectacles |
RR 1.60 (1.34 to 1.90) |
1092 (2 RCTs) |
⊕⊕⊕⊕ High | ||
| 250 per 1000 | 400 per 1000 (335 to 475) | |||||
| High uptake of spectacles | ||||||
| 750 per 1000 | 1000 per 1000 (1000 to 1000) | |||||
|
Quality of life Follow‐up: 6 months |
‐ | ‐ | ‐ | 2289 (1 RCT) |
⊕⊕⊝⊝ Low2 | In one study in China, children who received free spectacles had better educational attainment as measured by a standardised mathematics score (adjusted difference 0.11 (95% CI 0.01 to 0.21). This difference is equivalent to approximately half a term (semester) of additional learning. |
| Cost | In one study in Tanzania in 2008 the overall cost of screening and spectacle provision for each screened student was USD 0.87. The overall cost of screening and spectacle provision for each student who used spectacles was USD 46.3 (GBP 23.40) for free spectacles; USD 64.7 (GBP 32.70) for prescribed spectacles. Calculations were based on spectacle use of 47% if spectacles were provided free and 26% if spectacles were only prescribed. | ⊕⊕⊝⊝ Low3 | ||||
|
Adverse effects Follow‐up: any time period |
One study investigated the impact of assignment to free spectacles compared with prescription only on uncorrected visual acuity at follow‐up. There was a mean difference of ‐0.02 logMAR (95% CI adjusted for clustering ‐0.04 to 0.01) between the groups i.e. no evidence of any important impact of free spectacles on uncorrected acuity. | ⊕⊕⊕⊝ Moderate4 | Not reported | |||
| *The basis for the assumed risk (e.g. the median control group risk across studies) is provided in footnotes. The corresponding risk (and its 95% confidence interval) is based on the assumed risk in the comparison group and the relative effect of the intervention (and its 95% CI). CI: confidence interval; RCT: randomised controlled trial; RR: risk ratio | ||||||
| GRADE Working Group grades of evidence High‐certainty: we are very confident that the true effect lies close to that of the estimate of the effect Moderate‐certainty: we are moderately confident in the effect estimate; the true effect is likely to be close to the estimate of effect, but there is a possibility that it is substantially different Low‐certainty: we are moderately confident in the effect estimate; the true effect is likely to be close to the estimate of effect, but there is a possibility that it is substantially different Very low‐certainty: we have very little confidence in the effect estimate; the true effect is likely to be substantially different from the estimate of effect | ||||||
1Spectacle wearing in the comparator groups of studies included in this review varied from 23% to 96%. We have chosen 25% and 75% as illustrative risks. 2 Downgraded 1 level for imprecision and 1 level for indirectness. 3 Downgraded 2 levels for indirectness as costs very specific to location (Tanzania) and time period (nearly 10 years ago). 4 Downgraded 1 level for indirectness because average logMAR acuity may not adequately reflect proportion of children with important changes in uncorrected visual acuity.
Summary of findings 2. Educational intervention versus no educational intervention.
| Vision screening and educational intervention compared with vision screening and no educational intervention for school‐age children and adolescents | ||||||
|
Patient or population: school‐age children and adolescents Settings: schools Intervention: vision screening and educational intervention Comparison: vision screening and no educational intervention | ||||||
| Outcomes | Illustrative comparative risks* (95% CI) | Relative effect (95% CI) | No of participants (studies) | Certainty of the evidence (GRADE) | Comments | |
| Assumed1 risk | Corresponding risk | |||||
| Educational intervention | No educational intervention | |||||
|
Uncorrected visual acuity deficit due to refractive error Follow‐up: 6 months |
‐ | ‐ | ‐ | ‐ | ‐ | Not reported |
|
Uncorrected visual acuity deficit due to refractive error Follow‐up: more than 6 months |
‐ | ‐ | ‐ | ‐ | ‐ | Not reported |
|
Visual acuity deficit due causes other than refractive error Follow‐up: 6 months |
‐ | ‐ | ‐ | ‐ | ‐ | Not reported |
|
Spectacle wearing Follow‐up: 6 months |
Low uptake of spectacles |
RR 1.11 (0.95 to 1.31) |
3177 (1 RCT) |
⊕⊕⊕⊝ Moderate2 | Another study of 4448 participants reported odds ratio of 0.84 (0.55 to 1.31) for related outcome spectacle purchase | |
| 250 per 1000 | 278 per 1000 (238 to 328) | |||||
| High uptake of spectacles | ||||||
| 750 per 1000 | 833 per 1000 (713 to 983) | |||||
|
Quality of life Follow‐up: 6 months |
‐ | ‐ | ‐ | ‐ | ‐ | Not reported |
| Cost | ‐ | ‐ | ‐ | ‐ | ‐ | Not reported |
|
Adverse effects Follow‐up: any time period |
‐ | ‐ | ‐ | ‐ | ‐ | Not reported |
| *The basis for the assumed risk (e.g. the median control group risk across studies) is provided in footnotes. The corresponding risk (and its 95% confidence interval) is based on the assumed risk in the comparison group and the relative effect of the intervention (and its 95% CI). CI: confidence interval; RCT: randomised controlled trial; RR: risk ratio | ||||||
| GRADE Working Group grades of evidence High‐certainty: we are very confident that the true effect lies close to that of the estimate of the effect. Moderate‐certainty: we are moderately confident in the effect estimate; the true effect is likely to be close to the estimate of effect, but there is a possibility that it is substantially different. Low‐certainty: we are moderately confident in the effect estimate; the true effect is likely to be close to the estimate of effect, but there is a possibility that it is substantially different. Very low‐certainty: we have very little confidence in the effect estimate; the true effect is likely to be substantially different from the estimate of effect. | ||||||
1Spectacle wearing in the comparator groups of studies included in this review varied from 23% to 96%. We have chosen 25% and 75% as illustrative risks. 2Downgraded one level for imprecision.
Summary of findings 3. Ready‐made versus custom‐made spectacles.
| Vision screening and provision of ready‐made spectacles compared with vision screening and provision of custom‐made spectacles for correctable visual acuity deficits in school‐age children and adolescents | ||||||
|
Patient or population: school‐age children and adolescents Settings: schools Intervention: vision screening and ready‐made spectacles Comparison: vision screening and custom‐made spectacles | ||||||
| Outcomes | Illustrative comparative risks* (95% CI) | Relative effect (95% CI) | No of participants (studies) | Certainty of the evidence (GRADE) | Comments | |
| Assumed risk1 | Corresponding risk | |||||
| custom‐made | ready‐made | |||||
|
Uncorrected visual acuity deficit due to refractive error Follow‐up: 6 months |
‐ | ‐ | ‐ | 414 (1 RCT) |
⊕⊕⊕⊝ Moderate2 | In one study, mean logMAR acuity in better and worse eye was similar between groups: MD better eye 0.03 logMAR, 95% CI 0.01 to 0.05; MD worse eye 0.06 logMAR, 95% CI 0.04 to 0.08 |
|
Uncorrected visual acuity deficit due to refractive error Follow‐up: more than 6 months |
‐ | ‐ | ‐ | ‐ | ‐ | Not reported |
|
Visual acuity deficit due to causes other than refractive error Follow‐up: 6 months |
‐ | ‐ | ‐ | ‐ | ‐ | Not reported |
|
Spectacle wearing Follow‐up: 6 months |
Low uptake of spectacles | RR 0.98, (0.91 to 1.05) | 1203 (3 RCTs) |
⊕⊕⊕⊕ High | ||
| 250 per 1000 |
245 per 1000 (228 to 263) |
|||||
| High uptake of spectacles | ||||||
| 750 per 1000 |
735 per 1000 (683 to 788) |
|||||
|
Quality of life Measured using the NEI‐RQL‐42. Higher scores are better quality of life. Follow‐up: 6 months |
The mean change in quality of life score between baseline and follow‐up was 4.65 (95% CI 2.45 to 6.86) in children with custom‐made spectacles | The mean quality of life score was 1.43 better (1.04 worse to 3.90 better) in children with ready‐made spectacles. | ‐ | 188 (1 RCT) |
⊕⊕⊕⊝ Moderate3 | Follow‐up was 2 months in this study |
| Cost | ‐ | ‐ | ‐ | ‐ | ‐ | Not reported |
|
Adverse effects Follow‐up: any time period |
Adverse effects were reported in one study and were similar between groups. These included: blurred vision, distorted vision, headache, disorientation, dizziness, eyestrain and nausea | ⊕⊕⊝⊝ Low4 | ||||
| *The basis for the assumed risk (e.g. the median control group risk across studies) is provided in footnotes. The corresponding risk (and its 95% confidence interval) is based on the assumed risk in the comparison group and the relative effect of the intervention (and its 95% CI). CI: confidence interval; NEI‐RQL‐42: National Eye Institute Refractive Error Quality of Life scale 42; RR: risk ratio | ||||||
| GRADE Working Group grades of evidence High‐certainty: we are very confident that the true effect lies close to that of the estimate of the effect. Moderate‐certainty: we are moderately confident in the effect estimate; the true effect is likely to be close to the estimate of effect, but there is a possibility that it is substantially different. Low‐certainty: we are moderately confident in the effect estimate; the true effect is likely to be close to the estimate of effect, but there is a possibility that it is substantially different. Very low‐certainty: we have very little confidence in the effect estimate; the true effect is likely to be substantially different from the estimate of effect. | ||||||
1Spectacle wearing in the comparator groups of studies included in this review varied from 23% to 96%. We have chosen 25% and 75% as illustrative risks. 2Downgraded 1 level for indirectness because average logMAR acuity may not adequately reflect proportion of children with uncorrected visual acuity deficit . 3Downgraded 1 level for indirectness as follow‐up was 2 months rather than 6 months, pre‐specified and reported in only one location (China). 4Downgraded 1 level for imprecision and 1 level for indirectness as only reported in one location (China).
Background
Description of the condition
Refractive error (need for spectacles) can be defined as the inability of an eye to bring parallel rays of light into focus on the retina resulting in a blurred image. There are three types of refractive error. Myopia (short‐sightedness) compromises distance vision. Hypermetropia (long‐sightedness) compromises near vision and, if severe enough, distance vision as well. Astigmatism, caused by a non‐spherical cornea, impairs both distance and near vision.
In normal visual development, changes in refractive error occur over the first few years of life. The majority of full‐term babies are hypermetropic at birth (Banks 1980) but this decreases with growth so that in adult life the preponderance of refractions are around zero or emmetropia (Sorsby 1964). Most of this change occurs in early childhood (Ehrlich 1997) in a process known as emmetropisation (Jensen 1995). The main risk factors for development of myopia appear to be intensive education and limited time outdoors (Morgan 2017). Myopia can be inherited (Yap 1994), possibly through the genetic determination of the axial length of the eye (Canoll 1982).
Myopia is a common condition. Some authors estimate that 34% of the world population will be affected by myopia in 2020 (uncertainty interval 26% to 43%) (Holden 2016). This corresponds to 2620 million people (1976 to 3366 million people). There is considerable global variation in the prevalence of myopia in children. A recent systematic review and meta‐analysis of population‐based studies suggested that 70% (95% credible interval (CrI) 61% to 77%) of East Asian children have myopia by the time they are 15 years old (Rudnicka 2016). East Asian was defined as Chinese, Japanese, Mongolian and Taiwanese. This high prevalence contrasts with relatively low prevalence in black children living in Africa (6%, 95% CrI 3% to 9%) and slightly higher prevalence in white children (17%, 95% CrI 11% to 25%). This review also provides evidence that there has been a 23% increase in myopia prevalence per decade in East Asian children (adjusted odds ratio per decade 1.23, 95% CrI 1 to 1.55). In contrast over the same period, the prevalence of myopia in white children has appeared to be stable (adjusted odds ratio per decade 0.85, 95% CrI 0.69 to 1.05). However, a study in the UK published since the review was done, has suggested that there has been an increase in myopia prevalence in white children, albeit to a smaller degree (from 7% in the 1960s to 16% between 2006 to 2008) (McCullough 2016).
Uncorrected refractive error is an important cause of visual impairment in children. Approximately 1% of children (13 million) worldwide are estimated to be visually impaired due to uncorrected refractive error (Resnikoff 2008). There is important global variation in the prevalence of visual impairment due to uncorrected refractive error ranging from 0.034% in the Western Pacific Region (A) to 5.94% in China (Resnikoff 2008). Studies show that children with refractive error often do not have spectacles or are not wearing optimal correction (Sharma 2012).
Uncorrected visual acuity deficit has been shown to have a negative impact on academic performance in some (Goldstand 2005; Maples 2003; ) but not all (Dirani 2010) studies. Qualitative studies have described how uncorrected visual deficits may lead to reduced focus, perseverance and class participation, affecting academic performance and leading to psychosocial stress (Dudovitz 2016),
Description of the intervention
Vision screening involves testing the visual acuity of children in schools or communities with the aim of identifying children with reduced vision.
Reduced vision is detected at screening using age‐appropriate visual acuity tests; commonly letter, picture, illiterate E or Landolt C optotypes. Although visual impairment and refractive error are correlated, the level at which refractive error becomes significant enough to impact on visual performance varies considerably depending on the individual and measurement‐specific variables (WHO 2002). Data from the Sydney Myopia Study suggests that uncorrected visual acuity of 6/9.5 or less has a high sensitivity (97.8%) and specificity (97.1%) for detecting refractive errors in adolescents (Leone 2010). Similar results were seen in the NICER study in Northern Ireland (UK) (O'Donoghue 2012).
Treatment for reduced visual acuity due to refractive error in school age children usually consists of optical correction of the error. Spectacles are a simple and effective means of correcting refractive error and are the most widely used treatment. Contact lenses are used as an alternative to spectacles in specific clinical circumstances (keratoconus, severe anisometropia, high refractive power) mainly in high‐income countries but increasingly also in urban centres of low‐ and middle‐income countries.
Provision of optical correction requires measurement of the type and degree of refractive error in each eye. This can be done clinically (by retinoscopy) or by an automated refractometer. The optical centres of the corrective lenses in spectacles must align with the visual axis of each eye. Spectacles without astigmatic correction and where the refractive error is the same in both eyes can be mass produced at low cost. These are known as 'ready‐made' spectacles.
Optical correction of the refractive error will result in a more or less immediate improvement in visual acuity to a normal level, if spectacles are worn. Whether or not children wear spectacles is an important determinant of a screening programme's success. The availability, affordability and acceptability of spectacles may affect whether any that are prescribed are actually worn. Barriers to spectacle use are likely to be complex and include cultural and economic factors. Over‐prescribing, whereby spectacles are prescribed for insignificant refractive error is probably one important factor leading to a low proportion of children wearing prescribed spectacles (Sharma 2012). Other factors may include concerns over appearance, teasing from peers, discomfort, negative parental attitudes, cost, and beliefs that spectacles will lead to weaker eyes.
There is debate as to whether optical correction can result in persistence of a refractive error that might otherwise have naturally resolved or reduced. Animal experiments suggest that emmetropisation may be affected by optical correction (Hung 1995). Currently available evidence from human populations does not provide support for this hypothesis (Walline 2011).
Visual acuity screening programmes vary with regard to who carries out the testing, for example teachers, nurses, optometrists, parents, other volunteers or computer programs (Sharma 2012). Vision screening programmes can be provided as part of the government healthcare system or can be run by non‐governmental organisations, such as charities or the private sector.
Regular screening activities for correctable visual acuity deficits are concentrated in high‐income countries. In Ohio USA, for example, children are screened at kindergarten and then bi‐annually throughout their school careers (Ohio 2004); in Sweden visual acuity is measured in pre‐school age children and again at seven and 10 years of age (Kvarnstrom 2001). In the UK routine vision screening is recommended for four‐ to five‐year‐old children only (PHE 2017). Although screening programmes have been introduced in lower‐income countries (Limburg 1999) the great majority of children never receive an eye examination and access to health services is often limited, especially in rural areas (Congdon 2008; Ma 2014; Wedner 2000; Wedner 2003).
How the intervention might work
Vision screening for correctable visual acuity deficit is expected to work by identifying children who require spectacles, but who currently do not have them, and enabling access to spectacles for those children. One of the roles of mass vision screening in this context is to improve equity of access to care.
It should be noted that visual acuity screening programmes for undetected, correctable visual acuity deficits will inevitably identify some children with reduced vision due to causes other than refractive error, for example cataract or amblyopia, although these will occur much less commonly than refractive error. Whilst these conditions are not the focus of this review, we will describe any data found regarding the proportions of such conditions detected by screening.
Why it is important to do this review
Given the high prevalence of visual impairment due to uncorrected refractive errors in children, and the simplicity of treatment, the detection and correction of refractive errors has been made one of the priorities of the World Health Organization (WHO) Vision 2020 initiative (Resnikoff 2001). Observed variation in provision of screening programmes worldwide highlights the uncertainty around the effects of such programmes (Hopkins 2013). A review of the evidence for the effectiveness of screening in reducing the proportion of school‐age children and adolescents with an uncorrected correctable visual acuity deficit is important to resolve this uncertainty and identify future directions for research.
Objectives
To evaluate the effectiveness of vision screening programmes carried out in schools to reduce the prevalence of correctable visual acuity deficits due to refractive error in school‐age children.
Methods
Criteria for considering studies for this review
Types of studies
We included randomised controlled trials (parallel or cluster design) of vision screening conducted after the first year at school. We did not have any language or date restrictions.
Types of participants
We considered participants identified by a school vision screening programme to have reduced visual acuity due either to an unidentified refractive error or suboptimal correction of a previously identified refractive error.
Types of interventions
Vision screening carried out by visual acuity assessment using any age‐appropriate vision test was the intervention of interest. We included studies applying any threshold for failure and administered by any testing personnel, measuring the following:
monocular visual acuity, binocular visual acuity or both;
distance visual acuity only;
near and distance visual acuity.
Trials of interventions designed to improve the cost‐effectiveness of screening were also eligible for inclusion.
We planned the following comparisons:
screening versus no screening;
failure threshold of worse than 6/9 (Snellen) (or equivalent) versus failure threshold of 6/9 (Snellen) or better (or equivalent);
type of testing personnel, that is nurses, teachers, and eye trained personnel;
interventions to improve spectacle use versus no intervention to improve spectacle use;
interventions to reduce cost.
Any studies of visual acuity screening at or before school entry are more likely to have amblyopia as their target condition and are therefore not relevant to this review.
Types of outcome measures
Primary outcomes
Uncorrected, or suboptimally corrected, visual acuity deficit due to refractive error at six months after screening
Secondary outcomes
Uncorrected or suboptimally corrected, visual acuity deficits more than six months after screening
Visual acuity deficit due to causes other than refractive error, for example cataract, amblyopia
Compliance with spectacles prescribed as a result of vision screening (i.e. spectacle wearing)
Quality of life: any formal, validated assessment of quality of life undertaken, for example, the National Eye Institute Refractive Error Quality of Life‐42 (NEI‐RQL‐42) (Hays 2003). We included assessment of general confidence, academic achievement, employment, social interaction etc
Costs: this refers to any comparative information on costs or resources incurred at any time period.
Follow‐up: six months unless otherwise specified.
Adverse effects
We extracted data on the following adverse effects.
Impact of correction of refractive error on the development of refractive error by comparing the prevalence and degree of refractive error in screened versus unscreened populations
Anxiety (from interviews, self‐completion questionnaires, focus groups etc)
Prevalence of over prescribing
Any other adverse effect as reported
Search methods for identification of studies
Electronic searches
The Cochrane Eyes and Vision Information Specialist conducted systematic searches in the following databases for randomised controlled trials and controlled clinical trials. There were no language or publication year restrictions. The date of the search was 3 May 2017.
Cochrane Central Register of Controlled Trials (CENTRAL; 2017, Issue 4) (which contains the Cochrane Eyes and Vision Trials Register) in the Cochrane Library (searched 3 May 2017) (Appendix 1);
MEDLINE Ovid (1946 to 3 May 2017) (Appendix 2);
Embase Ovid (1980 to 3 May 2017) (Appendix 3);
ISRCTN registry (www.isrctn.com/editAdvancedSearch; searched 3 May 2017) (Appendix 4);
US National Institutes of Health Ongoing Trials Register ClinicalTrials.gov (www.clinicaltrials.gov; searched 3 May 2017) (Appendix 5);
World Health Organization (WHO) International Clinical Trials Registry Platform (ICTRP)(www.who.int/ictrp; searched 3 May 2017) (Appendix 6).
Searching other resources
We did not do any handsearching for the current update (2018). For previous editions of this review we manually searched the British Orthoptic Journal from 2003 to publication date (years prior to 2003 had already been searched) and the following conference proceedings:
European Strabismus Association (ESA);
International Strabismus Association (ISA);
American Association of Paediatric Ophthalmology and Strabismus (AAPOS);
Royal College of Ophthalmologists (RCO).
Data collection and analysis
Selection of studies
For previous editions of this review, one review author checked the search results and selected all reports of studies that made reference to refractive error, myopia and vision screening. Any reports that were clearly not relevant were excluded at first viewing. Two authors then screened the remaining titles and abstracts of the reports to establish if they met the inclusion criteria for this review.
For the current update, two authors independently screened the citations arising from the electronic searches using online review management software (Covidence).
Data extraction and management
For previous versions of this review, two authors independently extracted data from trials that met the inclusion criteria using the Cochrane Eyes and Vision data collection form.
For the current update, two authors independently extracted data and we used a data extraction template in Covidence (available on request). We re‐extracted data for all included studies and imported them into Review Manager 5 (Review Manager 2014) from Covidence. As two of the review authors were also authors of one of the included studies (Morjaria 2016), an independent assessor extracted data on this trial (Acknowledgements).
Assessment of risk of bias in included studies
We assessed risk of bias using the guidelines in Chapter 8 of the Cochrane Handbook for Systematic Reviews of Interventions (Higgins 2011a).
We assessed the following domains for all studies.
Selection bias: we considered how the random sequence was generated and whether this allocation was concealed.
Performance bias: we considered whether the participants and personnel were masked and whether this masking was effective.
Detection bias: we considered whether the outcome assessors were masked and whether this was likely to be effective.
Attrition bias: we considered the completeness of the outcome data with particular reference to attrition and exclusions, and handling of any incomplete outcome data.
Selective reporting: we considered the bias introduced by selective reporting.
We also considered three additional sources of bias for cluster‐randomised studies as described in Chapter 16 of the Cochrane Handbook for Systematic Reviews of Interventions (Higgins 2011b).
Baseline imbalance: this may be an issue in studies with small numbers of clusters.
Recruitment bias: this can occur when individuals are recruited to the trial after the clusters have been randomised.
Loss of clusters: this is analogous to incomplete outcome data for individuals.
We graded domains as low risk of bias, high risk of bias or unclear.
Measures of treatment effect
We used the risk ratio as the measure of effect for dichotomous variables. All of our outcomes were dichotomous with the exception of quality of life. For continuous outcomes, such as quality of life, we used the mean difference. We considered whether or not this outcome was skewed using Altman's method (Altman 1996).
Unit of analysis issues
The main unit of analysis issue in this review relates to cluster‐randomised trials. The studies included in this review were correctly reported with confidence intervals adjusted for the additional variance introduced by the cluster design. It was not always straightforward to pool the results of different studies, however, because they reported different effect measures. In order to pool the results of studies, we did an approximate analysis following guidelines in Chapter 16 of the Cochrane Handbook for Systematic Reviews of Interventions (Higgins 2011b). We extracted the raw data and reduced the sample size to take into account the cluster design by dividing the sample size by the estimated design effect. We calculated an estimated design effect by comparing the variance with and without taking into account the clustering.
Dealing with missing data
We used data as reported by the included studies and did not impute data. We considered the risk of bias introduced by incomplete outcome data (Assessment of risk of bias in included studies). We contacted investigators for clarification as needed.
Assessment of heterogeneity
We assessed heterogeneity by examining the characteristics of the included studies. We also inspected the forest plots to assess variation in direction and size of the effect and poor overlap of confidence intervals. We tested for the statistical significance of heterogeneity using the Chi2 test, being aware that this test may have low power when there are few trials, or the trials are small, therefore a non‐significant result may not be evidence of no heterogeneity. We also calculated the I2 statistic (Higgins 2003), which describes the percentage of the variability in effect estimates that is due to heterogeneity rather than sampling error (chance) as described in Chapter 9 of the Cochrane Handbook for Systematic Reviews of Interventions (Deeks 2011).
Data synthesis
We pooled data using Cochrane's review management software (Review Manager 2014). We used a fixed‐effects model as only three studies or fewer were included in any analysis. We did a sensitivity analysis to compare the results of fixed‐effect and random‐effects models to test how robust our assumptions were as to the most relevant model.
Summary of findings
We prepared a 'Summary of findings' table for the following three comparisons following guidance in Chapter 11 of the Cochrane Handbook for Systematic Reviews of Interventions (Schünemann 2011).
Vision screening and provision of free spectacles compared with vision screening and provision of prescription
Vision screening and educational intervention compared with vision screening and no educational intervention
Vision screening and provision of ready‐made spectacles compared with vision screening and provision of custom‐made spectacles
The 'Summary of findings' table provides outcome‐specific information. We graded the certainty of the evidence for each outcome using the GRADE approach (Schünemann 2011) to assist with the interpretation of the findings. Each outcome was initially assessed as high certainty (as data drawn from randomised controlled trials) but we then downgraded it one level for serious (or two levels for very serious) concerns in the following domains: study limitations (risk of bias), indirectness of evidence, inconsistency, imprecision or publication bias.
The following outcomes are included in the 'Summary of findings' tables.
Uncorrected visual acuity deficit due to refractive error: follow‐up six months
Uncorrected visual acuity deficit due to refractive error: follow‐up more than six months
Visual acuity deficit due to causes other than refractive error: follow‐up six months
Spectacle wearing: follow‐up six months
Adverse effects: follow‐up any time period
Quality of life: follow‐up six months
Cost
Results
Description of studies
Results of the search
The original electronic searches identified a total of 901 reports of studies. Full‐text copies were obtained for three papers where no abstract was provided; we excluded all three papers as they were not trials (Cross 1985; Gole 2001; Yamada 2004). An additional 528 reports were identified in the first update of this review; none of these were eligible for inclusion. Updated searches conducted in May 2017 identified 2491 new records (Figure 1). After 715 duplicates were removed the Cochrane Information Specialist (CIS) screened the remaining 1776 records and removed 1547 references that were not relevant to the scope of the review. We screened the remaining 229 records and obtained 16 full‐text reports for further assessment. We included nine reports of seven studies (see Characteristics of included studies for details) and one study is currently awaiting classification (Wang 2017). We excluded six studies, see Characteristics of excluded studies for details. We did not identify any ongoing studies from our searches of the clinical trials registries.
1.
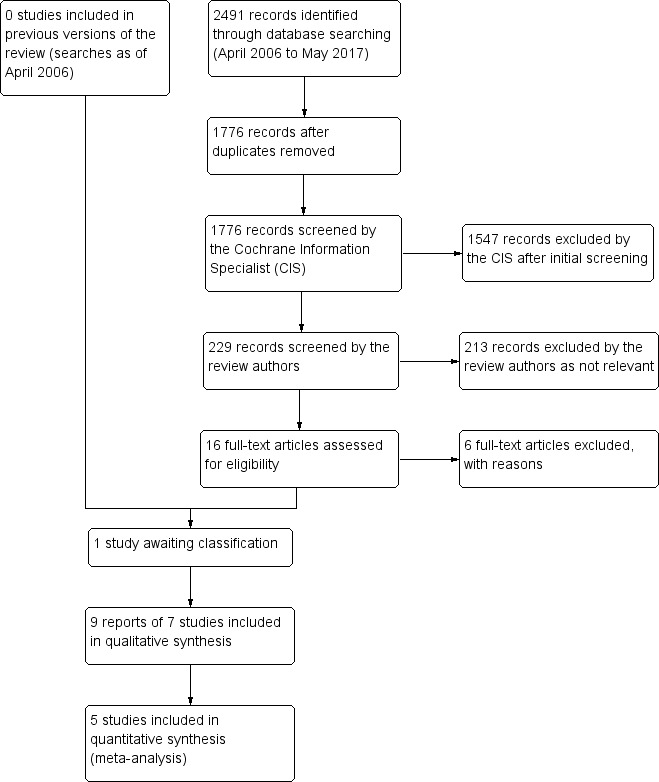
Study flow diagram
Included studies
We included seven studies in this review (Congdon 2011; Morjaria 2016; RECS 2009; SIL 2014; SIL II 2015; WEAR 2017; Wedner 2008).
Study design and setting
There were four cluster‐randomised studies (Congdon 2011; SIL 2014; SIL II 2015; Wedner 2008) and three individually randomised studies (Morjaria 2016; RECS 2009; WEAR 2017). Five studies were conducted in China (Congdon 2011; RECS 2009; SIL 2014; SIL II 2015; WEAR 2017), one in India (Morjaria 2016) and one in Africa (Wedner 2008). All the studies were conducted in schools.
All the cluster‐randomised trials were analysed appropriately with standard errors adjusted for clustering by school.
Participants
Participants in these studies were male and female children, between the ages of 10 to 12 years (SIL II 2015), 11 to 15 years (Morjaria 2016), 12 to 15 years (RECS 2009; WEAR 2017), 12 to 17 years (Congdon 2011), 12 to 18 years (Wedner 2008) or an average age of 10.5 years (SIL 2014) (range not reported).
The following table shows the number of children randomised and followed up in the trials.
| Study | Number randomised | Number followed up | % followed up | Number of schools (cluster‐randomised controlled trials only) |
| Congdon 2011 | 4448 | 3200 | 72% | 20 |
| Morjaria 2016 | 460 | 362 | 79% | |
| RECS 2009 | 495 | 414 | 84% | |
| SIL 2014 | 3177 | 3054 | 96% | 252 |
| SIL II 2015 | 728 | 693 | 95% | 94 |
| WEAR 2017 | 426 | 409 | 96% | |
| Wedner 2008 | 125 | 108 | 86% | 37 |
| Total | 9859 | 8240 | 84% |
The children recruited to these studies had visual impairment due to refractive error. The inclusion criteria are shown in the following table. Presenting visual acuity means visual acuity with usual spectacles.
| Study | Visual acuity | Minimum vision improvement with full correction |
Difference between the spherical equivalent of the right and left eyes (anisometropia) D = dioptres |
Minimum uncorrected spherical refractive error |
Astigmatism D = dioptres |
| Congdon 2011 | 6/12 or worse in either eye (presenting) | 2 or more lines in either eye | |||
| Morjaria 2016 | Worse than 6/9 in better eye (presenting) | 2 or more lines in better eye | 1 D or less | Spherical equivalent corrects the visual acuity to not more than one line less than best corrected visual acuity with a full prescription in the better eye | |
| RECS 2009 | 6/12 or worse in better eye (presenting) | Less than 2 D myopic Less than 1 D hyperopic |
1 D or more | Less than 2 D | |
| SIL 2014 | 6/12 or worse in either eye (uncorrected) | Better than 6/12 with spectacles | |||
| SIL II 2015 | 6/12 or worse in either eye (uncorrected) | "refractive error meeting cutoffs shown to be associated with significantly greater improvement in visual acuity when corrected: myopia <0.75 diopters (D), hyperopia >þ2.00 D, or astigmatism (nonspherical refractive error) >1.00 D." | |||
| WEAR 2017 | 6/12 or worse in both eyes (presenting) | Better than 6/7.5 in both eyes | Less than 2 D | ‐1.00 D or less | Less than 2 D |
| Wedner 2008 | Worse than 6/12 in either eye (presenting) | ||||
There were additional criteria for trials of ready‐made versus custom‐made spectacles, that is, inter pupillary distance matched that of ready‐made spectacle frames available (i.e. 54 mm to 62 mm), and spectacle frames were of acceptable size and fit (Morjaria 2016).
Interventions and comparators
None of these studies addressed the comparison of primary interest to this review, that is, considered the prevalence of correctable, uncorrected visual acuity deficits in school‐age children and adolescents in screened populations compared with populations who had no screening.
The included studies considered strategies either to improve the uptake of spectacle wear in school vision screening programmes or to increase the cost‐effectiveness of school screening programmes. Some studies considered more than one strategy.
The interventions and comparators are set out in the following table.
| Type of intervention | Intervention | Comparator | Studies |
| Interventions to improve uptake | Provision of free spectacles | No free spectacles (prescription only) | Wedner 2008; SIL 2014 |
| Free spectacles combined with a teacher incentive | No free spectacles or teacher incentive | SIL II 2015 | |
| Provision of voucher | No voucher (prescription only) | SIL 2014 | |
| Educational intervention | No educational intervention | Congdon 2011; SIL 2014 | |
| Interventions to improve efficiency or cost‐effectiveness | Ready‐made spectacles | Custom‐made spectacles | Morjaria 2016; RECS 2009; WEAR 2017 |
| Rural refractionist | University optometrist | WEAR 2017 | |
| Self‐refraction | University optometrist | WEAR 2017 |
Outcomes
The studies all followed up at slightly different time periods. Follow‐up ranged from one month (RECS 2009), two months (WEAR 2017), three months (Wedner 2008), three to four months (Morjaria 2016), six months (Congdon 2011; SIL II 2015), and eight months (SIL 2014).
There was some variation in outcomes depending on the objective of the trials.
Most of the studies looked at some measure of spectacle wear, either purchase of spectacles (Congdon 2011), observed spectacle wear (Congdon 2011; Morjaria 2016; RECS 2009; SIL 2014;SIL II 2015; Wedner 2008), self‐reported spectacle wear (Congdon 2011; SIL 2014; SIL II 2015) or frequency of spectacle wear (Congdon 2011; RECS 2009; SIL II 2015). Reasons for non‐wear were also assessed (Congdon 2011;Morjaria 2016) and predictors of wear (Wedner 2008).
Fewer studies looked at visual acuity. Congdon 2011 assessed presenting and uncorrected vision, and also measured refraction along with the power of spectacles and spectacle‐corrected vision when spectacles were available. WEAR 2017 assessed the proportion with best‐corrected visual acuity better or equal to 6/6 and also considered the vector dioptric difference values between the prescription power and power measured by lensometry in the better‐seeing eye falling within 0.25 dioptres, 0.50 dioptres and 1.0 dioptre. Wedner 2008 reported the prevalence of uncorrected significant refractive error.
RECS 2009 looked at other outcomes including:
previous and planned use
perceived value
adaptation time
spectacle remakes
symptoms
SIL 2014 reported educational attainment (maths test).
Only one study examined quality of life (WEAR 2017) using the NEI‐RQL‐42 questionnaire. The study also examined patient satisfaction and self‐reported rating of study spectacles.
Excluded studies
We excluded nine studies (Characteristics of excluded studies). For most of these studies this was because, on closer inspection it was obvious that these were not randomised controlled trials. One of these studies was a randomised controlled trial but it was addressing a different hypothesis relating to the progression of myopia (Li 2013).
Risk of bias in included studies
See Figure 2
2.
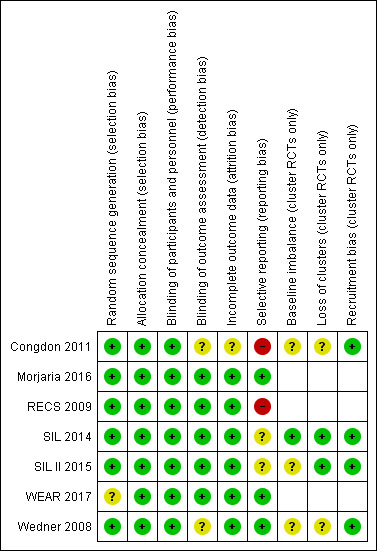
Risk of bias summary: review authors' judgements about each risk of bias item for each included study
Allocation
Random sequence generation
Most of the trials described an adequate method of generating the random sequence. This was either by random number tables (Congdon 2011), computer‐generated using Excel (Morjaria 2016), R software (SIL 2014; SIL II 2015) or other computer generated random number (RECS 2009;Wedner 2008). WEAR 2017 did not clearly report random sequence generation.
Allocation concealment
We judged all seven studies as having adequate allocation concealment. Three of the studies were cluster‐randomised studies where the allocation of schools was done at the beginning of the study (Congdon 2011; RECS 2009; Wedner 2008).
Two studies had central allocation (SIL 2014; SIL II 2015). One study delivered the allocation in "Sequentially numbered, sealed, stamped opaque envelopes containing labels with unique study identification numbers and random allocation" "prepared by persons not involved in the trial." (Morjaria 2016).
Two studies did not specifically mention allocation concealment but the description of the study procedures suggested that enrolment was likely to have been masked. "Both the participant and those involved in data collection were masked to the type of spectacles ordered. Masking was maintained during follow‐up" (RECS 2009). "Subjects and study personnel administering the questionnaires and assessing VA were masked to study group assignment." (WEAR 2017).
Blinding
Performance bias
We judged all the studies to be at low risk of performance bias. Some studies made explicit statements as to masking of participants and carers (Morjaria 2016; RECS 2009; WEAR 2017; Wedner 2008) and certainly this masking was relatively straightforward in trials of ready‐made and custom spectacles (Morjaria 2016; RECS 2009). The cluster‐randomised trials avoided discussion of interventions in other schools (SIL 2014; SIL II 2015; Wedner 2008). This was not explicitly stated in Congdon 2011 but is likely and the overall negative result of the study suggests that significant bias unlikely.
Detection bias
Five out of the seven studies reported efforts to mask outcome assessment (Morjaria 2016; RECS 2009; SIL 2014; SIL II 2015; WEAR 2017). In Wedner 2008 this was not clearly described. Congdon 2011 did not mask the outcome assessments but any bias would have been expected to favour the intervention (education), which was not the case.
Incomplete outcome data
Follow‐up was high and reasonably balanced between groups in most studies (6) and we judged these to be at low risk of attrition bias. In SIL 2014; SIL II 2015 and WEAR 2017 follow‐up was over 95% and balanced between groups. In RECS 2009 and Wedner 2008 follow‐up was over 80% and again balanced between groups. In Morjaria 2016 follow‐up was nearly 80% in each group and balanced between groups and reasons for loss to follow‐up were unlikely to be associated with outcome, “All children not followed up in school (n = 98) had changed schools and moved to a different area.". In Congdon 2011 follow‐up was lower (72%) but again balanced so we judged it to be unclear whether this would have introduced bias.
Selective reporting
Selective reporting was harder to judge. Two studies reported all pre‐planned outcomes (Morjaria 2016; Wedner 2008), other studies did not report all pre‐planned outcomes but the missing outcomes were not relevant to the review (SIL 2014; SIL II 2015; WEAR 2017). Two studies did not report some of our pre‐specified review outcomes. Congdon 2011 did not report the prevalence of refractive error at six months and RECS 2009 did not report spectacle use at 6 to 12 months.
Other potential sources of bias
For the cluster‐randomised controlled trials only (Congdon 2011; SIL 2014; SIL II 2015; Wedner 2008) we considered three additional potential sources of bias.
Baseline imbalance
Baseline data were poorly reported at the cluster level but individual‐level data were available that largely suggested no major imbalances in these trials. Only SIL 2014 provided enough information to be confident that there were no baseline imbalances.
Loss of clusters
Again there was no strong evidence that this was a problem but only two studies provided enough information to judge definitively (SIL 2014; SIL II 2015).
Recruitment bias
Although this was not addressed directly the trials had made efforts to mask treatment assignment and we felt that recruitment bias was unlikely in a school setting.
Effects of interventions
See: Table 1; Table 2; Table 3
Interventions to improve uptake
Comparison: provision of free spectacles versus no free spectacles (prescription only)
See Table 1.
Two studies compared provision of free spectacles versus no free spectacles (prescription only). Both of these studies were cluster‐randomised trials. Wedner 2008 randomised 37 schools in Tanzania involving 125 children aged 12 to 18 years (average age 14 years) and followed up for three months, at which point they measured spectacle use. SIL 2014 randomised 252 schools in China, with 2189 children aged on average 10.5 years and followed up for approximately eight months. This study also had a third study arm who received vouchers only.
Outcome: uncorrected visual acuity deficits due to refractive error (primary outcome) within six months of screening
Not reported
Outcome: uncorrected visual acuity deficits due to refractive error more than six months after screening
Not reported
Outcome: proportion of participants with visual acuity deficit due to causes other than refractive error at six months and more than six months
Not reported
Outcome: compliance with spectacles prescribed as a result of vision screening (i.e. spectacle wearing)
Wedner 2008 defined spectacle wearing as either wearing spectacles or had them at school. Children who had received free spectacles were more likely to be wearing spectacles (or have them at school) (27/58, 47%) compared with children who had been given a prescription only (13/50 (26%) three months after screening. Wedner 2008 reports an odds ratio of 2.4 (95% confidence intervals (CI) 1.0 to 6.7) adjusted for clustering.
SIL 2014 defined spectacle wearing as "wearing glasses during an unannounced examination". Children who had received free spectacles were more likely to be wearing spectacles (469/1153, 41%) compared with children given a prescription only (266/1036, 26%) at follow‐up (approximately eight months after screening). SIL 2014 reported a risk ratio adjusted for baseline wear and clustering of 1.54 (95% CI 1.28 to 1.85).
It was a little difficult to pool these two different effect measures directly but an approximate analysis is provided in Figure 3. We have used the raw data and reduced the sample size to take into account the cluster design by dividing the sample size by the estimated design effect (calculated by comparing the variance with and without taking into account the clustering). The analysis suggests an approximate 60% increased wearing of spectacles in the free‐spectacles group (RR 1.60, 95% CI 1.34 to 1.90; 2 studies; 1092 participants). The results of the two studies were reasonably consistent. We judged this to be high‐certainty evidence.
3.
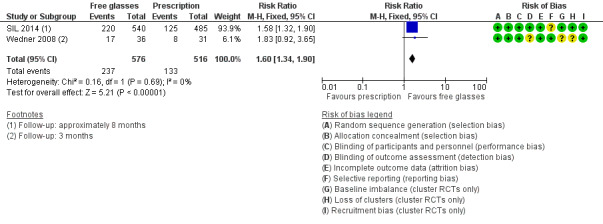
Forest plot of comparison: 1 Free glasses compared with prescription only, outcome: 1.1 Spectacle wearing.
SIL 2014 also reported similar findings with self‐reported spectacle wear (RR 1.81, 95% CI 1.61 to 2.04). Wedner 2008 reported spectacle wear with the same definition as above but also including children who self‐reported that they had spectacles at home. There was a very high odds ratio of 14.3 (4.6 to 50).
In SIL 2014 children who had received a voucher were also more likely to be wearing spectacles (361/988, 37%) compared with children given a prescription only (266/1036, 26%) at follow‐up. SIL 2014 reported a risk ratio adjusted for baseline wear and clustering of 1.42 (95% CI 1.16 to 1.73).
Outcome: quality of life
SIL 2014 found that children who received free spectacles had better educational attainment as measured by a standardised mathematics score (adjusted difference 0.11 (95% CI 0.01 to 0.21). The authors state that this difference is equivalent to approximately half a term (semester) of additional learning.We judged this to be low‐certainty evidence, downgrading one level for imprecision and one level for indirectness as this outcome may be specific to location and unclear if it is applicable to other settings. .
Outcome: cost
Wedner 2008 calculated the overall cost of screening and spectacle provision for each screened student was USD 0.87. The overall cost of screening and spectacle provision for each student who used spectacles (definition 1) was USD 46.3 (GBP 23.40) for free spectacles; USD 64.7 (GBP 32.70) for prescribed spectacles. Calculations were based on spectacle use of 47% if spectacles were provided free and 26% if spectacles were only prescribed. We judged this to be low‐certainty evidence, downgrading two levels for indirectness as costs are very specific to location (Tanzania) and time period (nearly 10 years ago).
Outcome: adverse effects
Refractive error
SIL 2014 investigated the impact of assignment to free spectacles compared with prescription only on uncorrected visual acuity at follow‐up. There was a mean difference of ‐0.02 logMAR (95% CI adjusted for clustering ‐0.04 to 0.01) between the groups at follow‐up i.e. no evidence of any important impact of free spectacles on uncorrected acuity. We judged this to be moderate‐certainty evidence downgrading one level for indirectness average logMAR acuity may not adequately reflect proportion of children with important changes in uncorrected visual acuity.
Other pre‐specified outcomes were not reported.
Anxiety (from interviews, self‐completion questionnaires, focus groups etc)
Over prescribing
Comparison: free spectacles combined with a teacher incentive versus no free spectacles or teacher incentive
Only one study reported the effect of supplying free spectacles alongside a teacher incentive compared with receiving a prescription only in Chinese schools (SIL II 2015). Teachers and children received an educational intervention. The teacher received a tablet computer (approximate value USD 350) if 80% or more of the children who received spectacles were wearing them.
Outcome: uncorrected visual acuity deficits due to refractive error (primary outcome) within six months of screening
Not reported
Outcome: uncorrected visual acuity deficits due to refractive error more than six months after screening
Not reported
Outcome: proportion of participants with visual acuity deficit due to causes other than refractive error at six months and more than six months
Not reported
Outcome: compliance with spectacles prescribed as a result of vision screening (i.e. spectacle wearing)
Spectacle wear was higher at six months in children who had received free spectacles 233/341 and whose teachers had received an incentive (68.3%) compared with children who did not receive free spectacles and whose teachers did not receive an incentive (84/352 (23.9%)). The following effect estimates were reported by SIL II 2015.
Odds ratio adjusted for cluster design: 6.88, 95% CI 4.09 to 11.6
Odds ratio adjusted for cluster design and other predictor variables: 11.5, 95% CI 5.91 to 22.5.
Note that the odds ratio will give exaggerated estimates of effect. For example, the odds ratio of 6.88 will correspond to a risk ratio of 2.86.
Outcome: adverse effects
The following outcomes were not reported.
Refractive error
Anxiety (from interviews, self‐completion questionnaires, focus groups etc)
Over prescribing
Outcome: quality of life
Not reported
Comparison: educational intervention versus no educational intervention
See Table 2.
Two cluster randomised trials, both conducted in China, explored the effect of an educational intervention. In Congdon 2011 children aged between 12 to 17 years in rural China, received a lecture, video and classroom demonstration promoting spectacle purchase or no education intervention. In SIL 2014 children aged between 10 and 12 watched a 10‐minute, documentary‐style video and were given a booklet of cartoons, followed by a classroom discussion led by study staff. "These materials showed children experiencing the benefits of glasses and teachers explaining that glasses do not harm vision". Teachers and parents also viewed a presentation on the safety and benefits of spectacles. The control group received no educational intervention.
Outcome: uncorrected visual acuity deficits due to refractive error (primary outcome) within six months of screening
Not reported
Outcome: uncorrected visual acuity deficits due to refractive error more than six months after screening
Not reported
Outcome: proportion of participants with visual acuity deficit due to causes other than refractive error at six months and more than six months
Not reported
Outcome: compliance with spectacles prescribed as a result of vision screening (i.e. spectacle wearing)
In SIL 2014 spectacle wearing was defined as "wearing glasses during an unannounced examination". A similar proportion of children in the educational intervention group were wearing spectacles (588/1648, 36%) compared with children in the group with no educational intervention (508/1529, 33%) at follow‐up (approximately eight months after screening). SIL 2014 reported a risk ratio adjusted for baseline wear and clustering of 1.11 (95% CI 0.95 to 1.31). We judged this to be moderate‐certainty evidence, downgrading one level for imprecision.
Congdon 2011 reported a related outcome measure, that is, whether or not the child obtained spectacles. A smaller proportion of the children in the educational group, reported buying spectacles (417, 25.7%) compared with the control group (537, 34.0%) at approximately six months' follow‐up. Congdon 2011 reported the following effect measures.
Odds ratio 0.84, 95% CI 0.55 to 1.31, adjusted for cluster design
Odds ratio 0.86, 95% CI 0.66 to 1.11, adjusted for cluster design and other predictors.
Outcome: quality of life
Not reported
Outcome: adverse effects
The following outcomes were not reported.
Refractive error
Anxiety (from interviews, self‐completion questionnaires, focus groups etc)
Over prescribing
Interventions to improve efficiency or cost‐effectiveness
Comparison: ready‐made spectacles versus custom‐made spectacles
See Table 3.
Ready‐made spectacles have the same spherical equivalent in both eyes and are available in a range of powers and interpupillary distances. Custom‐made spectacles are tailored to the individual prescription of the child.
Three individually randomised studies explored the use of ready‐made versus custom‐made spectacles, two studies in China (RECS 2009; WEAR 2017) and one in India (Morjaria 2016).
Outcome: uncorrected visual acuity deficits due to refractive error (primary outcome) within six months of screening
RECS 2009 reported slightly worse visual acuity in children wearing ready‐made spectacles compared with children wearing custom‐made spectacles. Mean logMAR acuity was 0.11 (standard deviation (SD) 0.09) for children wearing ready‐made spectacles and 0.08 (SD 0.07) in children wearing custom‐made spectacles (mean difference (MD) 0.03 logMAR score, 95% CI 0.01 to 0.05; 414 participants). However, this difference, of less than 5 letters, is unlikely to represent a meaningful difference between the groups. This analysis was for the eye with the lower amount of spherical refractive error, that is, the better eye. As ready‐made spectacles were dispensed on the basis of the less myopic eye the same analysis on the worse eye (eye with higher spherical refractive error) was 0.14 (SD 0.12) logMAR score in the ready‐made spectacle group compared with 0.08 (SD 0.08) in the custom‐made spectacle group (MD 0.06, 95% CI 0.04 to 0.08). We judged this to be moderate‐certainty evidence. Children with astigmatism of 0.75 dioptres or more had approximately 1 line of Snellen acuity worse with ready‐made spectacles than with custom‐made spectacles.
Outcome: uncorrected visual acuity deficits due to refractive error more than six months after screening
Not reported
Outcome: proportion of participants with visual acuity deficit due to causes other than refractive error at six months and more than six months
Not reported
Outcome: compliance with spectacles prescribed as a result of vision screening (i.e. spectacle wearing)
All three studies found similar proportions of children in the ready‐made versus custom‐made spectacles group were wearing spectacles at follow‐up, with an overall pooled risk ratio of 0.98 (95% CI 0.91 to 1.05; 1203 participants; I2 = 0%) Figure 4. This analysis was done using a fixed‐effect model. We compared this with a random‐effects model with similar results (RR 0.98, 95% CI 0.94 to 1.03).
4.
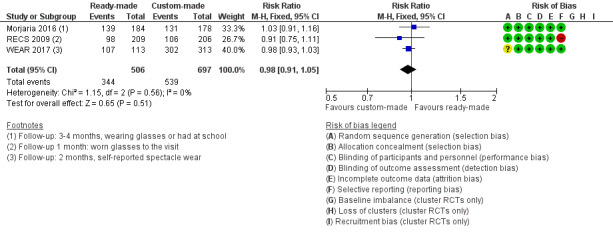
Forest plot of comparison: 2 Ready‐made versus custom‐made spectacles, outcome: 2.1 Spectacle wearing.
Outcome: quality of life
WEAR 2017 measured quality of life using the NEI‐RQL‐42 questionnaire. There was no evidence of any important difference in quality of life with the two types of spectacles. After wearing ready‐made spectacles for two months, the mean NEI‐RQL‐42 global score had changed from 59.6 (SD 10.6) at baseline to 64.3 (SD 11.8) in children with ready‐made spectacles. This is a change of 4.65 (95% CI 2.45 to 6.86). In the custom‐made spectacles group, mean NEI‐RQL changed to a similar degree (MD 1.43, 95% CI ‐1.04 to 3.90). We judged this to be moderate‐certainty evidence, downgrading one level for indirectness as follow‐up was two months (rather than six months specified) and reported in only one location (China).
Outcome: adverse effects
The following outcomes were not reported.
Refractive error
Anxiety (from interviews, self‐completion questionnaires, focus groups etc)
Over prescribing
The following symptoms were reported in RECS 2009 at one month's follow‐up:
| Symptom n (%) | Ready‐made spectacles n = 209 | Custom‐made spectacles n = 205 |
| Blurred vision | 44 (21) | 40 (19) |
| Distorted vision | 22 (11) | 19 (9) |
| Headache | 42 (20) | 47 (23) |
| Disorientation | 18 (9) | 11 (5) |
| Dizziness | 52 (25) | 40 (19) |
| Eyestrain | 110 (53) | 91 (44) |
| Nausea | 12 (6) | 19 (9) |
Comparison: rural refractionist versus university optometrist
One study addressed this comparison. WEAR 2017 was conducted in China. Children aged 12 to 15 years were randomised to subjective cycloplegic retinoscopy by a rural refractionist or by a university optometrist and followed for two months. They were given custom‐made spectacles.
Outcome: uncorrected visual acuity deficits due to refractive error (primary outcome) within six months of screening
Children receiving spectacles prescribed after assessment by a rural refractionist were less likely to have uncorrected visual acuity deficits: 25/108 (23%) had best‐corrected visual acuity worse than 6/6 compared with 78/103 (76%) of the children receiving spectacles prescribed by a university optometrist (RR 0.31, 95% CI 0.21 to 0.44; 211 participants). All children in both groups had best‐corrected visual acuity with study spectacles better than 6/12.
Outcome: uncorrected visual acuity deficits due to refractive error more than six months after screening
Not reported
Outcome: proportion of participants with visual acuity deficit due to causes other than refractive error at six months and more than six months
Not reported
Outcome: compliance with spectacles prescribed as a result of vision screening (i.e. spectacle wearing)
Both groups self‐reported high levels of wear: 105/108 (97%) of the rural refractionist groups compared with 99/103 (96%) of the optometrist group (RR 1.01, 95% CI 0.96 to 1.06; 211 participants).
Outcome: quality of life
There was little evidence of any important differences in quality of life as measured at two months using the NEI‐RQL‐42 (WEAR 2017). (MD 1.81, 95% CI ‐1.01 to 4.63; 198 participants).
Outcome: adverse effects
The following outcomes were not reported.
Refractive error
Anxiety (from interviews, self‐completion questionnaires, focus groups etc)
Over prescribing
Comparison: self‐refraction versus university optometrist
One study addressed this comparison. WEAR 2017 was conducted in China. Children aged 12 to 15 years were randomised to non‐cycloplegic self‐refraction compared with subjective cycloplegic refraction by a university optometrist and followed for two months. They were given custom‐made spectacles. Self‐refraction was done using fluid‐filled adjustable spectacles.
Outcome: uncorrected visual acuity deficits due to refractive error (primary outcome) within six months of screening
Children receiving spectacles prescribed after self‐refraction were less likely to have uncorrected visual acuity deficits: 55/102 (54%) had best‐corrected visual acuity worse than 6/6 compared with 78/103 (76%) of the children receiving spectacles prescribed by a university optometrist (RR 0.71, 95% CI 0.58 to 0.88). All children in both groups had visual acuity better than 6/9.
Outcome: uncorrected visual acuity deficits due to refractive error more than six months after screening
Not reported
Outcome: proportion of participants with visual acuity deficit due to causes other than refractive error at six months and more than six months
Not reported
Outcome: compliance with spectacles prescribed as a result of vision screening (i.e. spectacle wearing)
Both groups self‐reported high levels of wear: 98/102 (96%) of the self‐refraction group compared with 99/103 (96%) of the university optometrist group (RR 1.00, 95% CI 0.95 to 1.06).
Outcome: quality of life
There was little evidence of any important differences in quality of life as measured by change between baseline and two months in the NEI‐RQL‐42: MD 0.82, 95% CI ‐2.00 to 3.64; 188 participants).
Outcome: adverse effects
The following outcomes were not reported.
Refractive error
Anxiety (from interviews, self‐completion questionnaires, focus groups etc)
Over prescribing
Discussion
Summary of main results
The primary aim of vision screening of school‐age children and adolescents is to identify and address visual acuity deficits due to the development of refractive error, especially myopia. While other causes of reduced vision may also be detected these occur relatively infrequently (Wallace 2017). Vision screening for refractive error in school‐age children is not expected to impact on the prevalence of refractive error itself but aims to reduce the prevalence of uncorrected refractive error. To achieve this, vision screening programmes must not only reliably detect the target condition but also ensure that treatment, in whatever form, is available, affordable and can be realistically implemented. The remit of this review was to identify RCTs (including cluster‐randomised controlled trials) that evaluated the effectiveness of screening as an intervention.
We identified seven relevant studies. Five of these studies were conducted in China with one study in India and one in Tanzania. Children enrolled in these studies were aged between 10 and 18 years. None of these studies compared vision screening for correctable visual acuity deficits versus not screening.
Two studies compared vision screening with provision of free spectacles versus vision screening with no provision of free spectacles (Table 1). These studies provide high‐certainty evidence that vision screening with provision of free spectacles results in a higher proportion of children wearing spectacles than if vision screening is accompanied by provision of a prescription only. The studies suggest that if approximately 250 per 1000 children who are given vision screening plus prescription only are wearing spectacles at follow‐up (three to six months) then 400 per 1000 (335 to 470) would be expected to be wearing spectacles after vision screening and provision of free spectacles. Costs were reported in one study in Tanzania in 2008 and indicated a relatively low cost of screening and spectacle provision but the extent to which these can be extrapolated to other locations is unclear. One study investigated the effect of combining a teacher incentive with free spectacles and found that this may also improve spectacle wearing. Other pre‐specified outcomes of this review were not reported.
Two studies explored the effect of an educational intervention in addition to vision screening on spectacle wear (Table 2). There was little apparent effect of the education interventions investigated in these studies in addition to vision screening, compared to vision screening alone in terms of spectacle wearing. Other outcomes were not reported.
Three studies compared vision screening with ready‐made spectacles versus vision screening with custom‐made spectacles (Table 3). These studies provide moderate‐certainty evidence that the two types of spectacles provide similar visual results and quality of life, and high‐certainty evidence of no important difference in spectacle wearing. There was low‐certainty evidence that the adverse effects or symptoms were similar in the two groups. Although none of the studies reported on costs directly, ready‐made spectacles are cheaper and may represent considerable cost savings for vision screening programmes in lower‐income settings.
Overall completeness and applicability of evidence
VIsion screening programmes directed to school‐age children and adolescents take place in many different contexts throughout the world. They may be affected by the background prevalence of refractive error as well as the organisation and delivery of eye healthcare services in the locality, including access to affordable spectacles. The purpose and impact of vision screening may be different at different ages, for example, screening at school entry (age four to five years) differs from screening at older ages. Evidence provided in this review may not, therefore, be universally applicable and must be interpreted in context.
There are a wide variety of approaches to school‐age vision screening throughout the world. Some commentators have observed that the existence of these variations, both between and within countries, is a reflection of the low‐certainty evidence base (Rahi 2002). It is not the aim of the current review to provide a summary of current vision screening programmes but for relevant reviews see Sharma 2012 and Hopkins 2013. The studies in the current review were from Asia, the Indian subcontinent and Africa. As such, the results of these studies may be more applicable to low‐ and middle‐income settings. The children included in these trials were aged 10 to 18 years. The results of these studies will not apply to vision screening at school entry (four to five years in many countries).
This review does not provide a direct answer to the question as to what are the benefits and harms of vision screening programmes in school‐age children and adolescents. We did not identify any randomised controlled trials addressing that question. However, the included studies that compare provision of free spectacles (SIL 2014; Wedner 2008) demonstrated reasonably large differences in spectacle wearing and these were not associated with any important adverse effects. in particular SIL 2014 provides evidence that spectacle wearing did not lead to an increased progression of myopia and this is supported by other evidence (Walline 2011).
The evidence on the provision of free spectacles is reasonably robust and will be applicable to settings where such provision is not currently available. The review also provides reasonably conclusive evidence that cheaper, ready‐made spectacles may be an acceptable alternative to expensive, custom‐made spectacles in children without astigmatism or anisometropia. The finding that educational interventions, as tested so far, do not appear to be effective in improving spectacle wear may also be applicable to other higher‐income settings. It is notable that the prevalence of spectacle wearing in the comparator group in the included studies varied from 25% to 75% and possibly higher. The reasons for variation in spectacle wear are not clearly understood but may include over‐prescribing, concerns over appearance, teasing, discomfort and beliefs around spectacle wearing (Sharma 2012).
There may be unanticipated economic effects of provision of free spectacles. A recently published trial has tested out a model for sustainable provision of free spectacles (Wang 2017). Offering an upgrade option (stylish designs and scratch‐free coatings) to free spectacles resulted in greater percentage of children purchasing spectacles and increased programme income.
Certainty of the evidence
The certainty of the evidence ranged from high to low, depending on the outcome.
We judged the studies largely to be at low risk of bias and judged the estimates of effect from each individual study as reasonably secure, downgrading only for imprecision as needed for each individual effect estimate. We were concerned with the applicability of the evidence with respect to location and downgraded for indirectness, depending on the comparison and the outcome. The extent to which the findings may be extrapolated to other settings was sometimes unclear.
Potential biases in the review process
Two of the review authors (JE/PM) were involved in one of the trials (Morjaria 2016). We tried to minimise any bias in assessment of this trial by making sure that data extraction for this study was performed by a review author not involved in the trial (CP) and another independent assessor (AS ‐ see Acknowledgements).
Agreements and disagreements with other studies or reviews
The results of this review concur with other relevant reviews (Logan 2004; Mathers 2010; Rahi 2001; Rahi 2002; Wallace 2017). There is consensus that there is insufficient evidence to support the planning and development of vision screening programmes after school entry. The US Preventive Services Task Force identified no randomised controlled trials comparing screening with no screening in children aged six months to five years (Jonas 2017). The authors concluded that they could not establish whether vision screening in preschool children was better than no screening and the evidence of benefit was indirect.
We identified one review of ready‐made spectacles (Pearce 2014). Although this review also considered studies in adult populations it came to the same conclusions as the current review, that is, that ready‐made spectacles are a potential alternative to custom‐made spectacles.
Authors' conclusions
Implications for practice.
We did not find any randomised controlled trials that compared vision screening versus no vision screening however the results of the trials of vision screening with provision of free glasses compared with prescription alone may provide an indication of the likely benefit of vision screening programmes.
Vision screening plus provision of free spectacles improves the number of children who have and wear the spectacles they need compared with providing a prescription only. This may lead to better educational outcomes. Health education interventions, as currently devised and tested, do not appear to improve spectacle wearing in children. In lower‐income settings, ready‐made spectacles may provide a useful alternative to expensive custom‐made spectacles.
The majority of studies included in this review were conducted in China with one from Tanzania and one from India. The extent to which these findings can be extrapolated to other settings is unclear.
Implications for research.
Emerging evidence, from China in particular, suggests that vision screening of school‐age children and adolescents for correctable visual acuity deficits may improve spectacle wearing and educational outcomes, if provision of spectacles is free. This finding may be applicable to other parts of the world but currently it is unclear if it is. Such studies could usefully be done in other countries and should be accompanied by formal cost‐effectiveness analyses. Where there is the intention to introduce a new screening programme, the opportunity to carry out a randomised controlled trial should not be missed, so that the potential benefits or harms of this intervention can be measured. Outcomes should include both the prevalence of uncorrected visual acuity deficit as well as quality of life and educational outcomes. Further evidence on the progression of myopia is also needed.
There was considerable variation in spectacle wearing in the studies included in this review. Barriers to spectacle wear need to be further explored in different settings before the development of new interventions are tested more formally in randomised controlled trials.
In countries with low school attendance, information is needed on whether screening programmes in schools are sufficient or whether additional efforts have to be made to identify children with correctable visual acuity deficit in the community.
What's new
| Date | Event | Description |
|---|---|---|
| 20 December 2017 | New citation required and conclusions have changed | Issue 2, 2018: Seven studies have been identified that met the inclusion criteria (Congdon 2011; Morjaria 2016; RECS 2009; SIL 2014; SIL II 2015; WEAR 2017; Wedner 2008). |
| 20 December 2017 | New search has been performed | Issue 2, 2018: Searches updated. |
History
Protocol first published: Issue 4, 2004 Review first published: Issue 1, 2005
| Date | Event | Description |
|---|---|---|
| 30 July 2008 | Amended | Converted to new review format. |
| 9 May 2006 | New search has been performed | In the first update of this review an additional 528 reports of studies were identified; none were eligible for inclusion. Additional detail regarding possible harm from early or inappropriate treatment with glasses has been added into the introductory text and the discussion. |
Acknowledgements
Cochrane Eyes and Vision prepared and executed the electronic searches. Thank you also to Catey Bunce, Roberta Scherer, Ivan Wood, Allen Foster, Nathan Congdon and Sue Elliott for peer reviewing and to Maria Cristina Bohorquez for her translation work. In addition, many thanks to Anupa Shah and Richard Wormald at Cochrane Eyes and Vision for their advice and support throughout the review process. Anupa also extracted data for Morjaria 2016.
We thank Sarah Hatt and Susanne Wedner for their contributions to earlier versions of this review.
Appendices
Appendix 1. CENTRAL search strategy
#1 MeSH descriptor: [Vision Screening] explode all trees #2 MeSH descriptor: [Mass Screening] explode all trees #3 MeSH descriptor: [School Health Services] explode all trees #4 MeSH descriptor: [Child Health Services] explode all trees #5 MeSH descriptor: [Vision Disorders] explode all trees #6 MeSH descriptor: [Vision Tests] explode all trees #7 vision near/15 (test* or screen* or diagnos* or assess*) #8 visual near/15 (test* or screen* or diagnos* or assess*) #9 #1 or #2 or #3 or #4 or #5 or #6 or #7 or #8 #10 MeSH descriptor: [Refractive Errors] explode all trees #11 MeSH descriptor: [Astigmatism] explode all trees #12 astigmat* #13 MeSH descriptor: [Myopia] explode all trees #14 myop* #15 MeSH descriptor: [Hyperopia] explode all trees #16 hyperop* or hypermetrop* #17 MeSH descriptor: [Anisometropia] explode all trees #18 anisometrop* or ammetrop* #19 #10 or #11 or #12 or #13 or #14 or #15 or #16 or #17 or #18 #20 MeSH descriptor: [Pediatrics] explode all trees #21 pediatric* or paediatric* #22 MeSH descriptor: [Child, Preschool] explode all trees #23 child:kw #24 MeSH descriptor: [Adolescent] explode all trees #25 child* or adolesc* or juvenile* or minor* or kindergarten* or pre school* or preschool* or nurser* #26 MeSH descriptor: [Schools] explode all trees #27 MeSH descriptor: [Child Day Care Centers] explode all trees #28 #20 or #21 or #22 or #23 or #24 or #25 or #26 or #27 #29 #9 and #19 and #28
Appendix 2. MEDLINE Ovid search strategy
1. randomized controlled trial.pt. 2. (randomized or randomised).ab,ti. 3. placebo.ab,ti. 4. dt.fs. 5. randomly.ab,ti. 6. trial.ab,ti. 7. groups.ab,ti. 8. or/1‐7 9. exp animals/ 10. exp humans/ 11. 9 not (9 and 10) 12. 8 not 11 13. exp vision screening/ 14. exp mass screening/ 15. exp school health services/ 16. exp child health services/ 17. exp vision disorders/ 18. exp vision tests/ 19. (vision adj15 (test$ or screen$ or diagnos$ or assess$)).tw. 20. (visual adj15 (test$ or screen$ or diagnos$ or assess$)).tw. 21. or/13‐20 22. exp refractive errors/ 23. exp astigmatism/ 24. astigmat$.tw. 25. exp myopia/ 26. myop$.tw. 27. exp hyperopia/ 28. (hyperop$ or hypermetrop$).tw. 29. exp anisometropia/ 30. (anisometrop$ or ammetrop$).tw. 31. or/22‐30 32. exp pediatrics/ 33. (pediatric$ or paediatric$).tw. 34. exp child, preschool/ 35. exp child/ 36. exp adolescent/ 37. (child$ or adolesc$ or juvenile$ or minor$ or kindergarten$ or pre school$ or preschool$ or nurser$).tw. 38. exp school/ 39. exp child day care centers/ 40. or/32‐39 41. 21 and 31 and 40 42. 12 and 41
The search filter for trials at the beginning of the MEDLINE strategy is from the published paper by Glanville 2006.
Appendix 3. Embase Ovid search strategy
1. exp randomized controlled trial/ 2. exp randomization/ 3. exp double blind procedure/ 4. exp single blind procedure/ 5. random$.tw. 6. or/1‐5 7. (animal or animal experiment).sh. 8. human.sh. 9. 7 and 8 10. 7 not 9 11. 6 not 10 12. exp clinical trial/ 13. (clin$ adj3 trial$).tw. 14. ((singl$ or doubl$ or trebl$ or tripl$) adj3 (blind$ or mask$)).tw. 15. exp placebo/ 16. placebo$.tw. 17. random$.tw. 18. exp experimental design/ 19. exp crossover procedure/ 20. exp control group/ 21. exp latin square design/ 22. or/12‐21 23. 22 not 10 24. 23 not 11 25. exp comparative study/ 26. exp evaluation/ 27. exp prospective study/ 28. (control$ or prospectiv$ or volunteer$).tw. 29. or/25‐28 30. 29 not 10 31. 30 not (11 or 23) 32. 11 or 24 or 31 33. exp vision test/ 34. exp mass screening/ 35. exp school health services/ 36. exp child health care/ 37. exp vision disorder/ 38. (vision adj15 (test$ or screen$ or diagnos$ or assess$)).tw. 39. (visual adj15 (test$ or screen$ or diagnos$ or assess$)).tw. 40. or/33‐39 41. exp refractive error/ 42. exp astigmatism/ 43. astigmat$.tw. 44. exp myopia/ 45. myop$.tw. 46. exp hypermetropia/ 47. (hyperop$ or hypermetrop$).tw. 48. exp anisometropia/ 49. (anisometrop$ or ammetrop$).tw. 50. or/41‐49 51. exp pediatrics/ 52. (pediatric$ or paediatric$).tw. 53. exp preschool child/ 54. exp child/ 55. exp adolescent/ 56. (child$ or adolesc$ or juvenile$ or minor$ or kindergarten$ or pre school$ or preschool$ or nurser$).tw. 57. exp school/ 58. exp day care/ 59. or/51‐58 60. 40 and 50 and 59 61. 32 and 60
Appendix 4. ISRCTN search strategy
(vision screening) AND (visual acuity)
Appendix 5. ClinicalTrials.gov search strategy
vision screening AND visual acuity
Appendix 6. WHO ICTRP search strategy
screening AND visual acuity
Data and analyses
Comparison 1. Free glasses compared with prescription only.
| Outcome or subgroup title | No. of studies | No. of participants | Statistical method | Effect size |
|---|---|---|---|---|
| 1 Spectacle wearing | 2 | 1092 | Risk Ratio (M‐H, Fixed, 95% CI) | 1.60 [1.34, 1.90] |
1.1. Analysis.
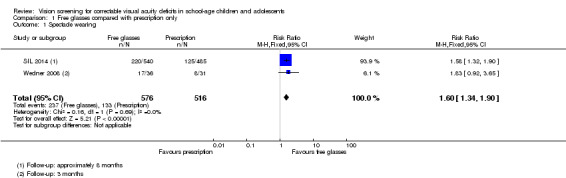
Comparison 1 Free glasses compared with prescription only, Outcome 1 Spectacle wearing.
Comparison 2. Ready‐made versus custom‐made spectacles.
| Outcome or subgroup title | No. of studies | No. of participants | Statistical method | Effect size |
|---|---|---|---|---|
| 1 Spectacle wearing | 3 | 1203 | Risk Ratio (M‐H, Fixed, 95% CI) | 0.98 [0.91, 1.05] |
2.1. Analysis.
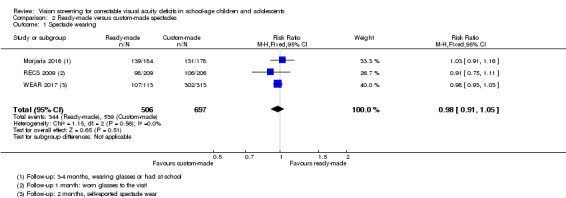
Comparison 2 Ready‐made versus custom‐made spectacles, Outcome 1 Spectacle wearing.
Characteristics of studies
Characteristics of included studies [ordered by study ID]
Congdon 2011.
| Methods |
Study design: cluster‐RCT Study grouping: parallel group Unit of analysis: mixed‐effects logistic regression was used to take into account the cluster design |
|
| Participants |
Country: China Setting: school Baseline characteristics: Educational intervention
No educational intervention
Overall
Inclusion criteria: Quote "At each junior and senior high school in the 3 townships of Fuyang, Xichang, and Liangying, Chaoshan region, Guangdong Province, all year 1 and year 2 classes (approximate age, 12–17 years) were enumerated, and 10 classes were selected at random." Quote "Children meeting the following criteria were given a prescription for spectacles by the examining ophthalmologist, together with a note addressed to their parents recommending that glasses be purchased: all participants with presenting VA of 6/12 or worse in either eye (e.g., with or without spectacles) and whose vision could be improved by 2 lines or more in either eye with refraction, and children already having spectacles improving the vision to better than 6/12, but whose vision could be improved by 2 lines or more in either eye with refraction." Exclusion criteria: NR Pretreatment: groups well balanced with respect to age, visual acuity, refractive error and spectacle ownership. Slightly more girls in the intervention group (60%) than the comparator group (54%) |
|
| Interventions |
Intervention: Educational intervention
Comparator: No educational intervention
Intervention received by both groups: Quote "Parents were recommended to obtain glasses at vision centers located within local, government‐run hospitals in each of the 3 townships where the study took place. Each of these vision centers had been provided by Project Vision, a Hong Kong‐based non governmental organization, with the following: equipment for refraction and dispensing of spectacles, high‐quality children’s frames, and 3 or 6 months of refraction training by optometrists at a tertiary center in nearby Shantou City. The trained personnel, who had various backgrounds, took part in the study screening examinations in their own townships. Spectacles were available at the vision centers at a cost of USD 10 and up. Vision centers were located within 10 miles of the homes of all children in the study. Other refractive services in this area were offered by unlicensed private shops, staffed by persons without formal refraction training, providing spectacles on the basis of noncycloplegic automated refraction or subjective refraction with loose lenses." |
|
| Outcomes |
Primary outcome:
Secondary outcomes:
Presenting and uncorrected vision and refraction also measured along with the power of spectacles and spectacle‐corrected vision were measured when spectacles were available. Follow‐up: approximately 6 months |
|
| Notes |
Study name: The See Well to Learn Well Study Date study conducted: not reported but trial registry entry suggests start date was November 2007 Trial registration number: CUHK_CCT00149 and ChiCTR‐TRC‐09000710 Funding: quote "The See Well to Learn Well Project was supported by a grant to Oxford University from the Li Ka Shing Foundation, Hong Kong SAR." Declaration of interest: quote "Financial Disclosure(s): The author(s) have no proprietary or commercial interest in any materials discussed in this article." Investigators contacted: no |
|
| Risk of bias | ||
| Bias | Authors' judgement | Support for judgement |
| Random sequence generation (selection bias) | Low risk | Quote: "A random number table and list of junior and senior high schools in the 3 selected communities was used to assign 10 schools to receive an educational intervention and 10 schools to serve as controls." |
| Allocation concealment (selection bias) | Low risk | Judgement comment: cluster‐RCT with allocation of schools at the beginning of the study |
| Blinding of participants and personnel (performance bias) All outcomes | Low risk | Judgement comment: not reported but probably this was not an issue as allocation by schools and unlikely that the other intervention arm was explained in the control schools. |
| Blinding of outcome assessment (detection bias) All outcomes | Unclear risk | Quote: "Staff were not masked as to the randomization status of schools at the time of follow‐up." Judgement comment: it is arguable what effect this would have, especially as the overall results were negative, but ideally masking would have been used to avoid bias. |
| Incomplete outcome data (attrition bias) All outcomes | Unclear risk | Judgement comment: 1622/2236 (72.5%) of children were followed up in the intervention group and 1578/2212 (71.3%) of children were followed up in the control group. Judgement comment: 1 in 3 or 4 children not seen but unclear if this would impact the results as follow‐up was reasonably similar between the 2 groups. |
| Selective reporting (reporting bias) | High risk | Judgement comment: the outcomes on registry entry were different to the final published study "A. Vision‐related: ‐ at 6 months and 1 year post visit to schools • Prevalence of refractive error and need for spectacles • Proportion of children requiring refractive correction who have obtained it at baseline • Determinants of spectacles wear at baseline • Behaviorial and familial risk factors for myopia • Visual function and healthy behaviour knowledge pre and post‐intervention, compared to control schools • Uptake of spectacles among children with refractive error, comparing the control and ocular interventions • Other determinants of spectacle uptake • Impact of spectacle uptake on visual function and school performance outcomes • Barriers to parents in providing spectacles" B. Outcomes related to other proposed health interventions ‐ at 6 months and 1 year post visit to schools • Changes in attitude/behaviour post‐intervention, compared to control schools • Smoking rates and changes in attitude/behaviour post‐intervention, compared to control schools • Social marketing approaches will be tested out and assessed for their impact Main outcome measures in trial report: "Self‐reported purchase of spectacles (primary outcome) and observed wear or possession of newly purchased glasses (secondary outcome) at follow‐up examinations (mean, 219 +/‐ 87 days after the baseline visit)." |
| Baseline imbalance (cluster RCTs only) | Unclear risk | Judgement comment: not reported. Baseline characteristics reported at individual level. Groups well balanced with respect to age, visual acuity, refractive error and spectacle ownership. Slightly more girls in the intervention group (60%) than the comparator group (54%). |
| Loss of clusters (cluster RCTs only) | Unclear risk | Judgement comment: not reported. |
| Recruitment bias (cluster RCTs only) | Low risk | Judgement comment: not reported but we judge that this is unlikely to be an issue in the school setting. |
Morjaria 2016.
| Methods |
Study design: RCT Study grouping: parallel group Unit of analysis: people were randomly allocated to treatment and the study was analysed at the people level |
|
| Participants |
Country: India Setting: school Baseline characteristics: Ready‐made spectacles
Custom‐made spectacles
Overall
Inclusion criteria: quote: "Screening was offered to all children aged 11 to 15 years present at school at the time of screening" Quote: "To be eligible for recruitment, the following criteria had to be met: (1) VA with full correction improved in the better seeing eye by 2 or more lines, (2) the SE corrected the VA to not more than 1 line less than best‐corrected VA with a full prescription in the better eye, (3) the difference between SE of the right and left eyes was not more than 1.0 diopter (D), (4) inter pupillary distance matched that of ready‐made spectacle frames available (ie, 54‐62 mm), and (5) spectacle frames were of acceptable size and fit." Exclusion criteria: quote: "Exclusion criteria consisted of other causes of visual impairment and lack of parental consent." Pretreatment: quote “the range of spherical equivalent in the better eye was wider in the custom‐made than ready‐made arms.” |
|
| Interventions |
Intervention: Ready‐made spectacles
Comparator: Custom‐made spectacles
|
|
| Outcomes |
Primary outcome:
Categories 1 or 2 were used to define spectacle wearing, and categories 3 or 4 as non‐spectacle wearing:
Secondary outcomes:
Follow‐up: 3‐4 months |
|
| Notes |
Study name: none given Date study conducted: January 2015‐July 2015 Trial registration number: ISRCTN14715120 Funding: quote "This study was supported by L’Occitane Foundation and the Vision Impact Institute." Declaration of interest: quote "Conflict of Interest Disclosures: All authors have completed and submitted the ICMJE Form for Disclosure of Potential Conflicts of Interest and none were reported" Investigators contacted: not appicable (investigator is author of current review) |
|
| Risk of bias | ||
| Bias | Authors' judgement | Support for judgement |
| Random sequence generation (selection bias) | Low risk | Quote: "After recruitment, children were randomly assigned to ready‐ made or custom‐made spectacles in a ratio of 1:1. Block randomization with variable block sizes, stratified by school, was computer generated by one of us who was an epidemiologist (J.E.) away from the study site." |
| Allocation concealment (selection bias) | Low risk | Quote: "Sequentially numbered, sealed, stamped opaque envelopes containing labels with unique study identification numbers and random allocation were prepared by persons not involved in the trial. At the study site, the optometrist opened the envelopes." |
| Blinding of participants and personnel (performance bias) All outcomes | Low risk | Quote: "Children, teachers, and parents were masked to the allocation arm. To maintain masking, a field worker and optometrist not previously involved in the trial were trained to assess the primary outcome." |
| Blinding of outcome assessment (detection bias) All outcomes | Low risk | Quote: "Children, teachers, and parents were masked to the allocation arm. To maintain masking, a field worker and optometrist not previously involved in the trial were trained to assess the primary outcome." |
| Incomplete outcome data (attrition bias) All outcomes | Low risk | Judgement comment: follow‐up nearly 80% in each group and balanced between groups. “All children not followed up in school (n = 98) had changed schools and moved to a different area." |
| Selective reporting (reporting bias) | Low risk | Judgement comment: all outcomes in protocol published |
RECS 2009.
| Methods |
Study design: RCT Study grouping: parallel group Unit of analysis: people randomised to intervention and analysis by person |
|
| Participants |
Country: China Setting: school (urban) Baseline characteristics: Ready‐made spectacles
CMS
Overall
Inclusion criteria: presenting vision 20/40 or worse in better eye. Minimum uncorrected spherical refractive error of ≥ 1 dioptre. Students already wearing spectacles were eligible if their current spectacles required a change of ≥ 1 dioptre. Exclusion criteria: best corrected distance acuity 20/25. Cylinder power > ‐2 dioptre. Anisometropia (for myopia, sphere difference ≥ 2D, for hyperopia, sphere difference = 1 dioptre. Other eye disease affecting vision Pretreatment: slightly higher proportion boys in CMS group |
|
| Interventions |
Intervention: Ready‐made spectacles
Comparator: CMS
|
|
| Outcomes |
Primary outcome:
Secondary outcomes
Follow‐up: 1 month |
|
| Notes |
Study name: Evaluation of effectiveness of correcting refractive error with ready‐made spectacles (RECS) (from trial registry entry) Date study conducted: April 2008‐November 2008 (from trials registry entry) May‐July 2008 (in paper) Trial registration number: NCT00657670 Funding: quote "Support for this project was provided by the Michael and Susan Dell Foundation, by Helen Keller International (YZ, MH, & DF), Australian National Health and Medical Research Council Sidney Sax post doctoral fellowship (LK) and a Knights Templar Eye Foundation Pediatric Ophthalmology Grant (LK & BM). Mingguang He is supported by a grant from the World Bank to test a proprietary spectacle technology." Declaration of interest: quote "Financial Disclosure(s): Proprietary or commercial disclosure may be found after the references." But none were included. Investigators contacted: no |
|
| Risk of bias | ||
| Bias | Authors' judgement | Support for judgement |
| Random sequence generation (selection bias) | Low risk | Quote: "Randomization occurred at the study center after completion of the first visit. A randomization grid with 500 possible enrollments generated using a random number generator (available at: http://www.randomization.com; accessed March 21, 2008). Participants were assigned a position on the grid according to enrollment order." |
| Allocation concealment (selection bias) | Low risk | Quote: "Both the participant and those involved in data collection were masked to the type of spectacles ordered.Masking was maintained during follow‐up" Judgement comment: although not clearly stated likely that the enrolment was masked too. |
| Blinding of participants and personnel (performance bias) All outcomes | Low risk | Quote "Masking was maintained during follow‐up assessment because the spectacles were made at the optical facility, which was remote to the testing site and the RMS and CS were not different in appearance." |
| Blinding of outcome assessment (detection bias) All outcomes | Low risk | Quote "Masking was maintained during follow‐up assessment because the spectacles were made at the optical facility, which was remote to the testing site and the RMS and CS were not different in appearance." Quote "Furthermore, those involved in data collection were not equipped to measure refractive power of the spectacles during assessment and thereby remained masked to the treatment allocation during all evaluations" |
| Incomplete outcome data (attrition bias) All outcomes | Low risk | Judgement comment: follow‐up reasonably high and similar between groups. RMS: 208/250 (83%) CMS: 206/245 (84%) |
| Selective reporting (reporting bias) | High risk | Judgement comment: not all outcomes on trial register reported and some of the missing outcomes would have been of relevance to this review e.g. continued spectacle use at 6‐12 months after dispensing. Outcomes on trial registry entry Quote "Primary outcome measures: Wearer retention (% wearing at 1 month), vision (logMAR), visual function (0‐100), quality of life (0‐100) [Time Frame: a 1‐month period of spectacle wear] Secondary outcome Measures: Cost‐effectiveness [Time Frame: 1‐month of spectacle wear] Willingness to pay [Time Frame: 1‐month of spectacle wear ] Recommendations for those who will benefit from ready made spectacles [Time Frame: 1‐month of spectacle wear] Quantify the prismatic effects which has an impact of spectacle compliance, need for adaptation and satisfaction with spectacles [Time Frame: 1‐month of spectacle wear] Continued spectacle use 6‐12 months after dispensing [Time Frame: 12 months]" |
SIL 2014.
| Methods |
Study design: cluster‐RCT Study grouping: parallel group Unit of analysis: analyses were adjusted for clustering by school |
|
| Participants |
Country: China Setting: school Baseline characteristics: Free spectacles
Voucher
Control (no free spectacles/no voucher)
Education
No education
Overall
Inclusion criteria: children with uncorrected visual acuity ≤ 6/12 in either eye Exclusion criteria: schools with < 50 students, schools with > 150 students Pretreatment: some differences in blackboard use ‐ free spectacles group higher proportion (40%) were in classes with little or no blackboard use. Some differences in family wealth. Greater proportion of free spectacles group in top third (37%) for family wealth. |
|
| Interventions |
Factorial trial with 3 x 2 interventions/comparators giving 6 groups Intervention 1: Free spectacles
Intervention 2: Voucher
Comparator 1: No free spectacles/no voucher
Intervention 3: Education
Comparator 2: No education
|
|
| Outcomes |
Primary outcome:
Secondary outcomes:
Follow‐up: approximately 8 months |
|
| Notes |
Study name: Seeing is learning: providing vision care to rural primary school children in China (name on clinical trials registry entry only) Date study conducted: September 2012‐June 2013 Trial registration number: ISRCTN03252665 (retrospectively registered) Funding: quote "This study was funded by OneSight (Mason, OH), Luxottica‐China (Shanghai), Essilor‐China (Shanghai), CLSA (Asia Pacific Markets; Hong Kong), Charity Aid Foundation (Sydney), and an anonymous donor (Hong Kong). NC is supported by a Thousand Man Plan grant from the Chinese government. The study sponsors had no role in study design; the collection, analysis, and interpretation of data; the writing of the report; or the decision to submit the paper for publication." Declaration of interest: quote "All authors have completed the ICMJE uniform disclosure form at www.icmje.org/coi_disclosure.pdf and declare: the free glasses used in this study were supplied by OneSight, Luxottica‐China, and Essilor‐China, producers of frames and lenses in China who also provided financial support for the study; the authors have no other financial relationships with any organisations that might have an interest in the submitted work in the previous three years; and no other relationships or activities that could appear to have influenced the submitted work" Investigators contacted: no |
|
| Risk of bias | ||
| Bias | Authors' judgement | Support for judgement |
| Random sequence generation (selection bias) | Low risk | Quote: "Stratification and random assignment were carried out at a central location (Stanford University, Stanford, CA) using R software (R Foundation for Statistical Computing, Vienna, Austria)." |
| Allocation concealment (selection bias) | Low risk | Quote: "Stratification and random assignment were carried out at a central location (Stanford University, Stanford, CA) using R software (R Foundation for Statistical Computing, Vienna, Austria). Participants (students, parents, and teachers) and enumerators were not informed of either the overall design of the study or the explicit treatment arm assignment" |
| Blinding of participants and personnel (performance bias) All outcomes | Low risk | Quote "Participants (students, parents, and teachers) and enumerators were not informed of either the overall design of the study or the explicit treatment arm assignment. Participants were told only that this was a study of vision care among rural, school aged children. Only one school was selected in each township, minimizing the possibility of cross arm communication and contamination." |
| Blinding of outcome assessment (detection bias) All outcomes | Low risk | Quote "Participants (students, parents, and teachers) and enumerators were not informed of either the overall design of the study or the explicit treatment arm assignment. Participants were told only that this was a study of vision care among rural, school aged children. Only one school was selected in each township, minimizing the possibility of cross arm communication and contamination." |
| Incomplete outcome data (attrition bias) All outcomes | Low risk | Judgement comment: follow‐up high and reasonably balanced between groups (range 95.1% to 97.5% in six treatment arms). Multiple imputation used for missing values. |
| Selective reporting (reporting bias) | Unclear risk | Judgement comment: not all outcomes on trials registry entry were reported. The non‐reported outcomes include: knowledge of vision care and mental health, such as anxiety, mental health, self‐esteem, and enjoyment of school. |
| Baseline imbalance (cluster RCTs only) | Low risk | Clusters were balanced for numbers of children in fourth and fifth grades and uncorrected visual acuity < 6/18. Individual level factors also appeared to be reasonably balanced. Allocation was stratified: quote "Within each group, schools were randomised in October 2012 to receive an educational intervention promoting spectacle wear (education group) or no education. There were six groups of 42 schools in this 3×2 factorial design. Schools were stratified by three variables, information on which was collected during the baseline survey and screening: county; the total number of students in grades 4 and 5; and the number of students failing vision screening in grades 4 and 5. Within each stratum a school was randomly assigned to one of the six treatment arms." |
| Loss of clusters (cluster RCTs only) | Low risk | One (out of 84) clusters excluded because there were no children that met the inclusion criteria. This is unlikely to affect the results. |
| Recruitment bias (cluster RCTs only) | Low risk | Quote "Participants (students, parents, and teachers) and enumerators were not informed of either the overall design of the study or the explicit treatment arm assignment. Participants were told only that this was a study of vision care among rural, school aged children. Only one school was selected in each township, minimizing the possibility of cross arm communication and contamination." |
SIL II 2015.
| Methods |
Study design: cluster‐RCT Study grouping: parallel group Unit of analysis: schools were randomly allocated to intervention and analysis by person, adjusted for cluster design |
|
| Participants |
Country: China Setting: school (rural) Baseline Characteristics: Free spectacles and teacher incentive
Prescription only
Overall
Inclusion criteria: quote "All elementary schools in these cities identified by the local Bureaus of Education as having a primarily migrant population were enumerated and 94 schools were selected at random (66 in Shanghai and 28 in Suzhou/Wuxi). One fifth grade class (children aged 10–12 years) was selected at random in each school, and questionnaires (see below) were administered and visual acuity testing and refraction (see below) carried out. All children in the selected classes meeting both the following visual and refractive criteria were eligible: uncorrected visual acuity <6/12 in either eye; refractive error meeting cutoffs shown to be associated with significantly greater improvement in visual acuity when corrected: myopia <=‐0.75 diopters (D), hyperopia >=+2.00 D, or astigmatism (nonspherical refractive error) >1.00 D." Exclusion criteria: exclusion criteria unclear but in the results some children were excluded because parents refused, visual acuity was not correctable to ≥ 6/12 in both eyes. Pretreatment: no obvious imbalance |
|
| Interventions |
Intervention 1: Free spectacles and teacher incentive
Comparator: Prescription only
|
|
| Outcomes |
Primary outcome:
Secondary outcomes:
Follow‐up: 6 months |
|
| Notes |
Study name: Seeing is learning: vision care for children in three migrant communities (name on clinical trials registry entry only) Date study conducted: September 2013 (baseline) to follow‐up at 6 months Trial registration number: ISRCTN16720066 (retrospectively registered) Funding: Quote "FUNDING/SUPPORT: THIS STUDY WAS FUNDED BY CATERPILLAR INC (PEORIA, IL, USA), ESSILOR‐CHINA (SHANGHAI), BRIEN Holden Vision Institute (Sydney, Australia), Leibniz Institute of Agricultural Development in Transition Economies (IAMO, Halle, Germany), National Natural Science Foundation of China (Beijing, China) (Grant: 71373255), the Institute of Geographic Sciences and Natural Resources Research (Beijing, China), CAS (Grant: 2013RC204, 2012RC102). N. Congdon is supported by the Chinese government Thousand Man Plan (Beijing, China) and the Ulverscroft Foundation (Anstey, UK). The free spectacles used in this study were supplied by Essilor‐China (Shanghai, China), producers of frames and lenses in China, who also provided financial support for the study." Declaration of interest: all authors reported no financial disclosures. Investigators contacted: no |
|
| Risk of bias | ||
| Bias | Authors' judgement | Support for judgement |
| Random sequence generation (selection bias) | Low risk | Quote: "Randomization was carried out at a central location (Stanford University, Stanford, California, USA) using R software (R Foundation for Statistical Computing, Vienna, Austria)." |
| Allocation concealment (selection bias) | Low risk | Quote: "Randomization was carried out at a central location (Stanford University, Stanford, California, USA) using R software (R Foundation for Statistical Computing, Vienna, Austria)." |
| Blinding of participants and personnel (performance bias) All outcomes | Low risk | Quote: "Participants (students, parents, and teachers) and enumerators were not informed of either the overall design of the study or the explicit treatment arm assignment." |
| Blinding of outcome assessment (detection bias) All outcomes | Low risk | Quote: "These study personnel were masked to children’s group assignment." |
| Incomplete outcome data (attrition bias) All outcomes | Low risk | Judgement comment: "Follow‐up high (>95%) and reasonably equal between groups. 4.7% of the free glasses/teacher incentive group were lost to follow‐up and 4.9% of the prescription only group lost to follow‐up." |
| Selective reporting (reporting bias) | Unclear risk | Judgement comment: not all outcomes on the trials registry entry (ISRCTN16720066) were reported. The trials registry entry specified the following outcomes: 1. Number of children wearing spectacles regularly 2. School performance, determined from a standardized test 3. Student interest in school 4. Student mental health 5. Student self confidence Only outcome (1) available in published reports to date. |
| Baseline imbalance (cluster RCTs only) | Unclear risk | Judgement comment: baseline characteristics of clusters (schools) was not provided. No obvious imbalances on individual level characteristics. |
| Loss of clusters (cluster RCTs only) | Low risk | Judgment comment: no clusters lost |
| Recruitment bias (cluster RCTs only) | Low risk | Judgement comment: recruitment bias unlikely as participants (students, parents, teachers) not informed of the overall design of the study and treatment assignment. |
WEAR 2017.
| Methods |
Study design: RCT Study grouping: parallel group Unit of analysis: person: for ocular measures the better‐seeing eye was used |
|
| Participants |
Country: China Setting: school Baseline characteristics: University optometrist
Ready‐made
Rural refractionist
Self‐refraction
Overall
Inclusion criteria: quote "Children meeting all the following criteria after refraction as described above were eligible for recruitment in the study: 1 Presenting VA (if the child wears glasses, her/his presenting VA is her/his corrected VA with their own spectacles;if the child does not wear spectacles,her/his presenting VA is her/his uncorrectedVA) ≤6/12 in both eyes; 2 Subjective spherical equivalent refractive error (SER) ≤1.00 dioptres(D) in both eyes; 3 Visual acuity (VA) improvable to >6/7.5 in both eyes with refraction as assigned in their group. It was considered unethical to permit children to wear glasses not providing adequate vision, and the goal of the study was to determine whether children achieving good VA with alternative modalities might have ocular discomfort or other issues affecting quality of life. Exclusion criteria: quote "Children with ocular diseases potentially affecting the vision and those with astigmatism or anisometropia ≥2.00 dioptre were excluded, the latter for ethical reasons, following the example of Brady et al. (2012). Children with visual acuity ≤6/7.5 in either eye after self‐refraction, refraction by the rural optometrist or with pseudo‐ready‐made glasses were referred for refraction by the university optometrist and provision of free spectacles after exclusion from the study. Children whose visual acuity could not be improved by the university optometrist were referred to the local county hospital for further examination." Pretreatment: Some imbalances in gender between groups: university optometrist group had more girls (64%) compared with the other groups that had 47% to 55% girls |
|
| Interventions |
Intervention 1: Ready‐made spectacles
Intervention 2: Rural refractionist
Intervention 3: Self‐refraction
Comparator: University optometrist
|
|
| Outcomes |
Primary outcome:
Secondary outcomes:
Follow‐up: 2 months |
|
| Notes |
Study name: Wearability and Evaluation of Adjustable Refraction (WEAR) trial (Phase II) Date study conducted: February 2013‐May 2013 Trial registration number: NCT01704729 Funding: not reported Declaration of interest: not reported Investigators contacted: no |
|
| Risk of bias | ||
| Bias | Authors' judgement | Support for judgement |
| Random sequence generation (selection bias) | Unclear risk | Quote "All provisionally eligible children in each grade and each county (VA <6/12 in both eyes) were randomised individually to one of four groups, stratifying by grade (grade 7 and grade 8) and the two towns" Judgement comment: not reported how the allocation was generated |
| Allocation concealment (selection bias) | Low risk | Quote "Subjects and study personnel administering the questionnaires and assessing VA were masked to study group assignment." |
| Blinding of participants and personnel (performance bias) All outcomes | Low risk | Quote "Subjects and study personnel administering the questionnaires and assessing VA were masked to study group assignment." |
| Blinding of outcome assessment (detection bias) All outcomes | Low risk | Quote "Children themselves and investigators assessing study outcomes were masked to group assignment.” |
| Incomplete outcome data (attrition bias) All outcomes | Low risk | Judgement comment: follow‐up over 95% and balanced between groups |
| Selective reporting (reporting bias) | Low risk | Judgement comment: although there were some differences between the trials registry entry and publication, data on outcomes specified on the trials registry entry that were relevant to this review were available |
Wedner 2008.
| Methods |
Study design: cluster‐RCT Study grouping: parallel group Unit of analysis: analysis by participant with adjustment for clustering by school |
|
| Participants |
Country: Tanzania Setting: school Baseline characteristics: Free spectacles
Prescription only
Overall
Inclusion criteria: Quote "All 51 secondary schools within 30 km from the Centre for Community Based Rehabilitation andTreatment (CCBRT), a non‐government tertiary eye care facility, were invited to participate in the screening, and all but three agreed. Distance visual acuity testing was offered to all students in the first school year. After an intensive period of training, a team of research assistants collected socio‐economic information on participants and tested uncorrected visual acuity (right and left eye separately and both eyes together) with a Snellen’s E‐chart at 6 m. They also tested presenting visual acuity in students who had their own spectacles with them. All students who were not able to identify at least four of the five optotypes in the 12‐line in either eye unaided or wearing their spectacles, were defined as having ‘‘poor eyesight’’ and were referred to CCBRT. At CCBRT, an optometrist retested visual acuity and assessed refractive errors by retinoscopy and subjective refraction. Cycloplegia was only used if hyperopia was suspected. An ophthalmologist performed a detailed eye examination in all students whose visual acuity did not improve to normal (better than 6/12 in both eyes) with best correction. The optometrist also refracted non‐attenders in their schools 2–4 weeks after referral." Exclusion criteria: none reported Pretreatment: more girls in intervention group (71%) compared with comparator (40%). Other imbalances e.g. residence with family, possession of car, TV and computer but with small numbers e.g. 1 vs 4 participants for non‐family residence and 10 versus 5 participants for possessions |
|
| Interventions |
Intervention characteristics Free spectacles
Prescription only
|
|
| Outcomes |
Primary outcome:
2 definitions of spectacle use: all students in categories 1 and 2 and all students in categories 1 to 3
Secondary outcome
Follow‐up: 3 months |
|
| Notes |
Study name: The school eye screening study Date study conducted: January 2004‐August 2004 Trial registration number: NR Funding: quote "Funding: British Council for the Prevention of Blindness (BCPB)." Declaration of interest: quote "Competing interests: None." Investigators contacted: no |
|
| Risk of bias | ||
| Bias | Authors' judgement | Support for judgement |
| Random sequence generation (selection bias) | Low risk | Quote: "Secondary schools were randomly allocated to one of two intervention arms (A or B) before the screening took place." Judgement comment: method of doing allocation not reported but personal communication "computer generated random numbers". |
| Allocation concealment (selection bias) | Low risk | Quote: "Secondary schools were randomly allocated to one of two intervention arms (A or B) before the screening took place." Judgement comment: cluster‐RCT |
| Blinding of participants and personnel (performance bias) All outcomes | Low risk | Quote: "The screening team and the optometrist were not aware of the allocation at the time of visual acuity measurement and refraction." Participants in comparator arm were unaware that children in other schools had received spectacles for free. |
| Blinding of outcome assessment (detection bias) All outcomes | Unclear risk | Judgement comment: not specifically reported whether outcome assessors were masked |
| Incomplete outcome data (attrition bias) All outcomes | Low risk | Judgement comment: follow‐up high and similar between the intervention (85%) and comparator group (88%) |
| Selective reporting (reporting bias) | Low risk | Judgement comment: personal communication: all outcomes were reported as planned |
| Baseline imbalance (cluster RCTs only) | Unclear risk | Judgement comment: cluster‐level data not reported. At an individual level the groups were well balanced apart from gender ‐ fewer boys in intervention group ‐ but the impact of that is unclear |
| Loss of clusters (cluster RCTs only) | Unclear risk | Judgement comment: not clearly reported |
| Recruitment bias (cluster RCTs only) | Low risk | Judgement comment: recruitment bias probably unlikely as the children were unaware of the intervention in the other arm of the study |
CS: custom‐made spectacles; NEI‐RQL‐42: National Eye Institute Refractive Error Quality of Life questionnaire; NR: not reported; RCT: randomised controlled trial; RMS: ready‐made spectacles; VA: visual acuity
Characteristics of excluded studies [ordered by study ID]
| Study | Reason for exclusion |
|---|---|
| Cross 1985 | Not a RCT |
| Gole 2001 | Not a RCT |
| Li 2013 | This was a RCT but was comparison undercorrection of 0.50 dioptres and full correction on the progression of myopia so not directly assessing vision screening |
| Priya 2015 | Not a RCT |
| Pärssinen 2014 | Not a RCT |
| Pärssinen 2015 | Not a RCT |
| Terveen 2015 | Not a RCT |
| Wei 2016 | Not a RCT |
| Yamada 2004 | Not a RCT |
RCT: randomised controlled trial
Characteristics of studies awaiting assessment [ordered by study ID]
Wang 2017.
| Methods | Cluster‐randomised trial |
| Participants | Country: China 882 children with uncorrected visual acuity 6/12 or worse in either eye correctable to better than 6/12 in both eyes 138 randomly‐selected primary schools |
| Interventions | Free spectacles Free spectacles and USD 15 upgrade Free spectacles and USD 30 upgrade No free spectacles (prescription only) |
| Outcomes | Spectacle purchase Follow‐up: 6 months |
| Notes | Date study conducted: October 2014‐June 2015 Trial registration number: NCT02231606 |
Differences between protocol and review
Amendments to the objectives
We simplified the objectives, removing additional statements about subgroup analyses and outcomes, as these are described elsewhere in the methods.
Amendments to the criteria for considering studies for this review
Types of studies: we planned to describe other studies if randomised controlled trials (RCTs) were not found but in the event we identified RCTs and have not considered other study types systematically.
Types of participants: we removed the following sentence as it was not a useful criteria for inclusion "Referred participants will have had a fundus and media examination, post screening, to confirm cases where visual acuity deficit is due to refractive error alone."
Type of interventions: we added in the following comparisons
interventions to improve spectacle use versus no interventions (or other interventions) to improve spectacle use
interventions to reduce cost versus no intervention (or other intervention) to reduce cost
We excluded studies of visual acuity screening at or before school entry as these are more likely to have amblyopia as their target condition and therefore are not relevant to the scope of the review.
Types of outcomes:
we included spectacle wearing as a separate outcome ‐ in the protocol it was specified under the primary outcome which was not so clear;
we added in cost as an outcome to reflect the additional comparisons aimed at improving the cost‐effectiveness of screening
Additional methods
We did an approximate analysis of cluster‐randomised studies following guidance in the Cochrane Handbook for Systematic Reviews of interventions (Higgins 2011b). This situation had not been predicted at the protocol stage although we had specified that we would follow guidance in the Cochrane Handbook for Systematic Reviews of Interventions.
We planned to use a fixed‐effect model if there were fewer than three studies measuring an outcome and a random‐effects model if there were more than that, but in the event the maximum number of studies was three. We felt that a fixed‐effect model was more appropriate but, as this was a judgement call, we added in a sensitivity analysis comparing fixed‐ and random‐effects models.
We prepared 'Summary of findings' tables and did a GRADE assessment, as these are now mandatory Cochrane methods (methods.cochrane.org/mecir).
Methods not used because of lack of data
We specified the standardised mean difference as an effect measure if different instruments had been used to measure the same outcome.
We planned the following subgroup analyses:
failure thresholds of 6/9 (Snellen) or better; worse than 6/9 (Snellen) (or equivalent)
different types of personnel for example teachers, school nurses and eye trained professionals
We planned the following sensitivity analyses:
excluding trials where the judgement on any aspect of methodological quality was high risk of bias;
excluding trials where the judgement on any aspect of methodological quality was high risk of bias or unclear;
excluding industry funded studies;
excluding unpublished studies.
Contributions of authors
Co‐ordinating the review: JE, CP
Undertaking manual searches: CP
Screening search results: JE, PM, CP
Organising retrieval of papers: JE, CP Screening retrieved papers against inclusion criteria: JE, PM, CP
Appraising quality of papers: CP, JE Abstracting data from papers: CP, JE Writing to authors of papers for additional information: CP, JE Providing additional data about papers: CP Obtaining and screening data on unpublished studies: CP Data management for the review: CP, JE Entering data into Review Manager 5: JE Analysis of data: JE, CP Interpretation of data: JE, CP, PM
Writing the review: JE, CP, PM
Sources of support
Internal sources
No sources of support supplied
External sources
-
The College of Optometrists, UK.
The College provided funding to Cochrane Eyes and Vision to update this review (2018).
-
National Institute for Health Research NIHR), UK.
- Richard Wormald, Co‐ordinating Editor for Cochrane Eyes and Vision (CEV) acknowledges financial support for his CEV research sessions from the Department of Health through the award made by the National Institute for Health Research to Moorfields Eye Hospital NHS Foundation Trust and UCL Institute of Ophthalmology for a Specialist Biomedical Research Centre for Ophthalmology.
- This protocol was supported by the National Institute for Health Research, via Cochrane Infrastructure funding to the CEV UK editorial base.
The views and opinions expressed therein are those of the authors and do not necessarily reflect those of the Systematic Reviews Programme, NIHR, NHS or the Department of Health.
Christian Blind Mission, Germany.
Sightsavers International, UK.
Declarations of interest
Jennifer Evans is an investigator of one of the included studies Morjaria 2016. Priya Morjaria is an investigator of one of the included studies Morjaria 2016. Christine Powell: none
New search for studies and content updated (conclusions changed)
References
References to studies included in this review
Congdon 2011 {published data only}
- Congdon N, Li L, Zhang M, Yang A, Gao Y, Griffiths S, et al. Randomized, controlled trial of an educational intervention to promote spectacle use in rural China: the see well to learn well study. Ophthalmology 2011;118(12):2343‐50. [DOI] [PubMed] [Google Scholar]
Morjaria 2016 {published data only}
- Morjaria P, Evans J, Murali K, Gilbert C. Spectacle wear among children in a school‐based program for ready‐made vs custom‐made spectacles in India: a randomized clinical trial. JAMA Ophthalmology 2017;135(6):527‐33. [DOI] [PMC free article] [PubMed] [Google Scholar]
- Morjaria P, Murali K, Evans J, Gilbert C. Spectacle wearing in children randomised to ready‐made or custom spectacles, and potential cost savings to programmes: study protocol for a randomised controlled trial. Trials 2016;17(1):36. [DOI] [PMC free article] [PubMed] [Google Scholar]
RECS 2009 {published data only}
- Zeng Y, Keay L, He M, Mai J, Munoz B, Brady C, et al. A randomized, clinical trial evaluating ready‐made and custom spectacles delivered via a school‐based screening program in China. Ophthalmology 2009;116(10):1839‐45. [DOI] [PMC free article] [PubMed] [Google Scholar]
SIL 2014 {published data only}
- Ma X, Congdon N, Yi H, Zhou Z, Pang X, Meltzer ME, et al. Safety of spectacles for children's vision: a cluster‐randomized controlled trial. American Journal of Ophthalmology 2015;160(5):897‐904. [DOI] [PubMed] [Google Scholar]
- Ma X, Zhou Z, Yi H, Pang X, Shi Y, Chen Q, et al. Effect of providing free glasses on children's educational outcomes in China: cluster randomized controlled trial. BMJ 2014;349:g5740. [DOI: 10.1136/bmj.g5740] [DOI] [PMC free article] [PubMed] [Google Scholar]
SIL II 2015 {published data only}
- Yi H, Zhang H, Ma X, Zhang L, Wang X, Jin L. Impact of free glasses and a teacher incentive on children's use of eyeglasses: a cluster‐randomized controlled trial. American Journal of Ophthalmology 2015;160(5):889‐96. [DOI] [PubMed] [Google Scholar]
WEAR 2017 {published data only}
- Zhou Z, Chen T, Jin L, Zheng D, Chen S, He M, et al. Self‐refraction, ready‐made glasses and quality of life among rural myopic Chinese children: a non‐inferiority randomized trial. Acta Ophthalmology 2017;95(6):567‐75. [DOI] [PubMed] [Google Scholar]
Wedner 2008 {published data only}
- Wedner S, Masanja H, Bowman R, Todd J, Bowman R, Gilbert C. Two strategies for correcting refractive errors in school students in Tanzania: randomised comparison, with implications for screening programmes. British Journal of Ophthalmology 2008;92(1):19‐24. [DOI] [PubMed] [Google Scholar]
References to studies excluded from this review
Cross 1985 {published data only}
- Cross AW. Health screening in schools. Journal of Pediatrics 1985;107(4):487‐94. [DOI] [PubMed] [Google Scholar]
Gole 2001 {published data only}
- Gole G. Refractive errors in childhood and adolescence. Medicine Today 2001;2(10):87‐9. [Google Scholar]
Li 2013 {published data only}
- Li SM, Li SY, Liu LR, Guo JY, Chen W, Wang NL, et al. Full correction and undercorrection of myopia evaluation trial: design and baseline data of a randomized, controlled, double‐blind trial. Clinical and Experimental Ophthalmology 2013;41(4):329‐38. [DOI] [PubMed] [Google Scholar]
Pärssinen 2014 {published data only}
- Pärssinen O, Kauppinen M, Viljanen A. The progression of myopia from its onset at age 8‐12 to adulthood and the influence of heredity and external factors on myopic progression. A 23‐year follow‐up study. Acta Ophthalmologica 2014;92(8):730‐9. [DOI] [PubMed] [Google Scholar]
Pärssinen 2015 {published data only}
- Pärssinen O, Kauppinen M, Viljanen A. Astigmatism among myopics and its changes from childhood to adult age: a 23‐year follow‐up study. Acta Ophthalmologica 2015;93(3):276‐83. [DOI] [PubMed] [Google Scholar]
Priya 2015 {published data only}
- Priya A, Veena K, Thulasiraj R, Fredrick M, Venkatesh R, Sengupta S, et al. Vision screening by teachers in Southern Indian schools: testing a new "all class teacher" model. Ophthalmic Epidemiology 2015;22(1):60‐5. [DOI] [PubMed] [Google Scholar]
Terveen 2015 {published data only}
- Terveen DC, Moser JM, Spencer TS. Results of a pediatric vision screening program in western South Dakota. South Dakota Medicine 2015;68(3):111‐3. [PubMed] [Google Scholar]
Wei 2016 {published data only}
- Wei N, Tong ML, Wang J, Wu GQ, Wu XX, Wang YT, et al. Influence of eye healthcare information teaching for the visual development of children under "combination of medicine and education". International Eye Science 2016;16(8):1531‐3. [Google Scholar]
Yamada 2004 {published data only}
- Yamada Y. Myopia in primary school children. Japanese Journal of Clinical Ophthalmology 2004;58(2):125‐9. [Google Scholar]
References to studies awaiting assessment
Wang 2017 {published data only}
- Wang X, Congdon N, Ma Y, Hu M, Zhou Y, Liao W, et al. Cluster‐randomized controlled trial of the effects of free glasses on purchase of children's glasses in China: The PRICE (Potentiating Rural Investment in Children's Eyecare) study. PLoS One 2017;12:e0187808. [DOI] [PMC free article] [PubMed] [Google Scholar]
Additional references
Altman 1996
- Altman DG, Bland JM. Detecting skewness from summary information. BMJ 1996;313(7066):1200. [DOI] [PMC free article] [PubMed] [Google Scholar]
Banks 1980
- Banks MS. Infant refraction and accommodation. International Ophthalmology Clinics 1980;20(1):205‐32. [DOI] [PubMed] [Google Scholar]
Canoll 1982
- Canoll JP. On emmetropisation. Journal of Theoretical Biology 1982;95(1):135‐44. [DOI] [PubMed] [Google Scholar]
Congdon 2008
- Congdon N, Zheng M, Sharma A, Choi K, Song Y, Zhang M, et al. Prevalence and determinants of spectacle nonwear among rural Chinese secondary schoolchildren: the Xichang Pediatric Refractive Error Study Report 3. Archives of Ophthalmology 2008;126(12):1717‐23. [DOI] [PubMed] [Google Scholar]
Covidence [Computer program]
- Veritas Health Innovation. Covidence. Melbourne, Australia: Veritas Health Innovation, accessed 14 November 2017.
Deeks 2011
- Deeks JJ, Higgins JP, Altman DG, editor(s). Chapter 9: Analysing data and undertaking meta‐analyses. In: Higgins JP, Green S, editor(s). Cochrane Handbook for Systematic Reviews of Interventions Version 5.1.0 (updated March 2011). The Cochrane Collaboration, 2011. Available from handbook.cochrane.org.
Dirani 2010
- Dirani M, Zhang X, Goh LK, Young TL, Lee P, Saw SM. The role of vision in academic school performance. Ophthalmic Epidemiol 2010;17:18‐24. [DOI] [PMC free article] [PubMed] [Google Scholar]
Dudovitz 2016
- Dudovitz RN, Izadpanah N, Chung PJ, Slusser W. Parent, teacher, and student perspectives on how corrective lenses improve child wellbeing and school function. Maternal and Child Health Journal 2016;20:974‐83. [DOI] [PMC free article] [PubMed] [Google Scholar]
Ehrlich 1997
- Ehrlich DL, Braddick OJ, Atkinson J, Anker S, Weeks F, Hartley T, et al. Infant emmetropisation: longitudinal changes in refraction components from nine to twenty months of age. Optometry and Vision Science 1997;74(10):822‐43. [DOI] [PubMed] [Google Scholar]
Glanville 2006
- Glanville JM, Lefebvre C, Miles JN, Camosso‐Stefinovic J. How to identify randomized controlled trials in MEDLINE: ten years on. Journal of the Medical Library Association 2006;94(2):130‐6. [PMC free article] [PubMed] [Google Scholar]
Goldstand 2005
- Goldstand S, Koslowe K C, Parush S. Vision, visual‐information processing, and academic performance among seventh‐grade schoolchildren: a more significant relationship than we thought?. American Journal of Occupational Therapy 2005;59:377‐89. [DOI] [PubMed] [Google Scholar]
Hays 2003
- Hays RD, Mangione CM, Ellwein L, Lindblad AS, Spritzer KL, McDonnell PJ. Psychometric properties of the National Eye Institute‐Refractive Error Quality of Life instrument. Ophthalmology 2003;110(12):2292‐301. [DOI] [PubMed] [Google Scholar]
Higgins 2003
- Higgins JPT, Thompson SG, Deeks JJ, Altman DG. Measuring inconsistency in meta‐analyses. BMJ 2003;327:557‐60. [DOI] [PMC free article] [PubMed] [Google Scholar]
Higgins 2011a
- Higgins JP, Altman DG, Sterne JAC, editor(s). Chapter 8: Assessing risk of bias in included studies. In: Higgins JP, Green S, editor(s). Cochrane Handbook for Systematic Reviews of Interventions Version 5.1.0 (updated March 2011). The Cochrane Collaboration, 2011. Available from handbook.cochrane.org.
Higgins 2011b
- Higgins JP, Deeks JJ, Altman DG, editor(s). Chapter 16: Special topics in statistics. In: Higgins JP, Green S, editor(s). Cochrane Handbook for Systematic Reviews of Interventions Version 5.1.0 (updated March 2011). The Cochrane Collaboration, 2011. Available from handbook.cochrane.org.
Holden 2016
- Holden BA, Fricke TR, Wilson DA, Jong M, Naidoo KS, Sankaridurg P, et al. Global prevalence of myopia and high myopia and temporal trends from 2000 through 2050. Ophthalmology 2016;123:1036‐42. [DOI] [PubMed] [Google Scholar]
Hopkins 2013
- Hopkins S, Sampson GP, Hendicott P, Wood JM. Review of guidelines for children's vision screenings. Clinical and Exprimental Optometry 2013;96(5):443‐9. [DOI] [PubMed] [Google Scholar]
Hung 1995
- Hung L, Crawford M, Smith E. Spectacle lenses alter eye growth and refractive status of young monkeys. Nature Medicine 1995;1(8):761‐5. [DOI] [PubMed] [Google Scholar]
Jensen 1995
- Jensen H. Myopia in teenagers. Acta Ophthalmologica Scandinavica 1995;73(5):389‐93. [DOI] [PubMed] [Google Scholar]
Jonas 2017
- Jonas DE, Amick HR, Wallace IF, Feltner C, Vander Schaaf EB, Brown CL, et al. Vision screening in children aged 6 months to 5 years: evidence report and systematic review for the US preventive services task force. JAMA 2017;318(9):845‐58. [DOI] [PubMed] [Google Scholar]
Kvarnstrom 2001
- Kvarnstrom G, Jakobson P, Lennerstrand G. Visual screening of Swedish children: an ophthalmological evaluation. Acta Ophthalmologica Scandinavia 2001;79(3):240‐4. [DOI] [PubMed] [Google Scholar]
Leone 2010
- Leone JF, Mitchell P, Morgan IG, Kifley A, Rose KA. Use of visual acuity to screen for significant refractive errors in adolescents: is it reliable?. Archives of Ophthalmology 2010;128(7):894‐9. [DOI] [PubMed] [Google Scholar]
Limburg 1999
- Limburg H, Kansara HT, D'Souza S. Results of school eye screening of 5.4 million children in India‐a five‐year follow‐up study. Acta Ophthalmologica Scandinavica 1999;77(3):310‐4. [DOI] [PubMed] [Google Scholar]
Logan 2004
- Logan NS, Gilmartin B. School vision screening, ages 5‐16 years: the evidence‐base for content, provision and efficacy. Ophthalmic and Physiological Optics 2004;24(6):481‐92. [DOI] [PubMed] [Google Scholar]
Ma 2014
- Ma X, Zhou Z, Yi H, Pang X, Shi Y, Chen Q, et al. Effect of providing free glasses on children's educational outcomes in China: cluster randomized controlled trial. BMJ 2014;349:g5740. [DOI] [PMC free article] [PubMed] [Google Scholar]
Maples 2003
- Maples WC. Visual factors that significantly impact academic performance. Optometry 2003;74:35‐49. [PubMed] [Google Scholar]
Mathers 2010
- Mathers M, Keyes M, Wright M. A review of the evidence on the effectiveness of children's vision screening. Child: Care, Health and Development 2010;36(6):756‐80. [DOI] [PubMed] [Google Scholar]
McCullough 2016
- McCullough SJ, O'Donoghue L, Saunders KJ. Six year refractive change among white children and young adults: evidence for significant increase in myopia among white UK children. PLoS One 2016;11:e0146332. [DOI] [PMC free article] [PubMed] [Google Scholar]
Morgan 2017
O'Donoghue 2012
- O'Donoghue L, Rudnicka AR, McClelland JF, Logan NS, Saunders KJ. Visual acuity measures do not reliably detect childhood refractive error‐‐an epidemiological study. PLoS One 2012;7:e34441. [DOI] [PMC free article] [PubMed] [Google Scholar]
Ohio 2004
- Ohio Department of Health Hearing/Vision Screening for Children. www.odh.state.oh.us/odhprograms/hvscr/hvscr1.htm (accessed 3 August 2004).
Pearce 2014
- Pearce MG. Clinical outcomes following the dispensing of ready‐made and recycled spectacles: a systematic literature review. Clinical & Experimental Optometry 2014;97:225‐33. [DOI] [PubMed] [Google Scholar]
PHE 2017
- Public Health England (PHE). New guidance to improve vision screening for young children. www.gov.uk/government/news/new‐guidance‐to‐improve‐vision‐screening‐for‐young‐children accessed 18 January 2018.
Rahi 2001
- Rahi JS, Williams C, Bedford H, Elliman D. Screening and surveillance for ophthalmic disorders and visual deficits in children in the United Kingdom. British Journal of Ophthalmology 2001;85(3):257‐9. [DOI] [PMC free article] [PubMed] [Google Scholar]
Rahi 2002
- Rahi JS, Dezateux C. Improving the detection of childhood visual problems and eye disorders. Lancet 2002;359:1083‐4. [DOI] [PubMed] [Google Scholar]
Resnikoff 2001
- Resnikoff S, Pararajasegaram R. Blindness prevention programmes: past, present, and future. Bulletin of the World Health Organization 2001;79(3):222‐6. [PMC free article] [PubMed] [Google Scholar]
Resnikoff 2008
- Resnikoff S, Pascolini D, Mariotti SP, Pokharel GP. Global magnitude of visual impairment caused by uncorrected refractive errors in 2004. Bulletin of the World Health Organization 2008;86:63‐70. [DOI] [PMC free article] [PubMed] [Google Scholar]
Review Manager 2014 [Computer program]
- Nordic Cochrane Centre, The Cochrane Collaboration. Review Manager 5 (Revman 5). Version 5.3. Copenhagen: Nordic Cochrane Centre, The Cochrane Collaboration, 2014.
Rudnicka 2016
- Rudnicka AR, Kapetanakis VV, Wathern AK, Logan NS, Gilmartin B, Whincup PH, et al. Global variations and time trends in the prevalence of childhood myopia, a systematic review and quantitative meta‐analysis: implications for aetiology and early prevention. British Journal of Ophthalmology 2016;100(7):882‐90. [DOI] [PMC free article] [PubMed] [Google Scholar]
Schünemann 2011
- Schünemann HJ, Oxman AD, Higgins JPT, Vist GE, Glasziou P, Guyatt GH. Chapter 11: Presenting results and ‘Summary of findings' tables. In: Higgins JPT, Green S (editors), Cochrane Handbook for Systematic Reviews of Interventions Version 5.1.0 (updated March 2011). The Cochrane Collaboration, 2011. Available from handbook.cochrane.org.
Sharma 2012
- Sharma A, Congdon N, Patel M, Gilbert C. School‐based approaches to the correction of refractive error in children. Surveys in Ophthalmology 2012;57(3):272‐83. [DOI] [PubMed] [Google Scholar]
Sorsby 1964
- Sorsby A. Modern Ophthalmology. Vol. 3, London: Butterworth, 1964. [Google Scholar]
Wallace 2017
- Wallace DK, Morse CL, Melia M, Sprunger DT, Repka MX, Lee KA, et al. Pediatric eye evaluations preferred practice pattern: I. Vision screening in the primary care and community setting; II. Comprehensive ophthalmic examination. Ophthalmology 2017;125(1):P184‐P227. [DOI] [PubMed] [Google Scholar]
Walline 2011
- Walline JJ, Lindsley K, Vedula SS, Cotter SA, Mutti DO, Twelker JD. Interventions to slow progression of myopia in children. Cochrane Database of Systematic Reviews 2011, Issue 12. [DOI: 10.1002/14651858.CD004916.pub3] [DOI] [PMC free article] [PubMed] [Google Scholar]
Wedner 2000
- Wedner SH, Ross DA, Balira R, Kaji L, Foster A. A prevalence survey of eye diseases in primary school children in a rural area of Tanzania. British Journal of Ophthalmology 2000;84(11):1291‐7. [DOI] [PMC free article] [PubMed] [Google Scholar]
Wedner 2003
- Wedner SH, Dineen B. Refractive errors. Tropical Doctor 2003;33:207‐9. [DOI] [PubMed] [Google Scholar]
WHO 2002
- WHO Refractive Error Working Group. Report on strategic planning meeting of refractive error working group. www.iapb.org/about‐iapb/iapb‐work‐groups/refractive‐error‐work‐group/ (accessed 10 May 2006).
Yap 1994
- Yap M, Wu M, Wang SH, Lee FL, Liu ZM. Environmental factors and refractive errors in Chinese school children. Clinical and Experimental Optometry 1994;77(1):8‐14. [Google Scholar]
References to other published versions of this review
Powell 2004
- Powell C, Wedner S. Screening for correctable visual acuity deficits in school‐age children and adolescents. Cochrane Database of Systematic Reviews 2004, Issue 4. [DOI: 10.1002/14651858.CD005023] [DOI] [PubMed] [Google Scholar]
Powell 2009
- Powell C, Wedner S, Hatt SR. Vision screening for correctable visual acuity deficits in school‐age children and adolescents. Cochrane Database of Systematic Reviews 2009, Issue 3. [DOI: 10.1002/14651858.CD005023.pub2] [DOI] [PubMed] [Google Scholar]