Abstract
Leber hereditary optic neuropathy (LHON) is a syndrome of subacute loss of central vision associated with mutations in mitochondrial DNA coding for components of complex I. LHON preferentially involves small axons in the temporal optic nerve, but the reason is unclear. We performed a Monte Carlo simulation of the spread of injury in LHON axons to better understand the predilection for small axons. Optic nerve slices were modeled as grids containing axons with sizes from reported regional distributions. The propagation of injury from a localized concentration of superoxide was simulated as the spread via passive diffusion from one axon to adjacent axons, with basal production and scavenging rate proportional to axonal area and volume, respectively. Axonal degeneration occurred when intra-axonal concentrations reached a toxic threshold. Simulations demonstrated that almost all small and medium axons degenerated by the time steady-state was reached, but about 50% of large axons were preserved. The location of initial injury affected time to steady state, with nasal injuries reaching steady state faster than temporal injuries. The pattern of axonal degeneration in the simulations mirrored both visual fields and optic nerve histology from patients with LHON. These results provide insight into the nature of axonal loss in LHON.
Subject terms: Hereditary eye disease, Optic nerve diseases
Introduction
Leber hereditary optic neuropathy (LHON) is a mitochondrial optic neuropathy which predominantly affects men in their late teens or early twenties, but can affect both sexes at any age1. The prevalence in England and Finland is 1 in 30–50,000 individuals2–4. LHON is characterized by three clinical phases: presymptomatic, acute, and atrophic. In the presymptomatic phase, patients do not have frank visual loss but may have reduced contrast sensitivity and red-green color impairment5. Fundus examination may reveal peripapillary telangiectatic vessels and/or retinal nerve fiber layer (RNFL) pseudo-edema, particularly in the papillomacular bundle6,7. The electroretinogram can also be reduced5.
The acute phase of the disease is typically characterized by unilateral painless central visual acuity loss to counting fingers or worse. Visual field testing generally reveals central or cecocentral scotomas, likely due to the involvement of the papillomacular bundle8. In 75% of cases, the contralateral eye becomes similarly affected 6–8 weeks after the initial event6. The central or cecocentral visual field defects can progressively enlarge over time9. Eventually there is optic atrophy, and visual loss is usually permanent.
More than 95% of LHON patients display point mutations in mitochondrial DNA (mtDNA) at one of three positions: 11778 (which has the worst long-term visual prognosis), 14484 (which is associated with the best prognosis), and 3460 (which is intermediate with respect to visual prognosis). All 3 mutations code for components of the mitochondrial complex I electron transport chain, which oxidizes NADH by serving as an NADH:ubiquinone oxidoreductase8. Other mutations in genes coding for complex I are also seen, albeit at lower frequencies.
The triggering factors responsible for progression from the presymptomatic to the acute phase are not well understood, and have been hypothesized to include tobacco smoking and alcohol consumption10, vitamin B12 deficiency11, head trauma12, and increased intraocular pressure13.
LHON displays specific clinical features that are shared by a limited number of other diseases, namely cecocentral scotomas (an uncommon pattern of visual field defect), dyschromatopsia, and symmetric and severe bilateral loss of visual acuity. These features are also seen in vitamin B12 deficiency, some toxic optic neuropathies, and dominant optic atrophy. The similar clinical pattern in these diseases is likely due to the selective involvement of small diameter axons within the optic nerve8.
Consistent with this hypothesis, Pan et al. described an orderly pattern of axonal loss in LHON, starting inferotemporally and then progressing centrally, based on post-mortem analysis of optic nerve cross sections14. In LHON, the superonasal axons are affected late in the natural history of the disease14. These findings parallel the size distribution of axons in the human optic nerve, with inferotemporal axons having the smallest radii and superonasal axons having a heterogeneous distribution skewed to larger radii14.
The relation between the selectivity of LHON for small axons and its pathophysiology is unclear. Superoxide anion, an oxygen free radical generated in multiple cellular processes, may be a critical component in LHON pathophysiology. Superoxide is produced at high levels when LHON mtDNA mutations are expressed in cybrids15, and has an important role in the signaling of axonal injury. It is reported to increase in the soma when the axons are injured, consequently leading to apoptosis16,17. In LHON, the dysfunctional complex I loses its oxidizing ability and cannot transfer electrons to ubiquinone from NADH. Superoxide is formed when these electrons reacts with molecular oxygen8. The increase in superoxide production could falsely signal axonal injury and ultimately lead to death of retinal ganglion cells in LHON8,18.
We hypothesized that the preferential small axon involvement in LHON reflects the combination of (1) an increased production of superoxide in LHON axons; and (2) size-dependent rates of superoxide generation and scavenging. To test this hypothesis, we simulated the spread of an initial area of increased superoxide (the “injury”) within a modeled optic nerve using a Monte Carlo approach.
Results
Optic nerve axon distribution
Modeling of optic nerve pathophysiology required that the number and size distribution of axons be realistic, specifically that the number of small, medium and large axons needed to match that of the human optic nerve. For computational reasons, most simulations were performed with an optic nerve that was 10% of the radius (1% of the area) of the human optic nerve. Given that the human optic nerve contains approximately 1,200,000 axons19, most simulations were performed with approximately 12,000 axons. The distributions of small, medium and large axons (each one tertile) across the nerve at the initial state matched that extrapolated from histopathological data derived from normal nerves reported by Pan et al.14 (their Fig. 3). By fitting the data with a three-component Gaussian function, we were able to model a scaled version with 12104 ± 169 axons, based on generating 30 sample optic nerves. The final parameters of the Gaussian function are listed in Supplementary Table 1. The overall adjusted R2 of the Pearson correlation coefficient between the three-component Gaussian function and the actual axonal size data from Pan et al. was 99.8%, illustrating the accuracy of the model.
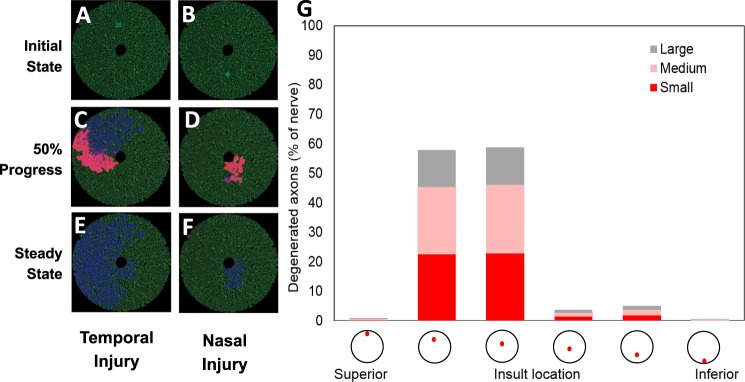
Figure 3.
Sensitivity analysis on superoxide injury location varying along the superior-inferior axis. (A) Schematic of the optic nerve with a superior injury at the initial state (time = 0). (B) Simulation at 50% completion. (C) Simulation at 100% completion (at steady state). (D) Schematic of the optic nerve with an inferior injury at the initial state (time = 0). (E) Simulation at 50% completion. (F) Simulation at 100% completion (at steady state). (G) Steady-state axonal size distribution.
Output from simulation
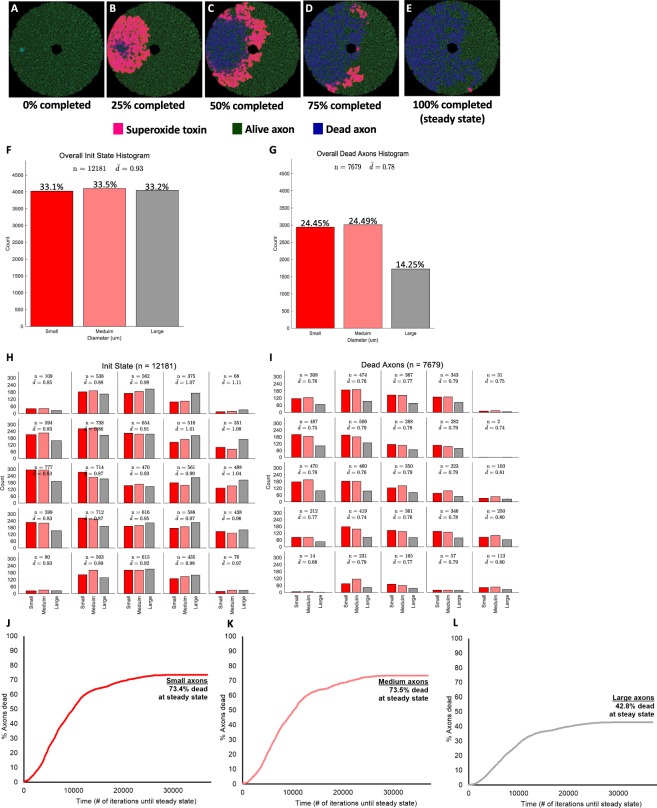
Figure 1 illustrates an example of a simulation of a 10% (radius) scaled version of the optic nerve, with 12181 axons at the initial state. Figure 1A–E and Supplementary Video 1 demonstrate graphically the diffusion of superoxide and the propagation of damage, from the initial to the steady state. The diffusion of superoxide is depicted in pink, while live and degenerated axons are depicted in green and blue, respectively. In this example, the initial superoxide injury was placed in the temporal optic nerve (Fig. 1A) and then progressively spread superotemporally and inferotemporally (Fig. 1B–D). At steady state (Fig. 1E), most temporal axons had degenerated (blue), while a sizable portion of the nasal ones were still alive (green). Figure 1F to I represent the axonal size distribution at the initial (Fig. 1F,H) and final states (Fig. 1G,I). By definition, the initial proportions of small, medium and large axons were equal (Fig. 1F) with a preferential larger number of smaller axons located temporally (red bars on Fig. 1H). There was a larger proportion of large axons (grey bars on Fig. 1H) in the nasal half of the modeled optic nerve.
Figure 1.
Example of simulation of LHON optic nerve degeneration. (A) Schematic of the optic nerve at the initial state (t = 0). (B) Simulation at 25% completion. (C) Simulation at 50% completion. (D) Simulation at 75% completion. (E) Simulation at 100% completion (at steady state). (F) Initial axon size distribution. (G) Steady-state axonal size distribution. (H) Initial axonal size distribution by location. (I) Steady-state axonal size distribution by location. (J) Proportion of small degenerated axons over time. (K) Proportion of medium degenerated axons over time. (L) Proportion of large degenerated axons over time.
Once steady state was reached, 24.4%, 24.5% and 14.2% of small, medium and large axons had degenerated, respectively (Fig. 1G), with preferential loss of smaller axons located temporally (Fig. 1I). Across all simulations, when the initial injury was located temporally, there were more degenerated axons in the temporal half of the optic nerve compared to the nasal one (Fig. 1E,I). Figure 1J to L present the proportion of degenerated axons as the simulation progresses, represented by the total number of iterations until steady state. At steady state, 62.6 ± 3.0% of all axons degenerated, representing 73.2 ± 3.5%, 72.3 ± 3.2% and 42.4 ± 2.6% of small, medium and large axons, respectively (Fig. 1J–L).
These simulations demonstrated that smaller axons are more likely to die than larger axons, and that initial injuries located in the temporal part of the optic nerve (where there are more small axons) are likely to spread and involve much of the temporal optic nerve. These findings match those observed clinically and pathologically14.
Sensitivity analysis of varying simulation parameters
To ensure that the model was pathophysiologically realistic, the following parameters were systematically varied: location of the initial injury, the intra-axonal and extra-axonal superoxide scavenging constants, and the superoxide production constant. In addition, the simulation was repeated for different optic nerves.
Injury location
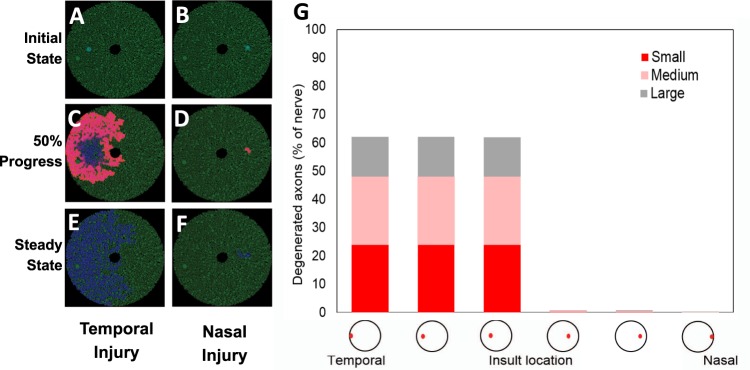
Sensitivity analyses on various injury locations were performed to characterize the superoxide diffusion pattern as a function of the geographical axonal size distribution. For the purpose of this sensitivity analysis, we used the same optic nerve model and changed the injury location along the temporal-nasal axis (Fig. 2, Supplementary Table 2) and the superior-inferior axis (Fig. 3, Supplementary Table 3). Figure 2A,C,E and Supplementary Video 1 illustrate the schematic evolution of the superoxide diffusion rate when the initial injury was located in the temporal optic nerve, and Fig. 2B,D,F and Supplementary Video 2 illustrate it when the initial injury was located in the nasal optic nerve. When the injury was nasal, there was far less propagation of superoxide, and hence degenerated axons, than when it was temporal (Fig. 2A,C,E vs B,D and F). This finding is supported by the proportion of degenerated axons at steady state (Fig. 2G, Supplementary Table 2). When the initial injury was varied from far temporal to mid-temporal to temporal, the proportions of small, medium and large degenerated axons were: 24/24/14%, 24/24/14%, and 24/24/14%, respectively (first three columns in Fig. 2G, Supplementary Table 2). In contrast, when the initial injury was varied from nasal to mid-nasal and then to far-nasal, the proportions of small, medium and large degenerated axons were much lower at (0.35/0.37/0.03%, 0.24/0.32/0.23%, and 0.16/0.06/0.27%, respectively; last three columns in Fig. 2G, Supplementary Table 2).
Figure 2.
Sensitivity analysis on superoxide injury location varying along the temporal-nasal axis. (A) Schematic of the optic nerve with a temporal injury at the initial state (time = 0). (B) Simulation at 50% completion. (C) Simulation at 100% completion (at steady state). (D) Schematic of the optic nerve with a nasal injury at the initial state (time = 0). (E) Simulation at 50% completion. (F) Simulation at 100% completion (at steady state). (G) Steady-state axonal size distribution.
Similarly, the propagation of superoxide displayed a similar dichotomous pattern when the initial injury was varied along the superior-inferior axis (Fig. 3A,C,E vs B,D and F). When the injury was located superiorly or mid-superiorly, there was a greater propagation of superoxide and consequently more degenerating axons. In particular, 23/23/13% of the axons in the superior or mid-superior locations, respectively, had degenerated (Fig. 3G, Supplementary Table 3).
Superoxide-related constants
The rate of superoxide scavenging (detoxification) plays an important role in influencing the diffusion of superoxide, and consequently should influence the steady-state proportion of degenerated axons. Indeed, when the rate of superoxide scavenging within axons (intra-axonal scavenging) was varied from 0.0025 to 0.05 µmol/iteration, the proportion of degenerated axons decreased from 99% to 0.1% (Supplementary Fig. 2 and Supplementary Table 4). The extra-axonal scavenging rate also affected axonal degeneration. When the extra-axonal scavenging rate was varied from 10−6 to 0.05 µmol/iteration, the proportion of degenerated axons decreased from 81% to 0.4% (Supplementary Fig. 3 and Supplementary Table 5).
The amount of superoxide release associated with a degenerating axon was also found to influence the propagation of injury. This was confirmed in a sensitivity analysis performed on the superoxide release constant (µmol per degenerating axon), demonstrating an increase in the proportion of degenerated axons (from 0.2% to 98.3%) when the constant was increased from 1,000 to 30,000 (Supplementary Fig. 4 and Supplementary Table 6).
Simulation repetition
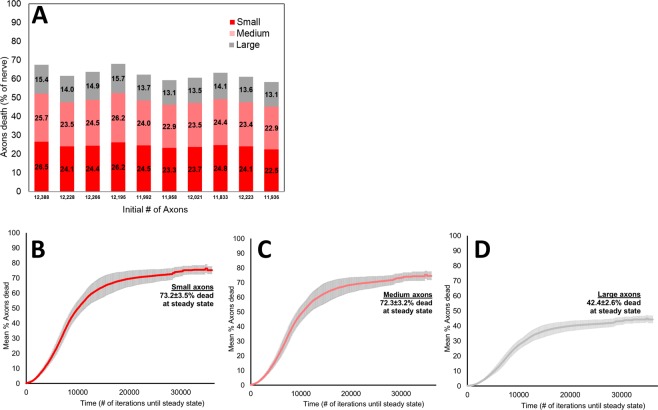
In order to assess the robustness of the model, we studied the variability of the results when it was repeated with different simulated optic nerves and different initial injuries in the same general location. When the simulation was repeated 10 times, with a mean initial number of axons of 12104 ± 169 (Supplementary Table 7), the mean steady-state proportions of degenerated small, medium and large axons were 24.4 ± 1.2%, 24.1 ± 1.1%, and 14.1 ± 0.9%, respectively, i.e. there was relative sparing of larger axons (Fig. 4A and Supplementary Table 7). At steady state, 62.6 ± 3.0% of all axons degenerated. Correspondingly, 73.2 ± 3.5%, 72.3 ± 3.2%, and 42.4 ± 2.6% of small, medium and large axons degenerated at the end of the simulation (Fig. 4B–D). A one-way ANOVA comparing the proportions of degenerated axons within each size category among the 10 runs was not significant (p = 0.99, Supplementary Table 7).
Figure 4.
Degenerated axonal size distribution for 10 different 10% scaled optic nerves with constant simulation parameters and middle temporal injury. (A) Steady-state axonal size distribution for each simulation run. (B) Mean proportion of small degenerated axons over time. (C) Mean proportion of medium degenerated axons over time. (D) Mean proportion of large degenerated axons over time.
Higher optic nerve scaling
20%-Scale Model: Most experiments simulated the optic nerve using a 10% diameter model (1% of the number of axons) because of computational complexity, despite the use of a massively parallel GPU-based platform. To assess whether this scaling produced spurious results, we repeated some studies with a 20%-scale version. Superoxide diffusion and propagation of axonal degeneration were studied using ten independent simulation runs, all with an initial temporal injury. The schematic representation of the superoxide diffusion is illustrated in Supplementary Fig. 5A–C, where the propagation injury stopped nasally at steady state (Supplementary Fig. 5C). The mean initial number of axons was 48560 ± 250 (Supplementary Table 8), and 59.0 ± 3.2% of all axons had degenerated at steady state. Supplementary Fig. 5D depicts the specific proportions of degenerated axons by size at steady state for each run. Similar to the 10%-scale version, the mean steady state proportions of degenerated small, medium and large axons were 23.1 ± 1.3%, 22.9 ± 1.3, and 13.1 ± 0.8%, respectively (Supplementary Fig. 5D and Supplementary Table 8). The proportions of degenerated axons by size over time followed a similar pattern to those in the 10%-scale version, with smaller axons being affected to a greater extent (Supplementary Fig. 5E,F). Specifically, 69.3 ± 3.8%, 68.6 ± 3.7%, and 39.1 ± 2.2% of small, medium and large axons had degenerated by the end of simulation (Supplementary Fig. 5E,F). A one-way ANOVA comparing the proportions of degenerated axons within each size category among the ten runs was not significant (p = 0.99, Supplementary Table 8). A one-way ANOVA comparing the proportions of degenerated axon within each size category among the ten runs for the 10% and 20% scaled versions was also not significant (p = 0.35).
50%-Scale Model: When the model was scaled to 50% of the actual optic nerve size, the simulated number of axons was 304178 axons. Due to computational limitations, we ran a single version of the 50% scale with a temporal injury (Supplementary Fig. 6).
At steady state, the proportions of degenerated small, medium and large axons with the 50% model were 21.7%, 21.3%, and 11.9%, respectively. These values are similar to those seen with the 10% model (small, medium and large: 24.4 ± 1.2%, 24.1 ± 1.1%, and 14.1 ± 0.9%, respectively) and 20% model (small, medium and large axons: 23.1 ± 1.3%, 22.9 ± 1.3%, and 13.1 ± 0.8%, respectively). These results suggest that the simulation and its scalability were robust.
In vivo model validation
In order to validate the clinical relevance of our model and results, we compared visual field data from de-identified patients with LHON to the anatomical distribution of simulated degenerated optic nerve axons at steady state, based on 20 different initial injury locations. The optic nerve was divided into 7 zones, based on the Garway-Heath mapping of the correlation between optic nerve head and visual field20. Visual fields from 43 LHON patients (35 SITA-FAST 30-2 and 8 FASTPAC 30-2) were used. The mean age of the patients was 37 ± 16 years. The means of the visual field mean deviations were −15.1 ± 1.6, −13.6 ± 1.6, −16.0 ± 1.7, −14.8 ± 1.6, −18.2 ± 1.7, 22.5 ± 1.7, and −21.3 ± 1.6 for zones 1, 2, 3, 4, 5, 6.1 and 6.2, respectively (Fig. 5), with the thresholds increasing in a radial pattern from zone 1 on the nasal aspect of the optic nerve to zone 6 on the temporal side.
Figure 5.
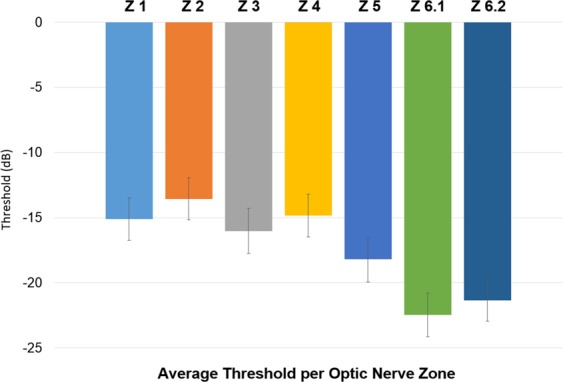
Average mean deviation threshold distribution per Garway-Heath optic nerve zones. Data obtained from 30-2 visual fields from 43 LHON patients.
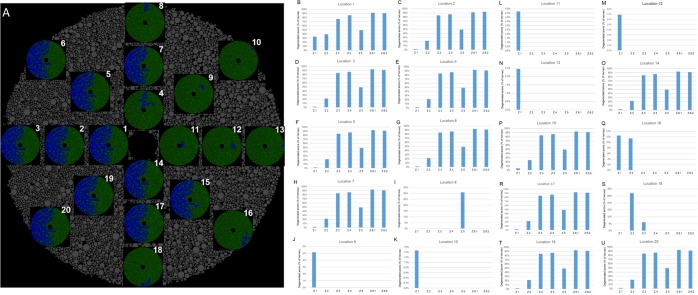
Figure 6A illustrates the 20 simulated initial injury locations and the corresponding profile of superoxide propagation at steady state. Supplementary Table 9 lists the steady state proportions of degenerated axons for each simulated run. Similar to what was found previously, when the initial injury was more nasal, the number of degenerated axons at steady state was lower. Figure 6B to U depict the steady state proportions of degenerated axons grouped by Garway-Heath optic nerve’ zones. For initial injuries located temporally (zones 3, 4 and 6), the steady state proportion of degenerated axons was approximately 60%, regardless of the location of the initial injury. This is consistent with a significant propagation of superoxide in initial temporal injuries. Furthermore, the distribution of axons by zones for these same locations (location 1, 2, 3, 4, 7, 14, 17, 19 and 20, Fig. 6A–D,F–H,O,R,T and U) was consistent and reproducible. Specifically, 5 ± 0.1%, 25 ± 0.1%, 83 ± 0.0%, 86 ± 0.0%, 49 ± 0.0%, 92 ± 0.0% and 91 ± 0.0% of axons in zones 1, 2, 3, 4, 5, 6.1 and 6.2, respectively, had degenerated at steady state when the initial injury was located within the temporal half of the simulated optic nerve. When the initial injury was instead located within the nasal half of the optic nerve (zones 1, 2 and 5), the simulated propagation of superoxide was substantially slower, and the axonal degeneration remained localized within the same zone as the initial injury (Fig. 6J–N,Q).
Figure 6.
10%-scale optic nerve model simulation validation. (A) Schematic of the 20 simulated initial injury locations, their respective steady state superoxide propagation profile and the final proportion of degenerated axons (top right of each optic nerve simulation). (B) Proportion of steady state degenerated axons by Garway-Heath optic nerve zones for initial injury location 1. (C) Proportion of steady state degenerated axons by Garway-Heath optic nerve zones for initial injury location 2. (D) Proportion of steady state degenerated axons by Garway-Heath optic nerve zones for initial injury location 3. (E) Proportion of steady state degenerated axons by Garway-Heath optic nerve zones for initial injury location 4. (F) Proportion of steady state degenerated axons by Garway-Heath optic nerve zones for initial injury location 5. (G) Proportion of steady state degenerated axons by Garway-Heath optic nerve zones for initial injury location 6. (H) Proportion of steady state degenerated axons by Garway-Heath optic nerve zones for initial injury location 7. (I) Proportion of steady state degenerated axons by Garway-Heath optic nerve zones for initial injury location 8. (J) Proportion of steady state degenerated axons by Garway-Heath optic nerve zones for initial injury location 9. (K) Proportion of steady state degenerated axons by Garway-Heath optic nerve zones for initial injury location 10. (L) Proportion of steady state degenerated axons by Garway-Heath optic nerve zones for initial injury location 11. (M) Proportion of steady state degenerated axons by Garway-Heath optic nerve zones for initial injury location 12. (N) Proportion of steady state degenerated axons by Garway-Heath optic nerve zones for initial injury location 13. (O) Proportion of steady state degenerated axons by Garway-Heath optic nerve zones for initial injury location 14. (P) Proportion of steady state degenerated axons by Garway-Heath optic nerve zones for initial injury location 15. (Q) Proportion of steady state degenerated axons by Garway-Heath optic nerve zones for initial injury location 16. (R) Proportion of steady state degenerated axons by Garway-Heath optic nerve zones for initial injury location 17. (S) Proportion of steady state degenerated axons by Garway-Heath optic nerve zones for initial injury location 18. (T) Proportion of steady state degenerated axons by Garway-Heath optic nerve zones for initial injury location 19. (U) Proportion of steady state degenerated axons by Garway-Heath optic nerve zones for initial injury location 20.
Discussion
We performed a Monte Carlo simulation of the spread of superoxide, a putative axonal toxin, in a 2-dimensional model of the human optic nerve. Axons exposed to a threshold concentration of superoxide were marked as degenerating. For an initial temporal injury, the pattern of propagation of superoxide and degenerating axons was consistent with small and medium-sized axons being affected first and to a greater extent than large axons. At steady state, approximately 73% of small and medium-sized axons degenerated, compared to 42% of large ones. These findings were consistent when repeated with similar modeled optic nerves or nerves with more axons (Supplementary Tables 7 and 8). This supports the robustness, repeatability and scalability of the optic nerve and superoxide diffusion models used in this study.
The modeled simulated axonal size distribution was based on actual optic nerve measurements from a published study14, with smaller and larger axons preferentially located temporally and nasally. This asymmetric distribution proved to be critical for the nature of superoxide diffusion and subsequent axonal degeneration. The importance of the axonal size distribution was highlighted by the sensitivity analyses carried on the initial superoxide injury location. For initial injuries located temporally and/or superiorly, where small and medium axons are preferentially located, about 60% of all axons degenerated compared to 2% (with only 0.5% degeneration of large axons, i.e. relative sensitivity of smaller axons) for initial injuries located nasally or inferiorly. Compared to large axons, smaller ones were 1.7 times more likely to die when the initial injury was located in areas containing more small axons.
Sensitivity analyses on the scavenging constants supported the representative nature of the model. Larger scavenging constants resulted in substantially greater axonal viability, i.e. when the intra-axonal scavenging constant increased 10-fold from 0.005 to 0.05 µmol/iteration, the overall proportion of degenerated axons decreased by a factor of 874 (Supplementary Table 4). Similar results were found for the extra-axonal scavenging constant, where a 10-fold increase resulted in a 166-fold decrease in the proportion of degenerated axons (Supplementary Table 5). The relative effect of the intra-axonal scavenging constant on axonal viability was about 5 times larger than that of the extra-axonal constant (874 vs. 166), presumably reflecting the critical role of intra-axonal superoxide concentrations on axonal degeneration.
As expected, the sensitivity analysis of the amount of superoxide released when an axon degenerates demonstrated that there was a level beyond which virtually all axons degenerated. This reflects the limited amount of superoxide scavenging in a biological system. The scalability of the model was excellent, with the proportion of degenerated axons remaining essentially the same when the size of the modeled optic nerve was sequentially increased from 10% to 20% to 50% of the actual human optic nerve.
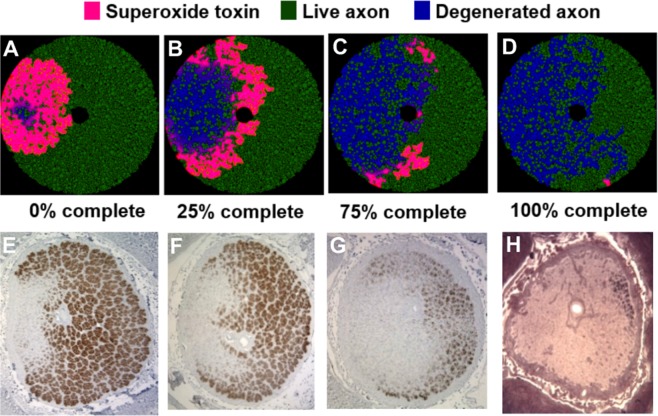
The interaction between the anatomical axonal size distribution and the site of the initial injury provides a putative explanation for the natural history of LHON. Based on the modeled data, larger axons were more protected than smaller ones, likely due to their relatively higher scavenging activity compared to superoxide generation. The preferential effect on small axons correlates with the observation that small axons are preferentially affected in LHON, based on the substantial effects on color vision and visual acuity. Comparison of the steady state distribution of degenerated axons following an initial temporal injury with actual histopathological cross-sections of LHON optic nerves demonstrates a striking similarity (Fig. 7), and supports the preferential sparing of nasal quadrant axons. This nasal sparing was also supported by the correlation in the Garway-Heath optic nerve zone distribution between the mean deviation thresholds obtained from actual LHON visual fields (Fig. 5) and the steady state profile of simulated degenerated axons (Fig. 6). Furthermore, the nasal (zone 1) scavenging of superoxide propagation was consistent and reproducible, regardless of the location of the initial injury.
Figure 7.
Comparison of our simulated 10% scaled optic nerve injury to in vivo histopathological cross-sections of actual LHON optic nerves. (A) Schematic of the optic nerve simulation when 25% of the simulation was completed. (B) Simulation at 50% completion. (C) Simulation at 75% completion. (D) Simulation at 100% completion (at steady state). (E–H) In vivo histopathological cross-sections of actual LHON optic nerves at chronologically increasing stage of the disease (photomicrographs courtesy of Dr. Alfredo Sadun).
Elapsed time to steady state in the simulation reflects the time-course of spread of degeneration from initial injury to completion, the latter defined as reaching the asymptote. Different parameters resulted in different intervals to achieve steady state. Temporal injuries required longer time to reach steady state compared to nasal injuries. For example, 10 simulation runs of the 10% scaled optic nerve demonstrated a mean time to steady state of 448 ± 50 iterations and 220 ± 23 iterations for superotemporal and inferonasal injuries, respectively. This difference is explained by a greater spread of degeneration within the temporal nerve due to a larger proportion of small axons temporally and superiorly, and their greater relative sensitivity to superoxide-mediated degeneration. Assuming that in patients with acute LHON it takes one week for the degeneration to spread throughout the optic nerve with an initial temporal injury, then those patients with an initial nasal injury would have less degeneration, and it would eventually reach steady state in half that time, i.e. 3 to 4 days.
There are several limitations to this simulation. First, it was performed in two dimensions, modeling the optic nerve as a cross section, and therefore not accounting for longitudinal diffusion. Second, it did not take into account the following: (1) differences in diffusion inside glial cells and the microvasculature; (2) differences in diffusion across axonal membranes; and (3) the effects of optic nerve myelination on diffusion. Several of the chosen constants were arbitrary, because of lack of published experimental information. Finally, although there is good evidence that superoxide levels increase in LHON mutations in cybrids15,21 and that RGC death is affected by superoxide17,22, we do not know whether this is true for RGC axons, or whether a different interconvertible reactive oxygen species (e.g. hydrogen peroxide) is the axonal toxin. Future work will consist of (1) simulating the model in three dimensions, thus including longitudinal superoxide diffusion along the axons; (2) taking into account the anatomical transition from unmyelinated to myelinated axons; and (3) validating the model with data from in vitro and in vivo RGC biology.
In summary, we modeled cross-sections of LHON optic nerves, examining the effect of initial superoxide injury location on the propagation and extent of axonal degeneration. The modeled axonal size distribution was based on realistic human optic nerve histological measurements, with smaller and larger axons preferentially located temporally and nasally. The results obtained matched the clinical and pathological findings in patients with LHON, with small axon and temporal nerve degeneration being consistent with clinical observations of cecocentral scotomas and dyschromatopsia. Sensitivity analyses showed that the model was robust, realistic, repeatable, and scalable. Overall, our model and its validation with actual visual fields and pathology provides a pathophysiological mechanism for the initiation and progression of LHON8,21 that is consistent with the anatomical and clinical features of the disease.
Methods
Modeling the human optic nerve
The optic nerve was modeled as a circle superimposed on a matrix of pixels. This two-dimensional section of the human optic nerve was simulated by filling the nerve with axon bundles, where the distribution of axon sizes within each bundle varied depending on the location (superior/inferior and temporal/nasal) within the nerve. Axon cross-sections were assumed to be perfectly circular. The model resolution was set at 10 pixels per µm. The number of pixels inside a circular element was dependent on the diameter of the element itself and the fixed resolution. For example, a 1500 × 1500 matrix was used for a 10% scaled optic nerve.
Model parameters included optic nerve radius, minimum distance between two axons (i.e. clearance, reflecting space for myelin and glial cells), and distribution of axon radii. These parameters were adjusted to reflect the distribution of axons. The number of axons in the human optic nerve is 1.2 × 10⁶ ± 4.7 × 10⁵ axons19. In our model, a 10% scaled version of the optic nerve was mostly used, with a total of appoximately 12000 axons.
Distribution of axon sizes
The distribution of axon radii was derived from the axon diameter histograms for normal nerves (Fig. 3 from Pan et al.14). In order to account for three different groups of axons sizes (small, medium and large), the plotted distributions were fitted with a three-component Gaussian function:
The coefficients of the Gaussian fit were adjusted so that the population mean and standard deviation corresponded to that of Pan et al. for each of the regions of the optic nerve (Fig. 4 from14). The distributions for axon sizes denoted as small, medium and large axons were adjusted so that there were equal numbers of axons in each group.
Diffusion model
The propagation of injury was simulated using an initial localized high concentration of superoxide, which then spread via passive diffusion from one axon to adjacent axons, resulting in their degeneration when the intra-axonal concentrations reached a toxic threshold. This initial injury reflects the increased levels of superoxide associated with LHON mutations in cybrid cells15, the likely cause of the LHON phenotype21,23. The concentration of superoxide within a particular element over time is a function of its concentration and that of its 4 neighboring elements, based on the following equation:
where:
= Superoxide concentration in µmol within element i, j at time t.
= Unitless superoxide diffusion constant between adjacent elements i, j and m, n. The constant depends on location, i.e. whether intra-axonal or extra-axonal.
= Superoxide production rate at element i, j in µmol/iteration. The activity of Na+, K+-ATPase required for axonal membrane repolarization is proportional to the amount of axonal conduction, and reflects the quantity of electrons flowing through the mitochondrial electron transport chain. With an LHON mutation, the increased superoxide production is proportional to the flow of electrons, and therefore the amount of axonal conduction. The latter is a function of the axonal surface area, which is proportional to its circumference in the slice.
= Superoxide scavenging constant in µmol/iteration, assuming a first-order process and equal distribution of superoxide dismutase per unit area in the slice (equivalent to volume in the nerve). The constant varies depending on location, i.e. whether intra-axonal or extra-axonal.
The simulation steady state was considered as attained when the concentration of superoxide varied by less than 0.01 µmol over time.
Based on the histopathology from Pan et al.14, we estimated the number of surviving axons in LHON nerves to range from 35% to 40%. We used this range as a benchmark to guide our diffusion-model analyses in order to achieve realistic numbers at steady state.
Simulation platform
The simulation was coded in C#/C++ (Microsoft Visual Studio 2016), running on an Intel Core i7-4790 CPU at 3.6 GHz. The open source CUDAfy.NET package was used to integrate NVidia CUDA with our GUI in C# [https://cudafy.codeplex.com/]. The simulation of the propagation of injury from axon to axon was massively parallel processed on a NVIDIA® GeForce® GTX 745 graphics card with 394 Cuda cores running at 793 gigaflops (billion floating operations per second).
Analysis of simulation results
Once a steady state was reached, the data were imported into MATLAB for analysis. In order to optimize the diffusion model, a series of sensitivity analyses were performed on parameters thought likely to affect the propagation of superoxide, i.e. the superoxide intra- and extra-axonal scavenging rates and the amount of superoxide released when the axon degenerated. For each parameter, the value was varied while keeping the other parameters constant. The axonal size distribution at steady state was compared for each parameter in the sensitivity analysis.
Simulation interface and graphical output
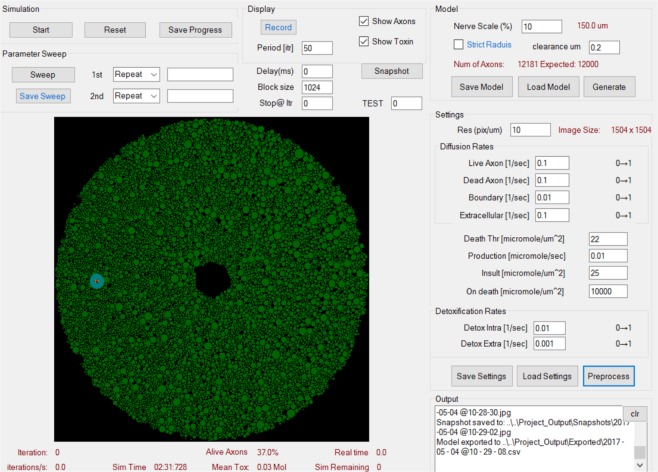
Figure 8 illustrates the interface used to control the optic nerve modelling parameters and the superoxide diffusion parameters. The platform allows recording a simulation as well as taking snapshots at different time intervals. It also displays the number of iterations performed, the proportion of live axons, the mean toxin concentration in µmol, and the simulation time in real time. Figure 1 provides a representation of the optic nerve axons in cross section at the initial state, before the simulation begins.
Figure 8.
Simulation Initialization and Graphical Output. Control panel for the optic nerve modelling parameters (top right section: “Model”) and superoxide diffusion parameters (middle right section: “Diffusion and Scavenging rates”). The platform allows recording a simulation as well as taking snapshots at different time intervals. It also displays the number of iterations performed, the proportion of alive axons, total amount of superoxide in moles as well as the elapsed simulation time. A schematic of the initial state for optic nerve axons is depicted in green.
Comparison of model results with data from LHON patients
Validation of the model was achieved using two types of patient-level data. First, the simulated optic nerve damage in the LHON model was mapped to the visual field that would be expected to result, using the optic nerve zone distribution from the Garway-Heath map20 (Supplementary Fig. 1). The zone-specific thresholds obtained from automated (Humphrey Visual Field; HVF) 30-2 SITA-FAST or FASTPAC visual fields of real LHON patients were then compared to the steady-state distribution of axons obtained from multiple simulations of a 10% optic nerve model. Second, two-dimensional images of dead vs. live axons from LHON simulations were compared to histopathological cross-sections of optic nerves from LHON patients obtained post mortem. Visual fields and histological sections were kindly provided by Alfredo Sadun, MD, PhD.
In order to analyze visual fields from LHON patient, each of the 76 points from the threshold sensitivity map were assigned to their corresponding Garway-Heath optic nerve zone and the mean of the thresholds for each zone was calculated. We then ran 20 different LHON optic nerve simulations using 20 different initial injury locations. For each simulation, the predicted proportion of degenerated axons in each of the Garway-Heath optic nerve zones was calculated. Finally, the amount of predicted zone abnormalities based on visual fields from LHON patients was correlated with the results of the simulations.
Use of material from human participants
Histopathological and visual field material provided by Dr. Alfredo Sadun was obtained in accordance with relevant human subject research guidelines. Specifically, the Instutional Review Board of the University of Southern California had approved the use of these materials for research, including the post-mortem obtaining and processing of optic nerves from participants with LHON. Informed consent was obtained from all participants.
Statistics
One-way ANOVA was used to analyze the effects of propagation surface area, speed, and proportion of degenerated axons based on size (small, medium and large). A p-value less than 0.05 was considered statistically significant.
Supplementary information
Acknowledgements
We are grateful to Alfredo Sadun, MD, PhD for sharing visual fields and histological microphotographs from patients with LHON. This work was supported in part by the National Institutes of Health (R21EY025074 to LAL); the Canada Research Chairs (LAL); and the Canadian Foundation for Innovation (LAL).
Author Contributions
R.G.C. was involved in the following contributions: designing the study, acquiring data, analyzing data, writing the manuscript, and critical review of the manuscript. P.M. was involved in the following contributions: implementation and coding of the algorithm and critical review of the manuscript. L.A.L. was involved in the following contributions: designing the study, implementation of the algorithm, analyzing data, writing the manuscript, and critical review of the manuscript.
Competing Interests
R.G.C. and P.M. declare no competing interestes. L.A.L. has served as a consultant on neuroprotection for the following pharmaceutical companies: Aerie, Allergan, Eyevensys, Galimedix, Prilenia, Quark, and Regenera.
Footnotes
Publisher’s note: Springer Nature remains neutral with regard to jurisdictional claims in published maps and institutional affiliations.
Change history
3/10/2020
An amendment to this paper has been published and can be accessed via a link at the top of the paper.
Supplementary information
Supplementary information accompanies this paper at 10.1038/s41598-019-43180-z.
References
- 1.Dimitriadis K, et al. Leber’s hereditary optic neuropathy with late disease onset: clinical and molecular characteristics of 20 patients. Orphanet J. Rare Dis. 2014;9:158. doi: 10.1186/s13023-014-0158-9. [DOI] [PMC free article] [PubMed] [Google Scholar]
- 2.Spruijt L, et al. Influence of mutation type on clinical expression of Leber hereditary optic neuropathy. Am. J. Ophthalmol. 2006;141:676–682. doi: 10.1016/j.ajo.2005.11.007. [DOI] [PubMed] [Google Scholar]
- 3.Puomila A, et al. Epidemiology and penetrance of Leber hereditary optic neuropathy in Finland. Eur. J. Hum. Genet. 2007;15:1079–1089. doi: 10.1038/sj.ejhg.5201828. [DOI] [PubMed] [Google Scholar]
- 4.Gorman GS, et al. Prevalence of nuclear and mitochondrial DNA mutations related to adult mitochondrial disease. Ann. Neurol. 2015;77:753–759. doi: 10.1002/ana.24362. [DOI] [PMC free article] [PubMed] [Google Scholar]
- 5.Barboni P, et al. Leber’s hereditary optic neuropathy with childhood onset. Invest. Ophthalmol. Vis. Sci. 2006;47:5303–5309. doi: 10.1167/iovs.06-0520. [DOI] [PubMed] [Google Scholar]
- 6.Meyerson C, Van Stavern G, McClelland C. Leber hereditary optic neuropathy: current perspectives. Clin. Ophthalmol. 2015;9:1165–1176. doi: 10.2147/OPTH.S62021. [DOI] [PMC free article] [PubMed] [Google Scholar]
- 7.Savini G, et al. Retinal nerve fiber layer evaluation by optical coherence tomography in unaffected carriers with Leber’s hereditary optic neuropathy mutations. Ophthalmology. 2005;112:127–131. doi: 10.1016/j.ophtha.2004.09.033. [DOI] [PubMed] [Google Scholar]
- 8.Levin LA. Superoxide generation explains common features of optic neuropathies associated with cecocentral scotomas. J. Neuroophthalmol. 2015;35:152–160. doi: 10.1097/WNO.0000000000000250. [DOI] [PMC free article] [PubMed] [Google Scholar]
- 9.Newman NJ, et al. Progression of visual field defects in Leber hereditary optic neuropathy: Experience of the LHON treatment trial. Am. J. Ophthalmol. 2006;141:1061–1067. doi: 10.1016/j.ajo.2005.12.045. [DOI] [PubMed] [Google Scholar]
- 10.Kirkman MA, et al. Gene-environment interactions in Leber hereditary optic neuropathy. Brain. 2009;132:2317–2326. doi: 10.1093/brain/awp158. [DOI] [PMC free article] [PubMed] [Google Scholar]
- 11.Pott JW, Wong KH. Leber’s hereditary optic neuropathy and vitamin B12 deficiency. Graefes Arch. Clin. Exp. Ophthalmol. 2006;244:1357–1359. doi: 10.1007/s00417-006-0269-7. [DOI] [PubMed] [Google Scholar]
- 12.Yu-Wai-Man P, Griffiths PG, Chinnery PF. Mitochondrial optic neuropathies - disease mechanisms and therapeutic strategies. Prog. Retin. Eye Res. 2011;30:81–114. doi: 10.1016/j.preteyeres.2010.11.002. [DOI] [PMC free article] [PubMed] [Google Scholar]
- 13.Thouin A, Griffiths PG, Hudson G, Chinnery PF, Yu-Wai-Man P. Raised intraocular pressure as a potential risk factor for visual loss in Leber Hereditary Optic Neuropathy. PLoS One. 2013;8:e63446. doi: 10.1371/journal.pone.0063446. [DOI] [PMC free article] [PubMed] [Google Scholar]
- 14.Pan BX, et al. Mathematically modeling the involvement of axons in Leber’s hereditary optic neuropathy. Invest. Ophthalmol. Vis. Sci. 2012;53:7608–7617. doi: 10.1167/iovs.12-10452. [DOI] [PMC free article] [PubMed] [Google Scholar]
- 15.Wong A, et al. Differentiation-specific effects of LHON mutations introduced into neuronal NT2 cells. Hum. Mol. Genet. 2002;11:431–438. doi: 10.1093/hmg/11.4.431. [DOI] [PubMed] [Google Scholar]
- 16.Lieven CJ, Hoegger MJ, Schlieve CR, Levin LA. Retinal ganglion cell axotomy induces an increase in intracellular superoxide anion. Invest. Ophthalmol. Vis. Sci. 2006;47:1477–1485. doi: 10.1167/iovs.05-0921. [DOI] [PubMed] [Google Scholar]
- 17.Kanamori A, et al. Superoxide is an associated signal for apoptosis in axonal injury. Brain. 2010;133:2612–2625. doi: 10.1093/brain/awq105. [DOI] [PMC free article] [PubMed] [Google Scholar]
- 18.Hoegger MJ, Lieven CJ, Levin LA. Differential production of superoxide by neuronal mitochondria. BMC Neurosci. 2008;9:4. doi: 10.1186/1471-2202-9-4. [DOI] [PMC free article] [PubMed] [Google Scholar]
- 19.Jonas JB, Schmidt AM, Muller-Bergh JA, Schlotzer-Schrehardt UM, Naumann GO. Human optic nerve fiber count and optic disc size. Invest. Ophthalmol. Vis. Sci. 1992;33:2012–2018. [PubMed] [Google Scholar]
- 20.Garway-Heath DF, Poinoosawmy D, Fitzke FW, Hitchings RA. Mapping the visual field to the optic disc in normal tension glaucoma eyes. Ophthalmology. 2000;107:1809–1815. doi: 10.1016/S0161-6420(00)00284-0. [DOI] [PubMed] [Google Scholar]
- 21.Levin LA. Mechanisms of retinal ganglion specific-cell death in Leber hereditary optic neuropathy. Trans. Am. Ophthalmol. Soc. 2007;105:379–391. [PMC free article] [PubMed] [Google Scholar]
- 22.Kanamori A, Catrinescu MM, Mahammed A, Gross Z, Levin LA. Neuroprotection against superoxide anion radical by metallocorroles in cellular and murine models of optic neuropathy. J. Neurochem. 2010;114:488–498. doi: 10.1111/j.1471-4159.2010.06781.x. [DOI] [PMC free article] [PubMed] [Google Scholar]
- 23.Levin LA. Axonal loss and neuroprotection in optic neuropathies. Can. J. Ophthalmol. 2007;42:403–408. doi: 10.3129/i07-046. [DOI] [PubMed] [Google Scholar]
Associated Data
This section collects any data citations, data availability statements, or supplementary materials included in this article.


