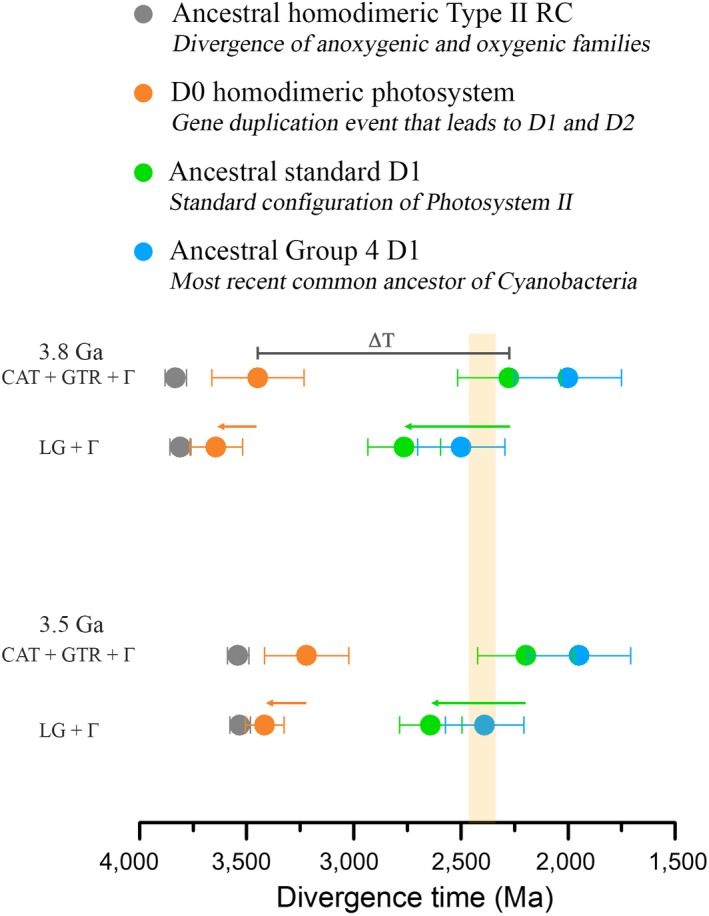
Figure 6.

Scenarios for the evolution of Type II reaction centers. The rows of colored dots represent estimated divergence times of key nodes as highlighted in Figure 3 and calculated using the CAT + GTR + Γ and LG + Γ models and root priors of 3.8 or 3.5 ± 0.05 Ga. A highly oxidizing photosystem with enough power to split water is likely to have originated before the gene duplication event that led to D1 and D2 (orange dot). Making the MRCA of Cyanobacteria older (green arrow) pushes the earliest stages in the evolution of PSII and water oxidation closer to the origin of photosynthesis (orange arrow). The yellow vertical bar marks the GOE [Colour figure can be viewed at wileyonlinelibrary.com]
