Abstract
Hepatocellular carcinoma often reactivates the genes that are transiently expressed in fetal or neonatal livers. However, the mechanism of their activation has not been elucidated. To explore how oncogenic signaling pathways could be involved in the process, we examined the expression of fetal/neonatal genes in liver tumors induced by the introduction of myristoylated v‐akt murine thymoma viral oncogene (AKT), HRas proto‐oncogene, guanosine triphosphatase (HRASV12), and MYC proto‐oncogene, bHLH transcription factor (Myc), in various combinations, into mouse hepatocytes in vivo. Distinct sets of fetal/neonatal genes were activated in HRAS‐ and HRAS/Myc‐induced tumors: aldo‐keto reductase family 1, member C18 (Akr1c18), glypican 3 (Gpc3), carboxypeptidase E (Cpe), adenosine triphosphate‐binding cassette, subfamily D, member 2 (Abcd2), and trefoil factor 3 (Tff3) in the former; insulin‐like growth factor 2 messenger RNA binding protein 3 (Igf2bp3), alpha fetoprotein (Afp), Igf2, and H19, imprinted maternally expressed transcript (H19) in the latter. Interestingly, HRAS/Myc‐induced tumors comprised small cells with a high nuclear/cytoplasmic ratio and messenger RNA (mRNA) expression of delta‐like noncanonical Notch ligand 1 (Dlk1), Nanog homeobox (Nanog), and sex determining region Y‐box 2 (Sox2). Both HRAS‐ and HRAS/Myc‐induced tumors showed decreased DNA methylation levels of Line1 and Igf2 differentially methylated region 1 and increased nuclear accumulation of 5‐hydroxymethylcytosine, suggesting a state of global DNA hypomethylation. HRAS/Myc‐induced tumors were characterized by an increase in the mRNA expression of enzymes involved in DNA methylation (DNA methyltransferase [Dnmt1, Dnmt3]) and demethylation (ten‐eleven‐translocation methylcytosine dioxygenase 1 [Tet1]), sharing similarities with the fetal liver. Although mouse hepatocytes could be transformed by the introduction of HRAS/Myc in vitro, they did not express fetal/neonatal genes and sustained global DNA methylation, suggesting that the epigenetic alterations were influenced by the in vivo microenvironment. Immunohistochemical analyses demonstrated that human hepatocellular carcinoma cases with nuclear MYC expression were more frequently positive for AFP, IGF2, and DLK1 compared with MYC‐negative tumors. Conclusion: The HRAS signaling pathway and its interactions with the Myc pathway appear to reactivate fetal/neonatal gene expression in hepatocytic tumors partly through epigenetic alterations, which are dependent on the tumor microenvironment.
Abbreviations
- 5‐azadC
5‐aza‐2′‐deoxycytidine
- 5hmC
5‐hydroxymethylcytosine
- Abcd2
adenosine triphosphate‐binding cassette, subfamily D, member 2
- AFP
α‐fetoprotein
- Akr1c18
aldo‐keto reductase family 1, member C18
- AKT
v‐akt murine thymoma viral oncogene
- ANOVA
analysis of variance
- CA IX
carbonic anhydrase IX
- Cbr3
carbonyl reductase 3
- CD
clusters of differentiation
- CK19
cytokeratin 19
- Cpe
carboxypeptidase E
- Dlk1
delta‐like noncanonical Notch ligand 1
- DMR
differentially methylated region
- DNMT
DNA methyltransferase
- ERK
extracellular‐signal‐regulated kinase
- Gapdh
glyceraldehyde 3‐phosphate dehydrogenase
- Gpc3
glypican 3
- GSK
glycogen synthase kinase
- H19
H19, imprinted maternally expressed transcript
- HCC
hepatocellular carcinoma
- Hnf4α
hepatocyte nuclear factor 4α
- HRASV12
HRas proto‐oncogene, guanosine triphosphatase
- HTVI
hydrodynamic tail vein injection
- IGF2
insulin‐like growth factor 2
- Igf2bp3
insulin‐like growth factor 2 messenger RNA binding protein 3
- KO
knockout
- Krt20
keratin 20
- Line1
long interspersed nuclear element 1
- Ly6d
lymphocyte antigen 6 complex, locus D
- LYVE1
lymphatic vessel endothelial hyaluronan receptor 1
- MBD1
methyl‐CpG‐binding protein 1
- MEK
mitogen‐activated protein kinase
- mRNA
messenger RNA
- Myc
MYC proto‐oncogene, bHLH transcription factor
- Nanog
Nanog homeobox
- p
phosphorylated
- pERK1/2
phosphorylated ERK
- PI3K
phosphoinositide 3‐kinase
- RT‐qPCR
quantitative reverse transcriptase‐polymerase chain reaction
- SB
Sleeping Beauty
- Scd2
stearoyl‐coenzyme A desaturase 2
- Slpi
secretory leukocyte peptidase inhibitor
- Sox
sex determining region Y‐box
- Spink3
serine peptidase inhibitor, Kazal type 3
- Tet
ten‐eleven‐translocation
- Tet1
ten‐eleven‐translocation methylcytosine dioxygenase 1
- Tff3
trefoil factor 3
- WT
wild type
- YAP
Yes‐associated protein
The expression of fetal liver proteins is frequently reactivated in human hepatocellular carcinoma (HCC), and gene expression patterns similar to those found in hepatoblasts have been shown to be associated with less favorable prognosis in patients.1 We previously identified 15 genes that are specifically and differentially expressed in mouse liver tumors that are induced by a mutagen (diethylnitrosamine) or chronic CCl4 injury and found that their expression is activated in fetal and neonatal livers.2 Although the activation of fetal/neonatal genes in these liver tumors, which is suggestive of the dedifferentiation of transformed hepatocytes, could play an important role in hepatocarcinogenesis, the molecular and cellular mechanisms for the activation of these genes have remained obscure.
Genome‐wide analyses have comprehensively revealed the characteristic driver gene profiles in HCC3 that are associated with the activation of critical oncogenic signaling pathways, including the RAS/mitogen‐activated protein kinase (MEK)/extracellular‐signal‐regulated kinase (ERK), phosphoinositide 3‐kinase (PI3K)/v‐akt murine thymoma viral oncogene (AKT), and MYC pathways.4, 5 However, because of the complexity of genetic abnormalities that are present in individual liver tumors, it has been difficult to examine their interactions in human HCC as well as in liver tumors in conventional animal hepatocarcinogenesis models. Recently, by combining hydrodynamic tail vein injection (HTVI) and the Sleeping Beauty (SB) transposon system, an oncogene‐mediated murine hepatocarcinogenesis model has been established.6 In this model, any oncogenes integrated in a transposon cassette vector can be stably introduced, singly or in combination, in the hepatocyte genome, and hepatocyte‐derived tumors can be rapidly induced, thus providing a particularly suitable experimental system for examining the hepatocarcinogenic potential of various oncogenes and their interactions.
It is possible that the activation of the oncogenic pathways and fetal/neonatal gene expression in liver tumors might be closely associated. Using the transposon‐mediated mouse liver tumor model, we examined the interactions among human HRas proto‐oncogene, guanosine triphosphatase (HRASV12; hereafter referred to as HRAS), human myristoylated AKT (myrAKT; hereafter referred to as AKT), and mouse Myc and reported on the critical role of Myc in hepatocarcinogenesis.7 Here, we analyzed the expression levels of the 15 liver tumor‐specific fetal/neonatal genes that we previously identified in these tumors and found that distinct fractions of these genes were strongly activated either in HRAS‐ or HRAS/Myc‐induced tumors. Importantly, HRAS/Myc‐induced tumors also showed a hepatoblastoma‐like dedifferentiated histologic feature associated with the expression of a hepatoblast marker (delta‐like noncanonical Notch ligand 1 [Dlk1]) as well as stem cell markers (sex determining region Y‐box 2 [Sox2] and Nanog homeobox [Nanog]). Furthermore, we demonstrated that the activation of the fetal/neonatal genes was accompanied by changes in the DNA methylation status, which was at least partly dependent on the tissue microenvironment. Our results highlight the importance of oncogenic activation, especially the RAS and Myc pathways, in the dedifferentiation in hepatocytic tumors.
Materials and Methods
Animal Experiments
C57BL/6J mice were purchased from Charles River Laboratories Japan (Yokohama, Japan).
H19, imprinted maternally expressed transcript (H19) knockout (KO) mice8 were kindly provided by Dr. S.M. Tilghman (Lewis‐Sigler Institute, Princeton University, Princeton, NJ). The protocols used for animal experimentation were approved by the Animal Research Committee, Asahikawa Medical University, and all animal experiments adhered to the criteria outlined in the Guide for the Care and Use of Laboratory Animals. To introduce genes into hepatocytes in vivo, experiments using the combination of the SB transposon system and HTVI were performed as described (Supporting Fig. S1).7 Upon completion of the incubation periods, under deep anesthesia, the livers were briefly perfused with phosphate‐buffered saline through the portal vein and fixed with phosphate‐buffered 4% paraformaldehyde.
Analyses of Human HCC Cases
The retrospective analyses of surgical specimens were approved by the internal review board of Asahikawa Medical University (approval number 18015). A total of 30 HCC specimens from patients who underwent surgical resection were collected and examined by immunohistochemistry.
Immunohistochemistry
Immunohistochemical staining was performed as described in our previous study.9 The antibodies used were as follows: anti‐phosphorylated AKT (Ser473) (#9271; Cell Signaling Technology, Danvers, MA); anti‐glycogen synthase kinase 3β (GSK3β) (total [nonphosphorylated and phosphorylated] GSK3β; #9332; Cell Signaling Technology); anti‐phosphorylated GSK3β (Ser9) (#9336; Cell Signaling Technology); anti‐phosphorylated ERK (pERK1/2) (#4370; Cell Signaling Technology); anti‐Myc (#32072; Abcam, Cambridge, United Kingdom); anti‐insulin‐like growth factor 2 (IGF2) (ab9574; Abcam); anti‐α‐fetoprotein (AFP) (Proteintech, Chicago, IL); anti‐DLK1; Medical and Biological Laboratories, Nagoya, Japan); anti‐cytokeratin 19 (CK19) (kindly provided by Dr. Atsushi Miyajima, Institute of Molecular and Cellular Biosciences, Tokyo University, Tokyo, Japan); SOX9 (Millipore, Billerica, MA); anti‐epithelial cell adhesion molecule (EpCAM) (Novus Biologicals, Centennial, CO); anti‐5‐hydroxymethylcytosine (5hmC) (#39770; Active Motif, Carlsbad, CA); anti‐F4/80 antibody (AbD Serotec, Kidlington, United Kingdom); anti‐α‐smooth muscle actin (Proteintec); anti‐clusters of differentiation (CD)31 (DIA‐310; Dianova, Hamburg, Germany); anti‐lymphatic vessel endothelial hyaluronan receptor 1 (LYVE1) (ab14917; Abcam); anti‐carbonic anhydrase IX (CA IX) (GeneTex, Irvine, CA); and anti‐phosphorylated S6 (pS6, Ser235/236) (2211; Cell Signaling Technology). For the detection of total GSK3β, phosphorylated GSK3β, MYC (human), and phosphorylated AKT (human), we applied signal amplification using the TSA Plus DIG kit (PerkinElmer, Waltham, MA).
Reverse Transcriptase–Quantitative Polymerase Chain Reaction
Total RNA was extracted from frozen liver tissues or cultured cells and subjected to reverse transcriptase–quantitative polymerase chain reaction (RT‐qPCR) analyses as decribed in our previous study.9 The primers used are shown in Supporting Table S1. Two‐dimensional hierarchal clustering of gene expression was performed using z score‐normalized data. The z score was cropped to −2.0 to +2.0 when generating a two‐color heat map.
Bisulfite DNA Sequencing
Genomic DNA extracted from frozen liver tissues or cultured cells was subjected to bisulfite conversion using the EZ DNA Methylation‐Gold Kit (Zymo Research, Irvine, CA). The relevant DNA segments of Line1, the differentially methylated regions (DMRs) of the Igf2 gene, were amplified from the bisulfite‐treated genomic DNA by PCR. The primers used in the bisulfite PCR are shown in Supporting Table S2. The products were analyzed by agarose gel electrophoresis, and the specific bands were excised and purified. Following reamplification, the products were inserted into a plasmid and cloned into competent cells using the TArget Clone (TAK‐101; TOYOBO, Osaka, Japan). At least 10 colonies were picked, plasmid DNA was purified from the competent cells, and sequencing of the inserted products was performed using a primer (5′‐CAGCTATGACCATGATTACG‐3′).
Transformation of Primary Mouse Hepatocytes by Transposon‐Mediated Integration of Oncogenes
Hepatocytes were isolated using the two‐step collagenase perfusion technique from 12‐week‐old male C57BL/6J mice, plated on collagen‐coated dishes, and cultured in Williams’ E medium supplemented with epidermal growth factor (10 ng/mL), insulin (10–7 M), and 10% fetal bovine serum. After 24 hours, the hepatocytes were transfected with the SB13 transposase‐expression plasmid and the transposon cassette plasmids using the Lipofectamine 3000 Transfection Kit (Thermo Fischer Scientific, Waltham, MA). Transformed hepatocytes were cloned using a limiting dilution technique. In some experiments, cloned transformed hepatocytes were treated with a DNA methyltransferase (DNMT) inhibitor (5‐aza‐2′‐deoxycytidine [5‐azadC]; Sigma‐Aldrich, Darmstadt, Germany; 3 µM for 3 days); an MEK inhibitor (PD98059; Cell Signaling Technology; 40 µM for 2 days); a Myc inhibitor (10058‐F4; Abcam; 50 µM for 2 days); and a GSK3β inhibitor (CHIR99021; Focus Biomolecules, Plymouth Meeting, PA; 10 µM for 2 days).
Morphometric Analyses of Immunoreactivity and Tumor Cell Density
To examine the tumor vasculature, we performed immunohistochemistry for CD31 and LYVE1 and quantified the immunoreactivity. Briefly, six lobes of normal liver tissues and eight to nine nodules of liver tumors induced by various oncogenes were randomly selected and five fields were digitally captured for each sample using a 40× objective. The area of immunoreactive cells and tumor cell density in each field were measured using ImageJ 1.51n (National Institutes of Health, Bethesda, MD).
Statistical Analyses
All data are presented as mean ± SD. Statistical analysis was performed using one‐way analysis of variance (ANOVA) with Tukey’s multiple comparisons test, an unpaired t test (two‐tailed), and Fisher’s exact test, using Prism 7 (GraphPad Software, La Jolla, CA).
Results
Pathologic Features of Liver Tumors Induced by AKT or HRAS Alone and by Various Combinations of AKT, HRAS, and Myc
As described by us,7 AKT or HRAS alone induced multiple liver tumors following long incubation periods (AKT, 28 weeks; HRAS, 20 weeks), whereas the combination of AKT and HRAS rapidly induced liver tumors (8 weeks). Although Myc alone was insufficient to induce tumors, it markedly facilitated hepatocarcinogenesis induced by AKT, HRAS, and AKT/HRAS (AKT/Myc, 8 weeks; HRAS/Myc, 7 weeks; AKT/HRAS/Myc, 2 weeks). Gross features of the tumors were variable. Several large discrete nodules resulted from AKT or HRAS alone; fused multiple tumors resulted from AKT/HRAS, AKT/Myc, and HRAS/Myc; and diffuse tumors replacing whole livers were caused by AKT/HRAS/Myc (Supporting Fig. S2). Microscopically, each tumor demonstrated characteristic features according to the oncogene(s) introduced. AKT induced HCC with bile ductular differentiation, which was composed of large fat‐laden tumor cells and intermingled ductular structures; HRAS and AKT/HRAS induced well‐differentiated HCC; AKT/Myc induced moderately differentiated HCC; HRAS/Myc induced tumors with a dense, solid, and sheet‐like proliferation of small cells with a high nuclear/cytoplasmic ratio; AKT/HRAS/Myc induced poorly differentiated HCC, comprising highly atypical tumor cells (Fig. 1).
Figure 1.
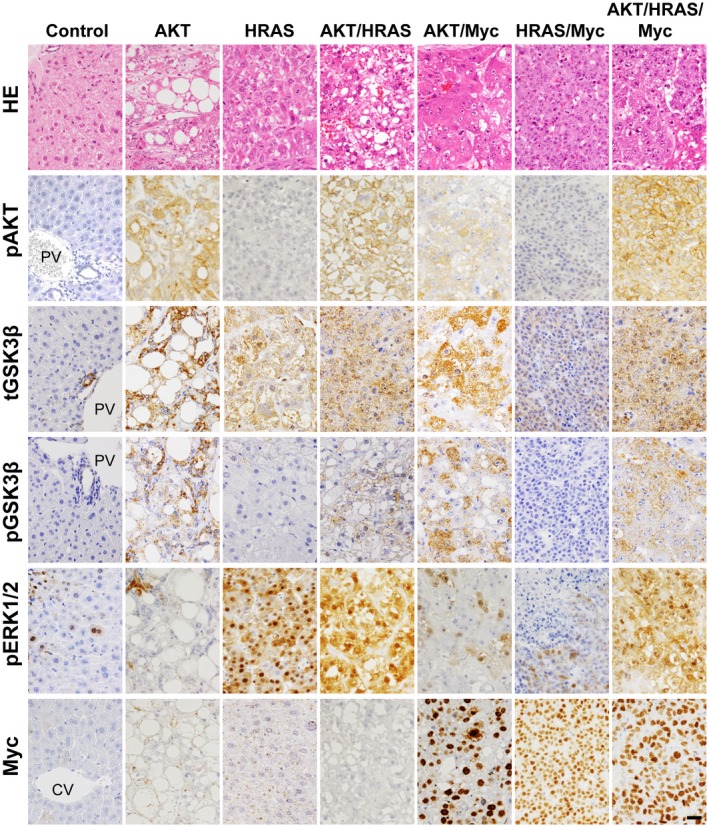
Pathologic features and changes in relevant signaling molecules of liver tumors that are induced by the transposon‐mediated introduction of AKT, HRAS, AKT/HRAS, AKT/Myc, HRAS/Myc, and AKT/HRAS/Myc in mice. HE staining and immunohistochemistry for pAKT, total (nonphosphorylated and phosphorylated) GSK3β, pGSK3β, pERK, and Myc. Control is the intact liver. All photographs were taken at the same magnification; scale bar, 40 µm. Abbreviations: CV, central vein; HE, hematoxylin and eosin; PV, portal vein.
To examine whether the introduction of the oncogenes activates the relevant signaling molecules in the tumors, we performed immunohistochemical analyses for phosphorylated AKT, GSK3β (total and phosphorylated), pERK, and Myc (Fig. 1). As expected, in the tumors in which AKT was introduced, there were high levels of AKT phosphorylation; in addition, GSK3β, which is phosphorylated and inactivated by activated AKT, was also phosphorylated at high levels. The introduction of HRAS induced tumors comprising cells with nuclei containing abundant pERK, except for HRAS/Myc‐induced tumors. High levels of Myc expression were confirmed in the tumors in which Myc was introduced.
Reactivation Of Fetal/Neonatal Gene Expression in the Oncogene‐Induced Liver Tumors
We next examined whether the oncogene‐induced tumors expressed the 15 fetal/neonatal genes previously identified in mouse liver tumors that were induced by diethylnitrosamine or CCl4.2 Messenger RNA (mRNA) expressions of stearoyl‐coenzyme A desaturase 2 (Scd2), secretory leukocyte peptidase inhibitor (Slpi), serine peptidase inhibitor, Kazal type 3 (Spink3), lymphocyte antigen 6 complex, locus D (Ly6d), keratin 20 (Krt20), and carbonyl reductase 3 (Cbr3) were induced in tumors generated by various combinations of AKT, HRAS, and Myc at various levels (Fig. 2). The mRNA expressions of aldo‐keto reductase family 1, member C18 (Akr1c18), glypican 3 (Gpc3), carboxypeptidase E (Cpe), adenosine triphosphate‐binding cassette, subfamily D, member 2 (Abcd2), and trefoil factor 3 (Tff3) were specifically increased in HRAS‐induced tumors, and the co‐introduction of AKT significantly suppressed this expression (Fig. 2). In contrast, mRNA expressions of Igf2 mRNA binding protein 3 (Igf2bp3), Afp, H19, and Igf2 were increased in HRAS/Myc‐induced tumors, and the co‐introduction of AKT either suppressed, enhanced, or did not affect the expression (Fig. 2). The gene expression data were then subjected to unsupervised two‐dimensional hierarchical cluster analysis, yielding mRNA expression profiles that clearly segregated HRAS‐ and HRAS/Myc‐induced tumors (Fig. 3).
Figure 2.
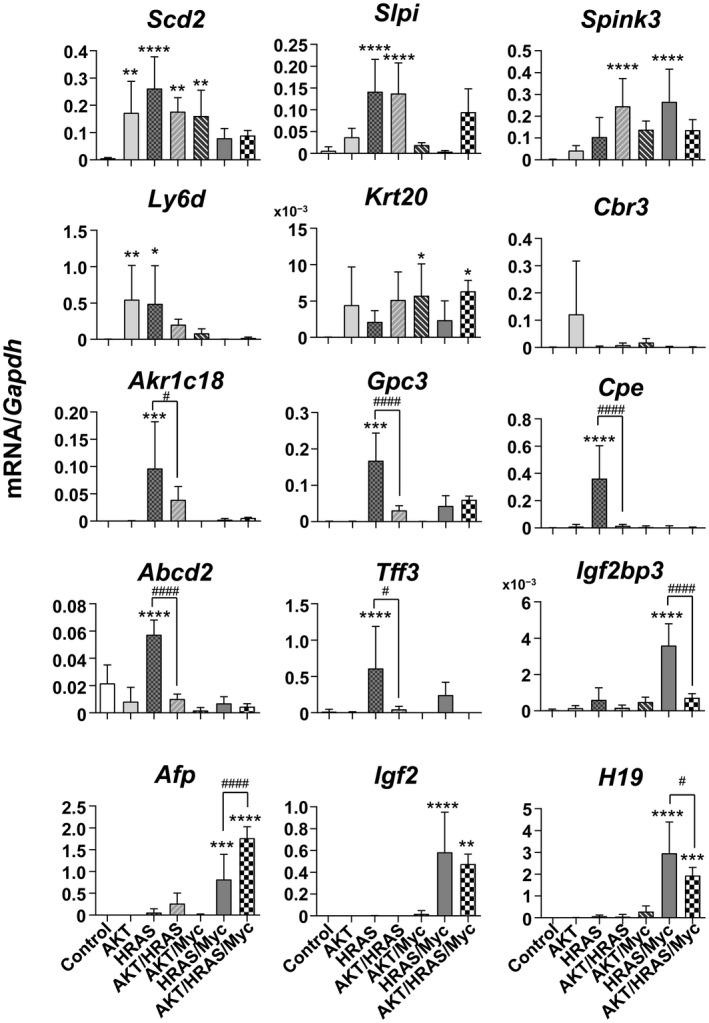
RT‐qPCR analyses of mRNA expression levels of 15 liver tumor‐associated fetal/neonatal genes in the oncogene‐induced liver tumors in mice. Control is the intact liver. One‐way ANOVA (n = 5‐7); *P < 0.05, **P < 0.01, ***P < 0.005, ****P < 0.001 versus control; #P < 0.05, ####P < 0.001 (HRAS versus AKT/HRAS; HRAS/Myc versus AKT/HRAS/Myc, respectively). Data represent mean ± SD.
Figure 3.
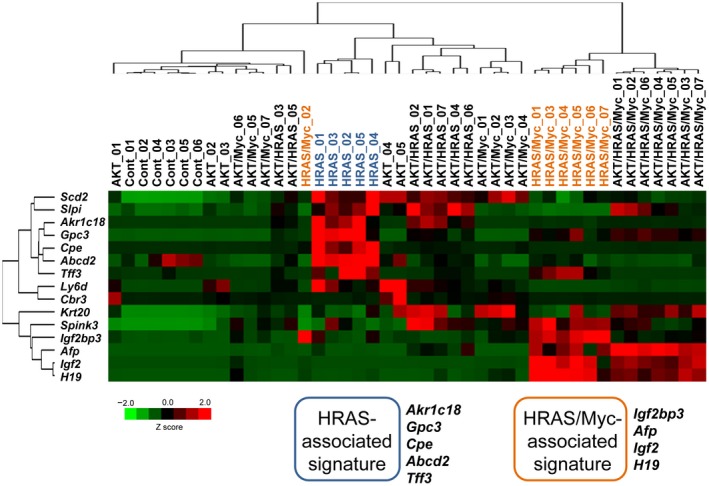
Unsupervised two‐dimensional hierarchical cluster analysis of the mRNA expression levels of liver tumor‐associated fetal/neonatal genes in the oncogene‐induced liver tumors in mice. Data from RT‐qPCR were analyzed.
Dedifferentiated Phenotype of the HRAS/Myc‐Induced Tumors
Because HRAS/Myc‐induced tumors appeared to be unique in their immature histologic features and the mRNA expression of Afp and Igf2, we speculated that they might be dedifferentiated toward hepatoblasts or liver stem/progenitor cells. We first confirmed by immunohistochemistry that AFP and IGF2 were expressed in HRAS/Myc‐ and AKT/HRAS/Myc‐induced tumors (Fig. 4A). We then examined whether these tumors also expressed DLK1, a well‐established marker for hepatoblasts,10 which is highly expressed during the early period of liver development (Fig. 5A). Interestingly, only HRAS/Myc‐induced tumors demonstrated Dlk1 mRNA expression (Fig. 4B) and DLK1 protein expression (Fig. 4A). Furthermore, HRAS/Myc‐induced tumors also demonstrated mRNA expression of the stem cell markers Nanog and Sox2 (Fig. 4B). We also examined mRNA expression of the gene encoding hepatocyte nuclear factor 4α (Hnf4α; P1 isoform) and found that the expression levels of the transcript were significantly lower in all the tumors (Fig. 4B). To examine cholangiocytic differentiation in the tumors, immunohistochemistry for CK19 and Sox9 was performed. CK19 was positive in ductular structures within AKT‐induced tumors and in some cells in AKT/HRAS/Myc‐induced tumors but was negative in other tumors (Fig. 4A). Sox9 was positive in the nuclei of the ductules in AKT‐induced tumors and in some tumor cells in the AKT/HRAS‐, AKT/Myc‐, and AKT/HRAS/Myc‐induced tumors (Fig. 4A). However, no Sox9 immunoreactivity was detectable in the HRAS‐ and HRAS/Myc‐induced tumors (Fig. 4A). EpCAM, which is highly expressed in large bile ducts, was also weakly positive in the nuclei of normal hepatocytes as well as in the oncogene‐induced tumor cells (Supporting Fig. S3). These data indicate that the combination of HRAS and Myc was particularly effective in dedifferentiating hepatocytes toward the immature hepatoblast‐like state.
Figure 4.
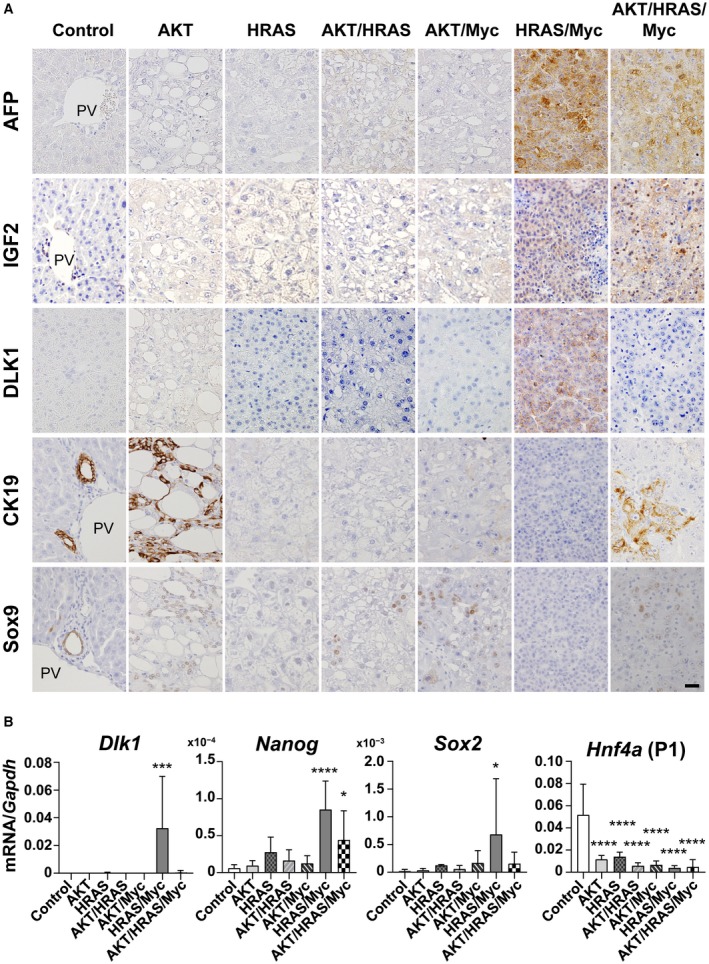
Expression of various differentiation markers in the oncogene‐induced liver tumors in mice. (A) Immunohistochemistry for AFP, IGF2, DLK1, CK19, and Sox9. All photographs were taken at the same magnification; scale bar, 40 µm. (B) RT‐qPCR analyses of mRNA expression levels of Dlk1, Nanog, and Sox2. One‐way ANOVA (n = 5‐7); *P < 0.05, ***P < 0.005, ****P < 0.001 versus control. Data represent mean ± SD. Abbreviation: PV, portal vein.
Figure 5.
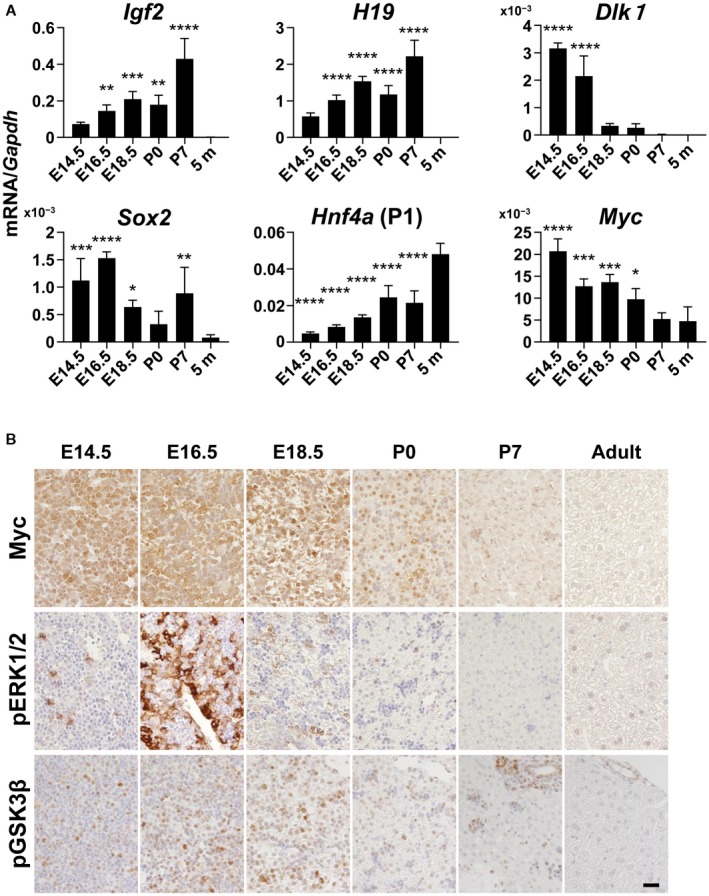
Changes in differentiation markers and signaling molecules in mouse liver development. (A) RT‐qPCR analyses of mRNA levels of Igf2, H19, Dlk1, Sox2, Hnf4a (P1), and Myc. One‐way ANOVA (n = 4); *P < 0.05, **P < 0.01, ***P < 0.005, ****P < 0.001 versus control. Data represent mean ± SD. (B) Immunohistochemistry for pGSK3β, pERK1/2, and Myc. E14.5, E16.5, E18.5 are livers from embryos (14.5, 16.5, and 18.5 days postcoitum, respectively); P0, P7 are livers from neonates (0 and 7 days postpartum, respectively); 5 m are livers from adults (5 months old).
We also examined the mRNA expression of the genes activated in HRAS/Myc‐induced tumors during liver development. Levels of mRNA expression of Igf2 and H19 were gradually increased, reached a maximum at P7, and then declined to zero (Fig. 5A), whereas levels of mRNA expression of Igf2bp3 and Afp were induced at an earlier period and were maintained at high levels at P7 (Supporting Fig. S4). In contrast, Dlk1 mRNA expression was the highest at E14.5 and declined rapidly thereafter, indicating that DLK1 is a marker for early stage hepatoblasts (Fig. 5A). Sox2 mRNA and Nanog mRNA expression levels were also significantly high during fetal and neonatal periods (Fig. 5A; Supporting Fig. S4). Hnf4a mRNA expression was increased as hepatocytic maturation progressed (Fig. 5A). Interestingly, Myc mRNA was highly expressed at E14.5 and gradually decreased in a pattern opposite to Hnf4a (P1) mRNA (Fig. 5A). Immunohistochemical analyses revealed that Myc protein was highly expressed in the nuclei of most hepatoblasts at E14.5 and E16.5, and the expression gradually decreased thereafter (Fig. 5B). pERK was detected in the nuclei of a small population of the hepatoblasts at E14.5 but became strongly positive in the nuclei and cytoplasm of most hepatoblasts at E16.5 and declined thereafter (Fig. 5B). Phosphorylation of GSK3β, which indicates AKT pathway activation, was detected in hepatoblasts with maximum levels at E16.5 and E18.5 (Fig. 5B). These data suggest that the concomitant activation of the RAS and Myc signaling pathways in HRAS/Myc tumors might mimic conditions during the early stage of liver development.
DNA Methylation Status of Line1 and the DMRs of the Igf2 Gene in the Oncogene‐Induced Tumors
It has been shown that DNA methylation at the 5′ position of cytosine in CpG dinucleotides is involved in the silencing of many genes that are activated during the fetal period.11 We next investigated the DNA methylation status of Line1, which has been widely used as a surrogate marker for global DNA methylation,12 in the oncogene‐induced liver tumors. There was a slight but statistically significant hypomethylation in the HRAS‐ and HRAS/Myc‐induced tumors when compared with the other tumors (Fig. 6A; Supporting Fig. S5A). To examine whether active demethylation took place in the HRAS‐ and HRAS/Myc‐induced tumors, we performed immunohistochemistry for 5hmC, an intermediate that is generated during active demethylation. Although the nuclei of hepatocytes in the control liver were weakly positive for 5hmC, the immunoreactivity was stronger in the nuclei of HRAS‐ and HRAS/Myc‐induced tumors and was very weak or almost undetectable in the other tumors (Fig. 6B).
Figure 6.
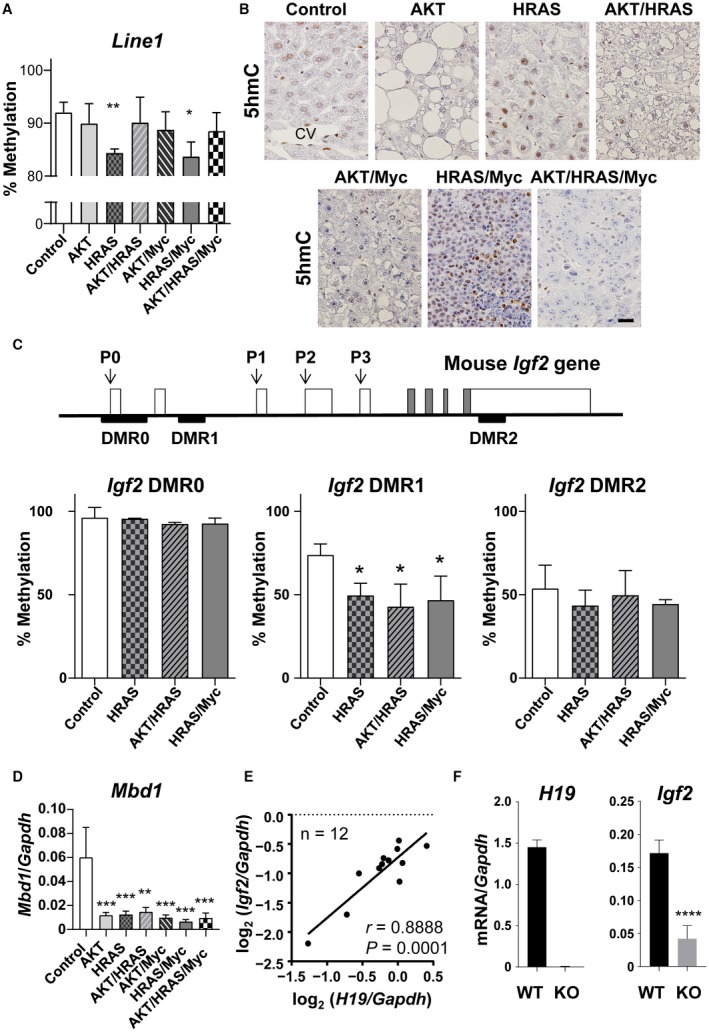
Global and local epigenetic alterations in the oncogene‐induced liver tumors in mice. (A) Bisulfite sequencing analyses of the DNA methylation levels of Line1. Control is the intact liver. Unpaired t test (n = 3); *P < 0.05, **P < 0.01 versus control. (B) Immunohistochemistry for 5hmC. Control is the intact liver. All photographs were taken at the same magnification; scale bar, 40 µm. (C) Structure of the mouse Igf2 gene and bisulfite sequencing analyses of DNA methylation levels of three differentially methylated regions (DMRs) in liver tumors induced by HRAS, AKT/HRAS, and HRAS/Myc. P0, P1, P2, P3, and P4 are promoters. Control is the intact liver. Unpaired t test (n = 3); *P < 0.05 versus control. (D) RT‐qPCR analyses of mRNA expression levels of Mbd1 in the oncogene‐induced tumors. One‐way ANOVA (n = 5‐7); **P < 0.01, ***P < 0.005 versus control. (E) Correlation analysis for the mRNA expression levels of H19 and Igf2 in each nodule of HRAS/Myc‐induced liver tumors, as measured by RT‐qPCR (n = 12); r, Pearson correlation coefficient. (F) Comparison of the mRNA expression levels of H19 and Igf2 in HRAS/Myc‐induced tumors generated in WT and H19 KO mice, as measured by RT‐qPCR. Unpaired t test (WT, n = 5; KO, n = 11); ****P < 0.001. Data in (A,C,D,F) represent mean ± SD. Abbreviation: CV, central vein.
To explore the mechanism for the specific expression of IGF2 in HRAS/Myc‐induced tumors, we also analyzed the DNA methylation status of the DMRs of the Igf2 gene; these have been demonstrated to be involved in the silencing of its gene expression.13 We examined the DNA methylation status of the three regions (DMR0, DMR1, and DMR2) in HRAS‐, AKT/HRAS‐, and HRAS/Myc‐induced tumors. DMR0 is located upstream of the gene and regulates expression of the gene in the placenta,14 whereas DMR1 and DMR2 are located within the Igf2 gene and regulate the expression in fetal tissues (Fig. 6C).14, 15 The results show that significant demethylation of DMR1 compared with that in the intact liver occurred in all tumors examined, whereas the methylation status of DMR0 and DMR2 remained unaltered (Fig. 6C; Supporting Fig. S5B). Hypomethylation of DMR1 was associated with a decrease in the transcription of the gene coding for methyl‐CpG‐binding protein 1 (MBD1), which is known to interact with DMRs16 (Fig. 6D). These results suggest that epigenetic silencing of the Igf2 gene might be cancelled nonspecifically in liver tumors but that the activation of Igf2 gene expression requires a further mechanism to enable transcription.
Transcription of the Igf2 gene and the adjacent H19 gene is regulated by the same enhancer (H19 endoderm enhancer), which is located downstream of the H19 gene.17 Furthermore, a previous report showed that H19 mRNA can enhance Igf2 gene transcription when MBD1 expression is suppressed.18 In fact, in HRAS/Myc‐induced tumors, the levels of Igf2 mRNA were significantly correlated with H19 mRNA expression (Fig. 6E). To examine the effect of the loss of H19 noncoding mRNA and the H19 endoderm enhancer on the transcriptional regulation of the Igf2 gene, we introduced HRAS and Myc into the livers of homozygous H19 KO mice. There were no discernible differences in the time course of tumorigenesis and pathologic features between the tumors generated in the H19 KO and wild‐type (WT) mice (Supporting Fig. S6A,B). However, the expression of Igf2 mRNA was induced in the tumors in H19 KO mice, although the levels were significantly lower compared with those in WT mice (Fig. 6F), suggesting the presence of a mechanism for Igf2 gene induction that is independent of the expression of H19 mRNA and its endodermal enhancer.
Gene Expression of Enzymes Involved in DNA Methylation and Demethylation in Oncogene‐Induced Liver Tumors
Our data showed that the emergence of a dedifferentiated phenotype in the oncogene‐induced liver tumors might be associated with the epigenetic regulation of DNA methylation levels. We then examined the gene expression of enzymes that are involved in DNA methylation and demethylation. It has been demonstrated that DNA methylation is mediated by DNMT, maintenance DNA methylation is mediated by DNMT1, and de novo DNA methylation is mediated by DNMT3a and DNMT3b.19 Although the suppression of DNMT leads to “passive” demethylation through cell division, “active” demethylation can be accomplished by ten‐eleven‐translocation (Tet) enzymes, which mediate the oxidation of 5‐methylcytosine to 5hmC and remove its methyl residue in a cell division‐independent manner.20 RT‐qPCR analyses demonstrated that Dnmt1 mRNA expression was increased specifically in HRAS/Myc‐ and AKT/HRAS/Myc‐induced tumors, whereas Dnmt3a mRNA expression was significantly decreased in AKT‐, HRAS‐, AKT/HRAS‐, and AKT/Myc‐induced tumors (Fig. 7A). Dnmt3b mRNA expression was increased to varying extents in all the tumors except for the AKT‐induced tumors (Fig. 7A). Tet methylcytosine dioxygenase 1 (Tet1) mRNA expression was markedly increased in the HRAS‐ and HRAS/Myc‐induced tumors (Fig. 7A), compatible with the findings of the presence of immunoreactivity for 5hmC in these tumors (Fig. 6B). Tet2 mRNA expression was not affected in any of the tumors, whereas Tet3 mRNA expression was suppressed in the AKT‐, HRAS‐, AKT/HRAS‐, and AKT/Myc‐induced tumors (Fig. 7A).
Figure 7.
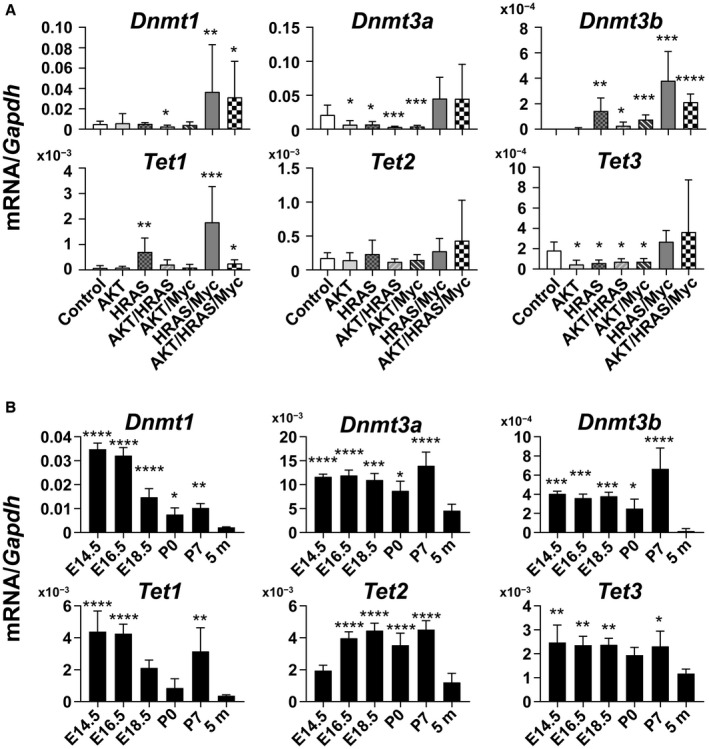
Quantitative analyses of mRNA levels of genes encoding enzymes involved in DNA methylation and demethylation in the oncogene‐induced liver tumors and developing livers. (A) mRNA expression levels of the genes for DNA methyltransferases (Dnmt1, Dnmt3a, and Dnmt3b) and Tet families (Tet1, Tet2, and Tet3) in liver tumors. Control is the intact liver. Unpaired t test (n = 5‐7); *P < 0.05, **P < 0.01, ***P < 0.005, ****P < 0.001 versus control. (B) mRNA expression levels of Dnmt1, Dnmt3a, Dnmt3b, Tet1, Tet2, and Tet3 in the livers at various stages of development. E14.5, E16.5, E18.5 are livers from embryos (14.5, 16.5, and 18.5 days postcoitum, respectively); P0, P7 are livers from neonates (0 and 7 days postpartum, respectively); 5 m are livers from adults (5 months old). One‐way ANOVA (n = 4); *P < 0.05, **P < 0.01, ***P < 0.005, ****P < 0.001 versus 5 m. Data in (A,B) represent mean ± SD.
These data suggest that HRAS/Myc‐induced tumors with hepatoblastoma‐like features are characterized by the activation of both DNA methylation and demethylation, which might be a recapitulation of the epigenetic status of the immature liver. We then examined the time course of the mRNA expression of either DNMT or Tet family members during mouse liver development (Fig. 7B). Dnmt1 mRNA expression exhibited its highest levels in E14.5 and E16.5 livers and gradually decreased thereafter, whereas the mRNA expression of Dnmt3a and Dnmt3b was high throughout the fetal and perinatal periods (Fig. 7B). Maximal Tet1 mRNA expression was observed at E14.5 and E16.5, but the expression was increased also at P7 (Fig. 7B). Tet2 mRNA expression increased at a later period of liver development, whereas Tet3 mRNA expression levels were slightly higher during the fetal and neonatal periods compared with those in the adult liver (Fig. 7B).
Lack of Fetal/Neonatal Gene Expression in Hepatocytes Transformed In Vitro by Transfection with HRAS and Myc
To further examine the mechanisms for oncogene‐mediated fetal/neonatal gene expression, we applied transposon‐mediated gene delivery to the in vitro transformation of mouse hepatocytes. Primary‐cultured mouse hepatocytes were transfected with HRAS‐ and/or Myc‐expressing transposon cassette plasmids together with an enhanced green fluorescent protein (EGFP)‐expressing transposon cassette plasmid and an SB13 transposase‐expressing plasmid. Although transfection of HRAS or Myc alone failed to induce transformation, transfection of both HRAS and Myc induced the formation of colonies of EGFP‐positive transformed hepatocytes, which were propagated and cloned (Supporting Fig. S7A). The established clones (RMC1‐3) expressed both FLAG‐HRAS mRNA and Myc mRNA at slightly less but comparable levels to those observed in HRAS/Myc‐induced tumors (Supporting Fig. S7B).
The mRNA expression levels for Dnmt1 and Tet1 were variable, and those for Dnmt3a and Dnmt3b were very low in the transformed cell lines when compared with those in HRAS/Myc‐induced liver tumors in vivo (Supporting Fig. S7B). To explore whether the gene expression of these enzymes was controlled by the RAS–MEK, Myc, and PI3–AKT pathways, we performed experiments using specific inhibitors for MEK (PD98059), Myc (10058‐F4), and GSK3 (CHIR99021). The mRNA expression of DNMTs was augmented by MEK inhibition but was suppressed by Myc inhibition (Supporting Fig. S8). GSK3 inhibition enhanced the mRNA expression of Dnmt1 and Dnmt3 but suppressed that of Dnmt2 (Supporting Fig. S7). Tet1 mRNA expression was affected only slightly by these inhibitors (Supporting Fig. S8). These results suggest that the gene expression of epigenetic regulation factors was only partially dependent on the oncogenic alterations of these signaling pathways.
We examined the DNA methylation levels of Line1 and Igf2 DMR1 in RMC1 and found that they were maintained at the levels similar to those in the control liver (Fig. 8A; see Fig. 6A,C for the control liver). In accordance with the lack of demethylation, HRAS/Myc‐induced cell lines did not activate the gene expression that was characteristic in the HRAS/Myc‐induced tumors in vivo (Supporting Fig. S9). To examine whether the maintained DNA methylation withheld the fetal/neonatal gene expression in the cell lines that were transformed by HRAS/Myc, we examined the effects of 5‐azadC, an inhibitor of DNMTs, on the mRNA expression of these genes. Bisulfite sequencing demonstrated that the DNA methylation levels of Line1 and Igf2 DMR1 in RMC1 were reduced (Fig. 8A). Although there were considerable variations among the cell lines, the mRNA expression levels of Dlk1, Afp, Igf2, H19, Nanog, and Sox2 were increased by 5‐azadC treatment (Fig. 8B; Supporting Fig. S8). The mRNA expression levels of Scd2, Slpi, Tff3, Akr1c18, Ly6d, Gpc3, and Cpe were also increased (Supporting Fig. S8). In contrast, the mRNA expression levels of Spink3, Scd2, and Abcd2 were suppressed by 5‐azadC treatment (Supporting Fig. S9).
Figure 8.
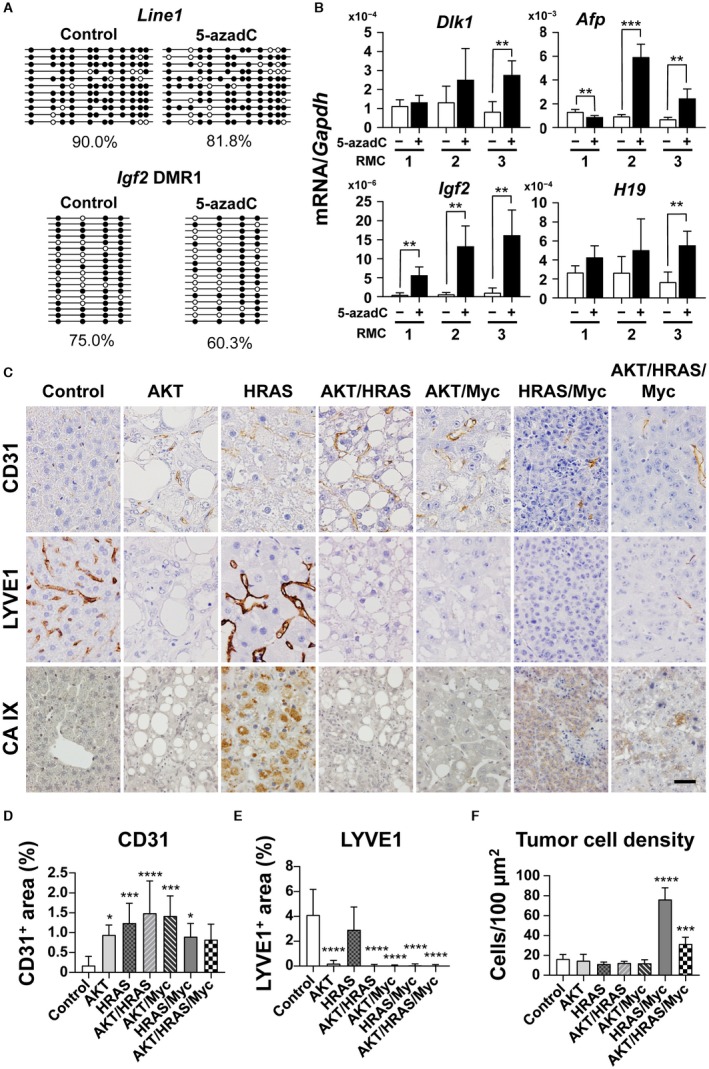
Fetal/neonatal gene expression and epigenetic changes in mouse hepatocytes transformed in vitro by HRAS and Myc and unique histologic features of HRAS‐ and HRAS/Myc‐induced liver tumors. (A) RT‐qPCR analyses of the mRNA levels of Dlk1, Afp, Igf2, and H19 in hepatocytic lines that were transformed in vitro by the transposon‐mediated introduction of HRAS and Myc (RMC, clones 1‐3). When cells became subconfluent, they were treated with PBS (‐, white bars) or 5‐azadC (3 µM; +, black bars), an inhibitor of DNA methyltransferases, for 3 days. (B) Bisulfite sequencing analyses of the DNA methylation levels of Line1 and Igf2 DMR1 in RMC clone 1. Methylation patterns and % methylation of PBS‐treated (Control, left) and 5‐azadC‐treated (right) cells are shown. Four independent experiments were performed; one‐way ANOVA; **P < 0.01, ***P < 0.005. Data represent mean ± SD. (C) Immunohistochemistry for CD31, LYVE1, and CA IX of the oncogene‐induced liver tumors in mice. All photographs were taken at the same magnification; scale bar, 40 µm. (D‐F) Quantitative analyses of percentages of the (D) CD31‐positive area, (E) LYVE1‐positive area, and (F) cell density in each of the tumors. Control, intact liver. Five microscope fields (40× objective) were photographed and analyzed for each sample. One‐way ANOVA (control, n = 6; liver tumors, n = 8‐9); *P < 0.05, ***P < 0.005, ****P < 0.001 versus control. Abbreviation: PBS, phosphate‐buffered saline.
Unique In Vivo Microenvironment in Liver Tumors with Dedifferentiated Features
Our results suggested that the dedifferentiated phenotype with epigenetic alterations could be strongly influenced by the in vivo microenvironment. There was a general increase in F4/80‐positive macrophages without significant inflammatory reactions in the tumor tissues (Supporting Fig. S10). Furthermore, all the tumors demonstrated similar levels of the activation of hepatic stellate cells (Supporting Fig. S10). Because epigenetic mechanisms have been shown to be regulated by oxygen availability, we analyzed the vascularity of the tumors by immunohistochemistry for CD31, a marker for endothelial cells, and LYVE1, a marker for sinusoidal endothelial cells.21 In the normal liver tissues, most of the sinusoidal endothelial cells were positive for LYVE1 but were negative for CD31, which was only positive in the portal veins, central veins, and hepatic arteries (Fig. 8C‐E). In contrast, the tumor vasculature was exclusively composed of CD31‐positive, LYVE1‐negative endothelial cells in the AKT‐, AKT/HRAS‐, AKT/Myc‐, HRAS/Myc‐, and AKT/HRAS/Myc‐induced tumors (Fig. 8C‐E). However, the HRAS‐induced tumors characteristically contained both CD31‐positive and LYVE1‐positive endothelial cells (Fig. 8C‐E), indicating the possible participation of the original sinusoidal structures in the tumor vasculature. Among the tumors, tumor cell density was extremely high in the HRAS/Myc‐induced tumors, although the density of CD31‐positive tumor vessels was comparable to those in the other tumors (Fig. 8E,F). Interestingly, the expression of CA IX, a marker for tissue hypoxia, was more marked in the HRAS‐ and HRAS/Myc‐induced tumors compared with other tumors (Fig. 8C). Although CA IX is a transmembrane protein and typically detected at the cell membrane, cytoplasmic CA IX, which could be attributed to endocytosis,22 was also found in tumor cells.23
Preferential Expression of Dedifferentiation Markers in Myc‐Positive Human Hcc
We retrospectively examined human HCC cases for the expression of MYC and dedifferentiation marker proteins (AFP, IGF2, and DLK1) by immunohistochemistry and tested whether MYC‐positive tumors were more prone to express the dedifferentiation markers (Fig. 9A). The analyses demonstrated that AFP‐, IGF2‐, and DLK1‐positive tumors were more frequent in MYC‐positive tumors compared with MYC‐negative tumors (Fig. 9B; statistically significant in AFP and DLK1, Fisher’s exact test). Phosphorylated AKT was detected either in MYC‐positive or MYC‐negative tumors (Fig. 9A; Supporting Table S3). Interestingly, in a case (#4) negative for the differentiation markers despite strong MYC expression, tumor cells were highly positive for phosphorylated AKT (Fig. 9A). There was also intratumoral heterogeneity in the expression of the differentiation markers that was partly associated with the levels of MYC and phosphorylated AKT (Fig. 9C, case #1).
Figure 9.
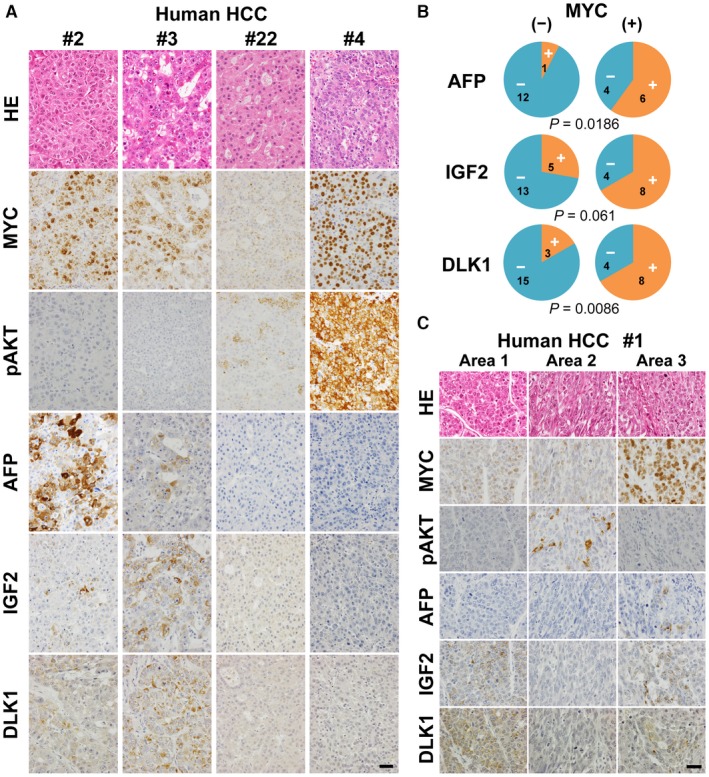
Expression of fetal/neonatal proteins in human HCC cases. (A) HE staining and immunohistochemistry for MYC, pAKT, AFP, IGF2, and DLK1 of the liver tumors from cases #2, 3, 22, and 4 (Supporting Table S3). All photographs were taken at the same magnification; scale bar, 40 µm. (B) Pie charts indicating the relative representation of AFP‐, IGF2‐, and DLK1‐positive (orange) and ‐negative (blue) tumors either in MYC‐negative or MYC‐positive cases. Characters in each fraction of the pies indicate the numbers of cases included. P values (Fisher’s exact test) are shown below the charts. (C) HE staining and immunohistochemistry for MYC, pAKT, AFP, IGF2, and DLK1 of the liver tumors from case #1 (Supporting Table S3). Photographs taken from three adjacent but distinct areas within a tumor nodule. All photographs were taken at the same magnification; scale bar, 40 µm. Abbreviation: HE, hematoxylin and eosin.
Discussion
In the present study, we showed that hepatocyte‐derived liver tumors induced by various oncogenes reactivated the expression of genes that are actively transcribed and expressed in fetal or neonatal livers. In particular, HRAS and HRAS/Myc generated tumors with distinct batteries of fetal/neonatal genes, and the latter also expressed Dlk1 mRNA and DLK1 protein, a marker of early stage hepatoblasts, and the mRNA for two well‐established stem cell markers (Sox2 and Nanog). In our previous report, the transposon‐mediated introduction of Myc and activated Yes‐associated protein (YAP) (an S127A mutant) into mouse hepatocytes induced dedifferentiated tumors that expressed Afp, Dlk1, Nanog, and Sox2 9 as well as Igf2, H19, and Tff3 (Watanabe et al., unpublished data). Our analyses of human HCC cases also demonstrated that MYC expression was closely associated with the expression of AFP, IGF2, and DLK1. These results suggest that the activation of Myc is crucial for the hepatoblastic dedifferentiation of mature hepatocytes. This notion is consistent with our findings that show that Myc is highly activated in hepatoblasts during early liver development. HRAS/Myc‐ and Myc/YAP‐induced tumors share hepatoblastoma‐like dedifferentiated histologic features. However, in contrast to Myc/YAP‐induced tumors, which were reminiscent of combined hepatocellular–cholangiocarcinoma,9 HRAS/Myc‐induced tumors comprised uniformly small cells and lacked evidence of biliary differentiation, suggesting a more dedifferentiated state.
The concomitant activation of the PI3K–AKT pathway by the introduction of AKT enhanced tumorigenesis but suppressed the expression of the fetal/neonatal genes that were specifically expressed in the HRAS‐induced tumors. Although HRAS/Myc/AKT induced tumors that were diffuse and aggressive within short incubation periods, the mRNA expression levels of Igf2bp3 and H19, which were activated in the HRAS/Myc‐induced tumors, were significantly repressed. Furthermore, Dlk1 mRNA and DLK1 protein expression as well as Sox2 mRNA expression were diminished in HRAS/Myc‐induced tumors when AKT was co‐introduced. Similar suppression of fetal/neonatal protein expression was noted in human HCC tissues in which AKT was phosphorylated. In our previous experiments, mRNA expression of the fetal/neonatal genes found in Myc/YAP‐induced tumors was also suppressed in more aggressive and “poorly differentiated” AKT/Myc/YAP tumors. These results indicate that PI3K–AKT signaling pathway activation suppresses the “dedifferentiated” phenotype of tumor cells but facilitates hepatocarcinogenesis. In the dedifferentiated tumors induced by HRAS and HRAS/Myc, GSK3β was not phosphorylated and thus apparently activated. Suppression of GSK3β activity has been demonstrated to facilitate the hepatocytic differentiation of adipose stem cells.24 Our results also suggest that the aggressiveness of liver tumors with higher cellular or structural atypia might be separable from the degree of dedifferentiation, implying that the general notion that dedifferentiation correlates with higher tumor grades might not always be the case.
Promoter methylation has been shown to regulate the transcription of many fetal genes and stem cell‐associated genes, including Afp,25 Igf2,14, 15 Dlk1,26 and Nanog.27 The hypomethylation of Line1 DNA increased 5hmC levels in the nuclei of tumor cells, and the higher expression levels of Tet1 suggested that a state of global DNA demethylation was present in HRAS‐ and HRAS/Myc‐induced tumors. Our study also demonstrated that the dedifferentiated tumors induced by HRAS and Myc expressed Dnmt mRNA at high levels, suggesting the existence of a dynamic state of active demethylation and methylation. The analyses of the developing livers revealed that the fetal livers showed high levels of mRNA expression of both DNMT and Tet family members, especially at the earlier periods, further highlighting the similarities between the HRAS/Myc‐induced tumors and fetal livers. Our results are compatible with the notion that dynamic DNA demethylation and methylation take place during gametogenesis and early development.28
In contrast to the tumors induced by HRAS and Myc in vivo, the cells transformed by these oncogenes in vitro scarcely expressed fetal/neonatal genes. This was associated with the lack of mRNA expression of DNA methylating and demethylating enzymes, and the 5‐azadC treatment partially restored the fetal/neonatal gene expression. These results suggest that the in vivo microenvironment is necessary for epigenetic alterations. In the normal liver parenchyma, vascular networks exist that are lined by sinusoidal endothelial cells (LYVE1 positive), which are distinct from the usual endothelial cells (CD31 positive). In contrast, liver tumor vessels are typically CD31 positive and LYVE1 negative, corresponding to a switch of vascular supply from the portal system to the arterial system.21 In our study, although most liver tumors contained vessels with CD31‐positive endothelial cells, HRAS‐induced tumors characteristically retained LYVE1‐positive sinusoidal structures, which might imply the occurrence of a hypoxic portal blood supply in these tumors. Cell density is another factor that mediates the hypoxic status in tumors and nuclear hypoxia‐inducible factor‐1α expression,29 and this was particularly higher in HRAS/Myc‐induced tumors with an increased expression of Tet1 mRNA than in the other tumors.
The functional significance of fetal/neonatal gene activation in hepatocarcinogenesis remains unclear. H19 has been implicated in experimental hepatocarcinogenesis as either an oncogene or a tumor suppressor.30, 31 Our study indicates that the loss of H19 as well as the concomitant suppression of Igf2 gene expression did not significantly affect the tumorigenesis induced by HRAS/Myc. We also previously showed that the mRNA expression levels of 15 mouse tumor‐specific fetal/neonatal genes, including H19, Igf2, Afp, and Gpc3, were not correlated with steady‐state tumor cell proliferation itself.2 However, recent evidence has shown that IGF2 might be an epi‐driver in mouse hepatocarcinogenesis that is induced by the transposon‐mediated activation of Myc and AKT.32
High levels of DLK1 gene expression have been documented in a fraction of human hepatoblastoma cases.33 Human hepatoblastoma has been reported to frequently harbor mutations on the β‐catenin gene that stabilize its protein product.34 In mice, the combination of activated β‐catenin and YAP has been shown to generate hepatoblastoma‐like tumors with the spontaneous activation of Myc expression.35 Myc‐induced hepatocarcinogenesis has been reported to be facilitated by the expression of activated β‐catenin, resulting in the generation of DLK1‐positive hepatoblastoma‐like tumors.36 We demonstrated here that the combination of HRAS and Myc also induced dedifferentiated tumors with hepatoblastic features, suggesting that Myc plays an essential role in the reprogramming of hepatocytes toward hepatoblastic cells. Although it has been long argued that the hepatoblastoma‐like subtype of HCC and combined hepatocellular–cholangiocarcinoma could be derived from hepatic stem/progenitor cells,1, 37 our data indicate that even fully matured hepatocytes could be the cells of origin of such tumors through oncogene‐induced transformation and dedifferentiation.
Supporting information
Acknowledgment
We thank Dr. Xi Chen for help with the transfection experiments, Mr. Yoshiyasu Satake for animal care, and Ms. Hiroko Chiba and Ms. Aya Kitano for secretarial assistance.
Supported by the Ministry of Education, Culture, Sports, Science, and Technology of Japan (grants 18590362, 21590426, 24390092, and 15K15107 to Y.N.).
Potential conflict of interest: Nothing to report.
References
Author names in bold designate shared co‐first authorship.
- 1. Lee JS, Heo J, Libbrecht L, Chu IS, Kaposi‐Novak P, Calvisi DF, et al. A novel prognostic subtype of human hepatocellular carcinoma derived from hepatic progenitor cells. Nat Med 2006;12:410‐416. [DOI] [PubMed] [Google Scholar]
- 2. Chen X, Yamamoto M, Fujii K, Nagahama Y, Ooshio T, Xin B, et al. Differential reactivation of fetal/neonatal genes in mouse liver tumors induced in cirrhotic and non‐cirrhotic conditions. Cancer Sci 2015;106:972‐981. [DOI] [PMC free article] [PubMed] [Google Scholar]
- 3. Fujimoto A, Furuta M, Totoki Y, Tsunoda T, Kato M, Shiraishi Y, et al. Whole‐genome mutational landscape and characterization of noncoding and structural mutations in liver cancer. Nat Genet 2016;48:500‐509. Erratum. In: Nat Genet 2016;48:700. [DOI] [PubMed] [Google Scholar]
- 4. Aravalli RN, Steer CJ, Cressman EN. Molecular mechanisms of hepatocellular carcinoma. Hepatology 2008;48:2047‐2063. [DOI] [PubMed] [Google Scholar]
- 5. Zimonjic DB, Popescu NC. Role of DLC1 tumor suppressor gene and MYC oncogene in pathogenesis of human hepatocellular carcinoma: potential prospects for combined targeted therapeutics (review). Int J Oncol 2012;41:393‐406. [DOI] [PMC free article] [PubMed] [Google Scholar]
- 6. Chen X, Calvisi DF. Hydrodynamic transfection for generation of novel mouse models for liver cancer research. Am J Pathol 2014;184:912‐923. [DOI] [PMC free article] [PubMed] [Google Scholar]
- 7. Xin B, Yamamoto M, Fujii K, Ooshio T, Chen X, Okada Y, et al. Critical role of Myc activation in mouse hepatocarcinogenesis induced by the activation of AKT and RAS pathways. Oncogene 2017;36:5087‐5097. [DOI] [PMC free article] [PubMed] [Google Scholar]
- 8. Leighton PA, Ingram RS, Eggenschwiler J, Efstratiadis A, Tilghman SM. Disruption of imprinting caused by deletion of the H19 gene region in mice. Nature 1995;375:34‐39. [DOI] [PubMed] [Google Scholar]
- 9. Yamamoto M, Xin B, Watanabe K, Ooshio T, Fujii K, Chen X, et al. Oncogenic determination of a broad spectrum of phenotypes of hepatocyte‐derived mouse liver tumors. Am J Pathol 2017;187:2711‐2725. [DOI] [PubMed] [Google Scholar]
- 10. Tanimizu N, Nishikawa M, Saito H, Tsujimura T, Miyajima A. Isolation of hepatoblasts based on the expression of Dlk/Pref‐1. J Cell Sci 2003;116:1775‐1786. [DOI] [PubMed] [Google Scholar]
- 11. Reik W. Stability and flexibility of epigenetic gene regulation in mammalian development. Nature 2007;447:425‐432. [DOI] [PubMed] [Google Scholar]
- 12. Lander ES, Linton LM, Birren B, Nusbaum C, Zody MC, Baldwin J, et al. International Human Genome Sequencing Consortium. Initial sequencing and analysis of the human genome. Nature 2001;409:860‐921. Erratum. In: Nature 2001;411:720. Szustakowki, J [corrected to Szustakowski, J]. Nature 2001;412:565.11237011 [Google Scholar]
- 13. Nordin M, Bergman D, Halje M, Engstrom W, Ward A. Epigenetic regulation of the Igf2/H19 gene cluster. Cell Prolif 2014;47:189‐199. [DOI] [PMC free article] [PubMed] [Google Scholar]
- 14. Moore T, Constancia M, Zubair M, Bailleul B, Feil R, Sasaki H, et al. Multiple imprinted sense and antisense transcripts, differential methylation and tandem repeats in a putative imprinting control region upstream of mouse Igf2. Proc Natl Acad Sci U S A 1997;94:12509‐12514. [DOI] [PMC free article] [PubMed] [Google Scholar]
- 15. Weber M, Milligan L, Delalbre A, Antoine E, Brunel C, Cathala G, et al. Extensive tissue‐specific variation of allelic methylation in the Igf2 gene during mouse fetal development: relation to expression and imprinting. Mech Dev 2001;101:133‐141. [DOI] [PubMed] [Google Scholar]
- 16. Fournier C, Goto Y, Ballestar E, Delaval K, Hever AM, Esteller M, et al. Allele‐specific histone lysine methylation marks regulatory regions at imprinted mouse genes. EMBO J 2002;21:6560‐6570. [DOI] [PMC free article] [PubMed] [Google Scholar]
- 17. Leighton PA, Saam JR, Ingram RS, Stewart CL, Tilghman SM. An enhancer deletion affects both H19 and Igf2 expression. Genes Dev 1995;9:2079‐2089. [DOI] [PubMed] [Google Scholar]
- 18. Monnier P, Martinet C, Pontis J, Stancheva I, Ait‐Si‐Ali S, Dandolo L. H19 lncRNA controls gene expression of the Imprinted Gene Network by recruiting MBD1. Proc Natl Acad Sci U S A 2013;110:20693‐20698. [DOI] [PMC free article] [PubMed] [Google Scholar]
- 19. Uysal F, Akkoyunlu G, Ozturk S. Dynamic expression of DNA methyltransferases (DNMTs) in oocytes and early embryos. Biochimie 2015;116:103‐113. [DOI] [PubMed] [Google Scholar]
- 20. Bhutani N, Burns DM, Blau HM. DNA demethylation dynamics. Cell 2011;146:866‐872. [DOI] [PMC free article] [PubMed] [Google Scholar]
- 21. Mouta Carreira C, Nasser SM, di Tomaso E, Padera TP, Boucher Y, Tomarev SI, et al. LYVE‐1 is not restricted to the lymph vessels: expression in normal liver blood sinusoids and down‐regulation in human liver cancer and cirrhosis. Cancer Res 2001;61:8079‐8084. [PubMed] [Google Scholar]
- 22. Bourseau‐Guilmain E, Menard JA, Lindqvist E, Indira Chandran V, Christianson HC, Cerezo Magana M, et al. Hypoxia regulates global membrane protein endocytosis through caveolin‐1 in cancer cells. Nat Commun 2016;7:11371. [DOI] [PMC free article] [PubMed] [Google Scholar]
- 23. Furjelova M, Kovalska M, Jurkova K, Horacek J, Carbolova T, Adamkov M. Carbonic anhydrase IX: a promising diagnostic and prognostic biomarker in breast carcinoma. Acta Histochem 2014;116:89‐93. [DOI] [PubMed] [Google Scholar]
- 24. Huang J, Guo X, Li W, Zhang H. Activation of Wnt/beta‐catenin signalling via GSK3 inhibitors direct differentiation of human adipose stem cells into functional hepatocytes. Sci Rep 2017;7:40716. [DOI] [PMC free article] [PubMed] [Google Scholar]
- 25. Cui X, Liu B, Zheng S, Dong K, Dong R. Genome‐wide analysis of DNA methylation in hepatoblastoma tissues. Oncol Lett 2016;12:1529‐1534. [DOI] [PMC free article] [PubMed] [Google Scholar]
- 26. Huang J, Zhang X, Zhang M, Zhu JD, Zhang YL, Lin Y, et al. Up‐regulation of DLK1 as an imprinted gene could contribute to human hepatocellular carcinoma. Carcinogenesis 2007;28:1094‐1103. [DOI] [PubMed] [Google Scholar]
- 27. Ito S, D'Alessio AC, Taranova OV, Hong K, Sowers LC, Zhang Y. Role of Tet proteins in 5mC to 5hmC conversion, ES‐cell self‐renewal and inner cell mass specification. Nature 2010;466:1129‐1133. [DOI] [PMC free article] [PubMed] [Google Scholar]
- 28. Dean W. DNA methylation and demethylation: a pathway to gametogenesis and development. Mol Reprod Dev 2014;81:113‐125. [DOI] [PubMed] [Google Scholar]
- 29. Sheta EA, Trout H, Gildea JJ, Harding MA, Theodorescu D. Cell density mediated pericellular hypoxia leads to induction of HIF‐1alpha via nitric oxide and Ras/MAP kinase mediated signaling pathways. Oncogene 2001;20:7624‐7634. [DOI] [PubMed] [Google Scholar]
- 30. Matouk IJ, DeGroot N, Mezan S, Ayesh S, Abu‐lail R, Hochberg A, et al. The H19 non‐coding RNA is essential for human tumor growth. PLoS ONE 2007;2:e845. [DOI] [PMC free article] [PubMed] [Google Scholar]
- 31. Yoshimizu T, Miroglio A, Ripoche MA, Gabory A, Vernucci M, Riccio A, et al. The H19 locus acts in vivo as a tumor suppressor. Proc Natl Acad Sci U S A 2008;105:12417‐12422. [DOI] [PMC free article] [PubMed] [Google Scholar]
- 32. Martinez‐Quetglas I, Pinyol R, Dauch D, Torrecilla S, Tovar V, Moeini A, et al. IGF2 is upregulated by epigenetic mechanisms in hepatocellular carcinomas and is an actionable oncogene product in experimental models. Gastroenterology 2016;151:1192‐1205. [DOI] [PubMed] [Google Scholar]
- 33. Luo JH, Ren B, Keryanov S, Tseng GC, Rao UN, Monga SP, et al. Transcriptomic and genomic analysis of human hepatocellular carcinomas and hepatoblastomas. Hepatology 2006;44:1012‐1024. [DOI] [PMC free article] [PubMed] [Google Scholar]
- 34. Koch A, Denkhaus D, Albrecht S, Leuschner I, von Schweinitz D, Pietsch T. Childhood hepatoblastomas frequently carry a mutated degradation targeting box of the beta‐catenin gene. Cancer Res 1999;59:269‐273. [PubMed] [Google Scholar]
- 35. Tao J, Calvisi DF, Ranganathan S, Cigliano A, Zhou L, Singh S, et al. Activation of beta‐catenin and Yap1 in human hepatoblastoma and induction of hepatocarcinogenesis in mice. Gastroenterology 2014;147:690‐701. [DOI] [PMC free article] [PubMed] [Google Scholar]
- 36. Comerford SA, Hinnant EA, Chen Y, Bansal H, Klapproth S, Rakheja D, et al. Hepatoblastoma modeling in mice places Nrf2 within a cancer field established by mutant beta‐catenin. JCI Insight 2016;1:e88549. [DOI] [PMC free article] [PubMed] [Google Scholar]
- 37. Brunt E, Aishima S, Clavien PA, Fowler K, Goodman Z, Gores G, et al. cHCC‐CCA: consensus terminology for primary liver carcinomas with both hepatocytic and cholangiocytic differentation. Hepatology 2018;68:113‐126. [DOI] [PMC free article] [PubMed] [Google Scholar]
Associated Data
This section collects any data citations, data availability statements, or supplementary materials included in this article.
Supplementary Materials


