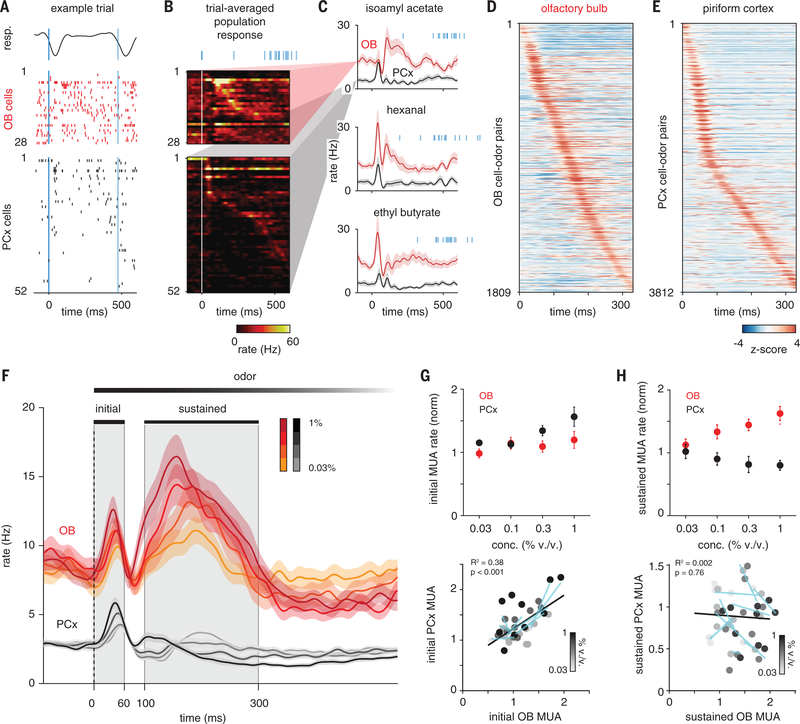
Fig. 2. PCx predominantly responds to early OB inputs.
(A) Example single-trial response to isoamyl acetate (0.3% v/v) in populations of simultaneously recorded OB and PCx cells. Negative-going respiration signal (top) indicates inhalation. Bold blue line marks start of first inhalation after odor onset. Thin blue line marks second inhalation. Cells in each population are sorted by trial-averaged response peak latency. (B) Example trial-averaged peristimulus time histograms (PSTHs) for populations in (A). Blue lines indicate inhalation times on all 15 trials. (C) Average PSTHs for same OB and PCx populations responding to three odors. Shading is SEM across cells. (D) PSTHs for all OB cell-odor pairs sorted by latency to peak show uniform tiling of sniff cycle. (E) Same as (D) but for PCx. Majority of PCx responses occur within 60 ms after inhalation. (F) Average PSTHs for all cell-odor responses at different concentrations (OB, n = 188; PCx, n = 664 cell-odor pairs; mean ± SEM). Gray shading indicates initial (0 to 60 ms) and sustained (100 to 300 ms) analysis windows. Dashed line indicates inhalation onset. (G) Normalized multiunit activity (MUA) rates during initial phase (n = 5 experiments, two odors, four concentrations) in OB versus PCx. MUA is determined by recombining individual cell responses. (Top) Average OB (red) and PCx (black) response across recordings and odors. MUA was normalized to baseline activity 1 s before odor. (Bottom) Each point is the average response of one simultaneously recorded OB-PCx population response pair. Shading indicates concentration. Cyan lines are linear fits across concentrations for each OB-PCx population response pair. Black line is the linear fit to all data. (H) As in (G) but for the sustained phase.

