

Summary
Aims
Nerve growth factor (NGF) eyedrops (ed‐NGF) activate brain neurons, stimulate growth factors, including brain‐derived neurotrophic factor (BDNF), and exert neuroprotection in the forebrain of streptozotocin‐induced diabetic rats (STZ rats). In this study, the effects of ed‐NGF on BDNF signaling in the prefrontal cortex (PFC) were explored in healthy and STZ‐diabetic rats, in which cortical neuronal and axonal loss, and altered circulating BDNF associated with depressive phenotype are also described.
Methods
STZ and healthy (CTR) adult rats received ed‐NGF twice a day for 2 weeks. Depressive phenotype was identified by force swimming test (FST). Proteins extracted from PFC were processed for ELISA and Western blot analyses to measure the expression of BDNF, proBDNF, and their receptors and intracellular signals.
Results
ed‐NGF treatment modulates BDNF pathway in PFC and normalizes the STZ‐induced BDNF alterations by stimulating TRK‐mediated survival mechanism. A decreased latency in FST was also found in STZ rats, while no change was observed comparing CTR + NGF and STZ + NGF with CTR.
Conclusion
The present data confirm the capacity of ed‐NGF treatment to affect brain neurons and lead to brain damage recovery by activating protective and remodeling pathways triggered by BDNF. We suggest that the ed‐NGF‐induced changes in BDNF signaling might influence the manifestation of depressive phenotype in diabetic rats.
Keywords: Depression, Diabetes, NGF eyedrops, p75NTR, TrkB
Introduction
Nerve growth factor (NGF) is an essential neurotrophin acting on both mature and immature neuronal cells during the entire life span 1, 2, exerting neuroprotective/reparative actions in the brain when intracerebrally injected. NGF administered as eyedrops on ocular surface (ed‐NGF) also produces its biological actions on the retina, optic nerve, and primary visual brain areas, as well as on a wide range of forebrain regions, including the frontal and occipital cortex 3. Mature neuronal cells and precursors respond to ed‐NGF treatment, also by producing and/or releasing neurotransmitters, cytokines, growth factors, including the cognate neurotrophin brain‐derived neurotrophic factor (BDNF) in both healthy 4, 5, 6 and pathological conditions 4, 7, 8.
Recently, ed‐NGF has been demonstrated to counteract brain neurodegeneration in a rat model of diabetic encephalopathy induced by streptozotocin (STZ) by stimulating the survival of forebrain cholinergic neurons and neuronal precursors, and activating neurogenesis in the subventricular germinal area 4, 9.
Besides affecting cholinergic areas, STZ is also reported to produce axonal degeneration and demyelination in the cortex of rats as early as 4 weeks after injection 10. Accordingly neuronal cell death in the prefrontal cortex (PFC) is associated with the manifestation of depressive phenotype in STZ mice 11. A correlation between onset of depressive‐like behavior and altered structure and neurotransmission in PFC has also been demonstrated in STZ‐treated mice 12, supporting the observed diabetes and depression comorbidity in patients 13. In this context, this study addresses possible protective effects of ed‐NGF against diabetic encephalopathy rats, with a focus on the neurodegenerative process occurring in PFC.
Specifically, we investigated the relationship between STZ and ed‐NGF effects on PFC levels of molecules involved in BDNF‐regulated pathways. Our working hypothesis is based on the following evidence: (1) BDNF is produced in the PFC and regulates cortical interneuronal activity 14, thus contributing to the modulation of behavioral functions; (2) BDNF plays a critical role in mood disorders, being downregulated in depression, even in association with STZ treatment 11, 15, 16; (3) BDNF is upregulated following antidepressant treatment 17, 18. Importantly, altered BDNF signaling is associated with neuronal death in knockout animal models 19, and in neurodegenerative diseases 17, 20, and BDNF is suggested as a precipitating disease marker in diabetes 21. Whether STZ‐induced diabetes might affect BDNF and BDNF‐mediated intracellular signaling in PFC is presently unknown.
This study analyzes BDNF signaling in the PFC of healthy and diabetic rats receiving or not ed‐NGF, and its correlation with the manifestation of depressive phenotype. Confirming our previous observations 4, we here report that ed‐NGF treatment counteracts STZ‐induced activation of the apoptotic process, while stimulating TRK‐mediated survival mechanisms in the brain.
Materials and Methods
Animals, Disease Induction, and ed‐NGF Treatment
A total of 30 Sprague Dawley adult male rats (body weight 200–250 g) were used in this study. Diabetes was induced by an intraperitoneal injection of streptozotocin (60 mg/kg; Sigma‐Aldrich, St. Louis, MO, USA), and control (CTR) rats received an injection with physiological solution. Rats were allowed to drink a 10% dextrose solution overnight. The glucose level in blood was evaluated at day 0 (before intraperitoneal injection of STZ or vehicle) and after STZ injection by glucometer (Contour XT, Bayer, Germany). Rats with blood glucose levels above 250 mg/dL were diagnosed as diabetic and included in the experiment to evaluate the effects of diabetes and/or ocular NGF treatment.
Nerve growth factor was isolated from male mouse submaxillary salivary glands and purified by a protocol based on the method described by Bocchini and Angeletti 22. Purified NGF dissolved in a physiological solution (0.9% sodium chloride) at a concentration of 200 μg/mL was used during treatment.
Rats were divided into four experimental groups: the STZ + NGF group, including diabetic rats, received two drops (10 μL each) of 200 μg/mL NGF as eyedrops to both eyes; the diabetic rat group (STZ) received two drops of physiological solution per eye; healthy control groups named CTR and CTR + NGF received ocular treatment with saline and ed‐NGF, respectively. Ocular treatment started 6 weeks after diabetes induction and was repeated twice a day for 2 weeks. All rats were sacrificed previa anesthesia at 8 weeks days postinduction (dpi) by decapitation.
During the whole of experimental period, the rats were maintained on a 12‐h light–dark cycle and provided with food and water ad libitum. For the housing, care, and experimental procedures, the guidelines indicated and approved by intramural Committee and Institutional Guidelines of the Italian National research Council in conformity with National and International laws (EEC Council Directive 86/609, OJ L 358, 1, 12 December 1987) were followed. Further, the ocular procedures were in accordance with the ARVO Statement for the Use of Animals in Ophthalmic and Vision Research, and all efforts were taken to limit the number of rats.
Diabetes Effects on Body Weight and Depressive Phenotypes
Body weight (BW) was measured weekly from day 0 and at the end of the experiment (8 weeks dpi). As reported, diabetic rats at eighth weeks after STZ induction show a depressive phenotype 11 evaluated by forced swimming test (FST), which is one widely used assay to assess antidepressant efficacy in preclinical studies 23. FST immobility was therefore measured in the experimental condition following the previously described procedure. Briefly, the test was performed by introducing the rats into a glass cylinder with a height of 60 cm, diameter of 30 cm, water depth of 50 cm (to ensure that the adult rats were unable reach the bottom with their tails, to keep their noses above the water), and temperature of 25°C. Immobility time was considered as rats floating passively, making small movements to keep their heads above the water level 24, 25. The development of depressive/anxiety behavior was measured by the latency for the first floating episode and immobility time (minutes). A 9‐min swimming test session was carried out during the light phase of the light/dark cycle. Animals were tested under indirect dim light. At the end of each session, animals were towel‐dried and then transferred into a heated chamber (37 ± 1°C) for a 15‐min warm‐up period.
Brain Dissection and Protein Extraction for Biochemical Analysis
The neurodegenerative effect of STZ in PFC was confirmed using histological and immunofluorescent staining techniques in a preliminary study. As reported previously 12, altered distribution of neuronal cells was observed in the cingulate cortex (Cg1) and motor cortex (M1) of STZ rats (Figure 1D–F) when compared to the healthy rats (Figure 1A–C). The loss of neurons was confirmed by the reduction in cells expressing NeuN in almost all the cortical layers of STZ rats (Figure 1I) with respect to CTR rats (Figure 1G), but more in layers II and III, where the presence of cleaved caspase‐3 was also found (Figure 1M,N). Cells expressing glutamic acid decarboxylase 67 (GAD67) in the V‐VI layers were also affected in STZ PFC (Figure 1L), compared with CTR (Figure 1H) as also demonstrated an increased colocalization of GAD67 and cleaved caspase‐3 (Figure 1O,P,P'). Based on these data, the PFC area was selected to evaluate the effects of STZ and ed‐NGF treatment on the BDNF signaling‐mediated survival and/death and involved in the regulation of depressive phenotype. Six rats per group were deeply anesthetized with an overdose of ketamine and xylazine and sacrificed by decapitation. The PFC was quickly dissected on ice and stored in clean and sterile tubes at −80°C until use. To extract proteins, the tissue samples were homogenized by ultrasonication in RIPA buffer (50 mM Tris–HCl, pH 7.4; 150 mM NaCl; 5 mM EDTA; 1% Triton X‐100; 0.1% SDS; 0.5% sodium deoxycholate; 1 mM PMSF; 1 mg/mL leupeptin), kept in a cold room on a rotary shaker for 2 h to allow the complete tissue disaggregation and cell lysis, and then centrifuged at 10,000 g for 30 min at 4°C. The supernatants were used for total protein concentration measured by the Bio‐Rad assay, and ELISA and Western blot analysis, as described below.
Figure 1.
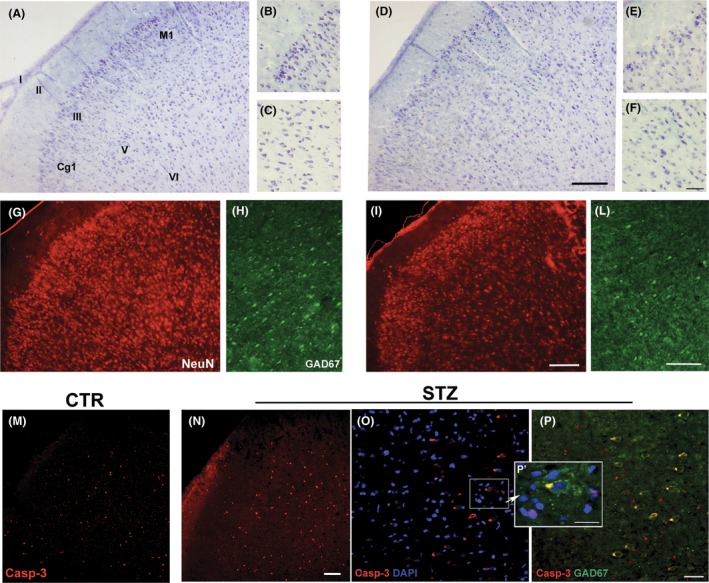
(A–P) Histological and immunohistochemical evidences of the STZ‐induced neuronal alterations in PFC. Cell loss is observed in the cingulate cortex (Cg1) and motor cortex (M1) of STZ rats (D–F) when compared to the healthy rats (A–C). Altered distribution of cells expressing NeuN is found the all the cortical layers of STZ rats (I) respect to CTR rats (G). Compared with CTR (H), STZ also affected the expression of Gad67 in the V‐VI layers of PFC (L). Stain for cleaved caspase‐3 (Casp‐3) in the Cg1 and M1 areas of CTR and STZ PFC is shown in figures M and N, respectively. Magnifications in figure O, P, and P' (Scale bars: 20 μm) confirm the presence of apoptosis in both GAD67 cells (yellow stain), and in no GABAergic small cells in the PFC of diabetic rats. Scale bars: 50 μm; antibodies used: mouse anti‐neuronal nuclei (NeuN) monoclonal antibody (MAB377, Chemicon International, Temecula‐CA, USA), mouse monoclonal anti‐GAD67 (Clone 1G10.2) antibody (Millipore corporation,), rabbit polyclonal cleaved‐caspase3 (Asp 175) antibody (#9661, Cell Signaling Technology, Inc).
Western Blot Analysis
Prefrontal cortex samples prepared as described previously were utilized for Western blotting (WB) analysis. Specifically, 20 or 40 μg of total proteins were dissolved in loading buffer (0.1 M Tris–HCl buffer, pH 6.8, containing 0.2 M dithiothreitol, DTT, 4% sodium dodecyl phosphate, SDS, 20% glycerol and 0.1% bromophenol blue), separated by 8% or 12% SDS‐PAGE, and electrophoretically transferred to polyvinylidene difluoride (PVDF) or nitrocellulose membranes. The membranes were incubated for 1 h at room temperature (RT) with blocking buffer constituted by 5% Bovine serum albumin (BSA) or 5% nonfat dry milk in TBS‐T (10 mM Tris, pH 7.5, 100 mM NaCl, and 0.1% Tween‐20) and washed three times for 10 min each at RT in TBS‐T followed by incubation overnight at 4°C. Samples were exposed to the following primary antibodies rabbit polyclonal anti‐TrkB (1:1000, sc‐12, Santa Cruz Biotechnology, Santa Cruz, CA, USA), rabbit polyclonal anti‐proBDNF (1:1000, Millipore corporation, Temecula‐CA, USA), rabbit polyclonal anti‐p75 (1:1000, sc‐8317, Santa Cruz Biotechnology), rabbit polyclonal anti‐Akt antibody (1:1000, #9272, Cell Signaling Technology, Inc, Danvers, MA, USA), rabbit polyclonal phospho‐Akt (Ser473) antibody (1:1000, #9271, Cell Signaling Technology, Inc), rabbit polyclonal anti‐stress‐activated protein kinase/Jun‐N‐terminal Kinase (SAPK/JNK) antibody (1:100, #9252, Cell Signaling Technology, Inc), rabbit polyclonal anti‐phospho‐SAPK/JNK (Thr183/Tyr185) antibody (1:1000, #9251, Cell Signaling Technology, Inc), rabbit polyclonal anti‐caspase3 antibody (1:1000, sc‐7148, Santa Cruz Biotechnology), and mouse anti‐polysialic acid‐NCAM (PSA‐NCAM) monoclonal antibody (1:1000, Millipore corporation). These steps were followed by incubation for 1 h with 1:10,000 or 1:2000 goat anti‐rabbit immunoglobulin (Ig) G coupled or anti‐mouse IgG (Cell Signaling Technology).
Immunoblot analyses were performed using a chemiluminescence detection kit (ECL) as the chromophore (Millipore, MA, USA). Relative levels of immunoreactivity were determined using densitometry and the software ImageJ (National Institutes of Health, Bethesda, MD, USA) for Windows 10. Each reported value was derived from the ratio between arbitrary units obtained by the protein band and the respective glyceraldehyde‐3‐phosphate dehydrogenase (GAPDH) (chosen as housekeeping protein). Values are expressed as arbitrary OD units, and the data are presented as means ± SD.
Immunoenzymatic Activity (ELISA)
The brain concentration of BDNF was measured using an ELISA kit (BDNF EmaxTM ImmunoAssay System G7611, Promega, Madison, WI, USA) following the protocol supplied by the manufacturer. The colorimetric reaction product was measured at 450 nm using a microplate reader (Thermo Scientific Multiskan EX, Waltham, MA, USA). Each test was performed in duplicate, and the data are expressed as picograms per milligram (pg/mg) of protein and presented as mean ± SD.
The phospho‐TrkB brain levels were measured using PathScan Phospho‐TrkB (Tyr516) Sandwich ELISA Kit (#7111C, Cell Signaling Technology, Inc) following the protocol supplied by the manufacturer. The colorimetric reaction product was measured at 450 nm using a microplate reader (Thermo Scientific Multiskan EX). Values are expressed as arbitrary OD units, and the data are presented as means ± SD.
Statistical Analysis
ELISA and WB experiments were evaluated using GraphPad Prism 5 software, and statistical analysis was conducted using one‐way ANOVA. Differences between CTR, CTR + NGF, STZ, STZ + NGF groups were determined by the Tukey–Kramer multicomparison post hoc test. Means from independent experiments were then expressed as means ± SD. For all statistical analysis, values P < 0.05 or less were considered statistically significant.
Post hoc tests: a P < 0.05 b P < 0.01 vs. CTR; c P < 0.05 and d P < 0.01 vs. CTR + NGF; e P < 0.05, and f P < 0.01 vs. STZ.
Results
General Observations of STZ Effects
Compared with the other groups, a significant body weight reduction, reaching about 20% at the end of the experiment, was observed in STZ rats. The ANOVA showed a significant effect of treatments on the body weight. The post hoc analysis confirmed the significant reduction in body weight in STZ rats starting from 5 weeks dpi, while a recovery was observed following ed‐NGF treatment (P = 0.05; Figure 2A). In healthy rats, no significant effect of ed‐NGF on body weight was found.
Figure 2.
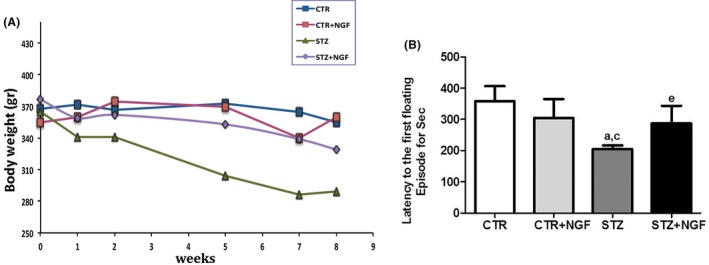
(A–B) Effects of STZ and ed‐NGF on body weight (A) and on first floating latency by forced swim test (B). Statistically significant changes: a P < 0.05 versus CTR; c P < 0.05 versus CTR + NGF; e P < 0.05 versus STZ.
Concerning the effects of treatment on mood, a multicomparative analysis shows that diabetes induces a depressive phenotype, which is partially recovered by treatment with ed‐NGF. Indeed, a significant reduction in first floating latency during FST in STZ group compared with healthy controls was found (Figure 2B; P < 0.05 vs. CTR and CTR + NGF). A significant increase in latency time was observed in STZ + NGF animals when compared to the STZ group. Indeed, while STZ rats showed about 2‐min latency, ed‐NGF group displayed immobilization after 3‐min latency time (P < 0.05). No significant differences were observed between STZ + NGF and CTR or CTR + NGF (Figure 2B).
Effect of STZ and/or ed‐NGF on BDNF and its Receptors in Rat PFC
ELISA and WB were used to analyze the expression levels in PFC of BDNF and proBDNF, respectively. Unchanged BDNF levels were found comparing healthy and STZ rats, even when receiving NGF treatment (Figure 3A). At variance, WB analysis shows about a twofold increase in proBDNF in the PFC of STZ when compared to CTR (P < 0.05) and STZ + NGF (P < 0.05). Levels of proBDNF in CTR + NGF were similar to controls (Figure 3B).
Figure 3.
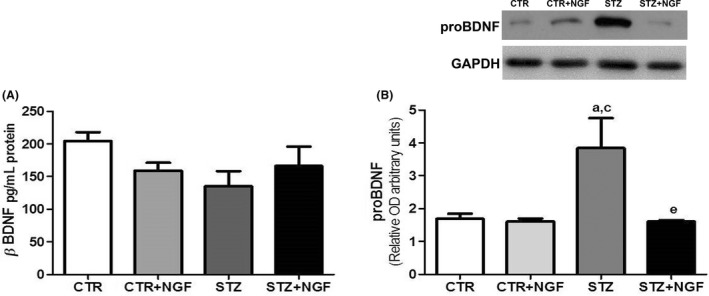
(A–B) The effects of diabetes and ed‐NGF on the BDNF (A) and proBDNF (B) content in prefrontal cortex analyzed by ELISA and Western blot, respectively. A representative WB is showed in the upper side of B. Statistically significant changes: a P < 0.05 versus CTR; c P < 0.05 versus CTR + NGF; e P < 0.05 versus STZ.
As to BDNF receptors, STZ and NGF significantly affect the expression of both p75NTR and TrkB. As shown in Figure 4A, diabetic rats show increased p75NTR and decreased TrkB expression levels, while treatment with ed‐NGF results in normalization of STZ‐induced changes. A significant increase in p75NTR mean values was also found in healthy rats receiving treatment with ed‐NGF when compared to respective controls. As far as TrkB expression is concerned, treatment with ed‐NGF enhanced its levels in both CTR (P < 0.01) and STZ rats (P < 0.05), while a reduction was found in the PFC of diabetic rats (Figure 4B).
Figure 4.
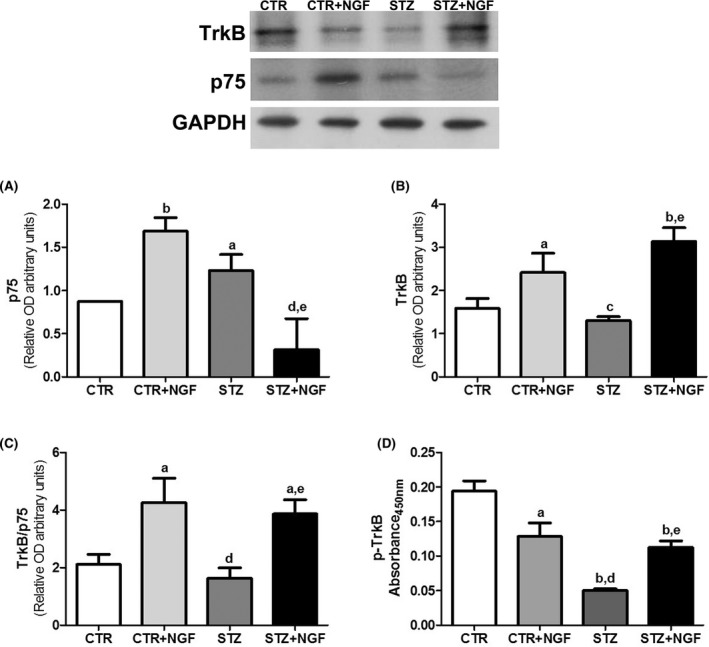
(A–D) Expression of p75NTR and TrkB in prefrontal cortex of CTR and STZ rats with or without ed‐NGF treatment, analyzed by Western blot, is shown in A and B, respectively. The figure on upper side shows the representative Western blots for the two NGF receptors. C reports the graph of TrkB and p75NTR ratio in the PFC of the different rat groups. The p‐TrkB levels were measured by ELISA, and results are shown in D. Statistically significant changes: a P < 0.05 b P < 0.01 versus CTR; c P < 0.05 and d P < 0.01 versus CTR + NGF; e P < 0.05 and versus STZ.
The evaluation of the individual TrkB/p75NTR expression ratio confirms the different effects of diabetes and ed‐NGF showing that STZ induces unbalanced BDNF receptor expression, favoring the p75NTR. A different trend is observed in healthy and STZ rats receiving ed‐NGF in which the ratio between the two BDNF receptor types is enhanced (Figure 4C).
To analyze TrkB activation, its phosphorylation levels were measured by ELISA. Multicomparative analysis shows that p‐TrkB is decreased in STZ (P < 0.01), and in both CTR and STZ rats receiving ed‐NGF (P < 0.05 and P < 0.01, respectively) compared with healthy control rats. A significant increase (P < 0.05) was found in p‐TrkB level in the PFC of STZ + NGF rats when compared to STZ (Figure 4D).
Correlation between FST Latency and BDNF
A simple regression analysis was performed to identify possible correlation between the manifestation of depression mood and changes in the expression of BDNF and its receptors. No significant correlation was found between the latency time (dependent variable) and the expression levels of BDNF, p75NTR, and TrkB (data not shown), while proBDNF and p‐TrkB resulted correlated significantly with this FST parameter.
More precisely, inverse (proBDNF) and direct (p‐TrkB) correlation with the FST immobilization time measured in the experimental adult rats was found (Figure 5A,B). Similarly, when the depression phenotype is manifested, the levels of proBDNF and p‐TrkB are increased and decreased, respectively.
Figure 5.
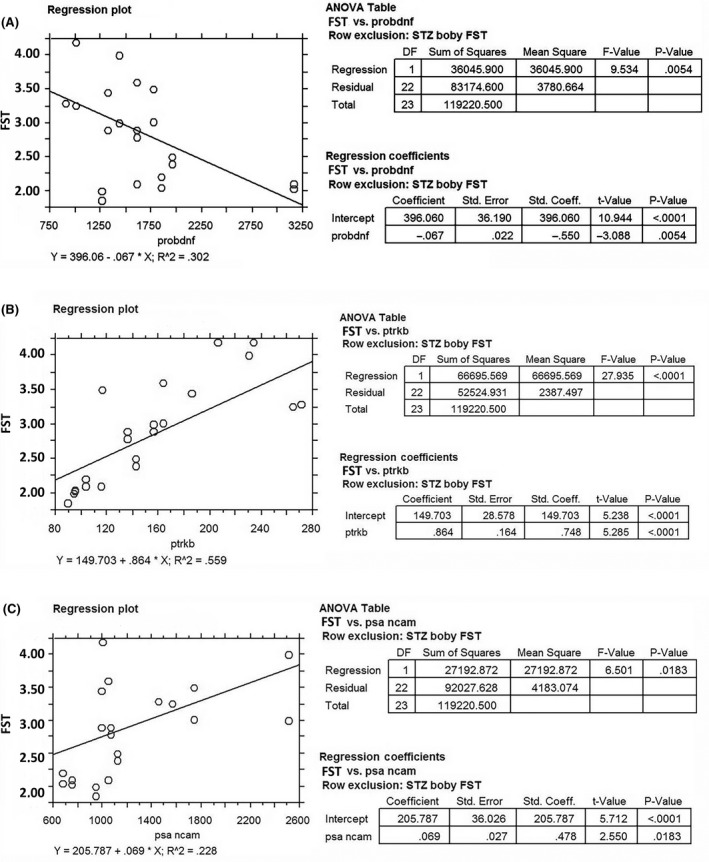
(A–C) Correlation between FST immobilization time and the PFC expression of proBDNF (A), p‐TrkB levels (B), and PSA‐NCAM (C). Both p‐TrkB levels and PSA‐NCAM are positively correlated with the FST immobilization time (P < 0.01), while a negative correlation was found for proBDNF (P = 0.0054).
Effects of STZ and ed‐NGF on the Expression of PSA‐NCAM and its Correlation with FST
As prefrontal cortex neurons express PSA‐NCAM and regulate neuronal plasticity 26 and are involved in cortical remodeling in pathological conditions 27, the effects of STZ and ed‐NGF treatment on the PSA‐NCAM expression levels in PFC were investigated.
Significant decrease in PSA‐NCAM levels was found in STZ PFC when compared to healthy control rats (CTR = 1.338 ± 0.2666; STZ = 0.7885 ± 0.1254; P < 0.05) and rats receiving treatment with ed‐NGF (CTR + NGF = 1.539 ± 0.7494 and STZ + NGF =1.282 ± 0.3531; P < 0.05). By contrast, no significant differences were found comparing CTR + NGF and STZ + NGF with the levels measured in control healthy rats indicating that treatment with ed‐NGF recover the STZ‐induced alteration in PSA‐NCAM expression. In addition, we found that the expression levels of PSA‐NCAM in PFC correlate positively with the latency FST time (Figure 5C), indicating that rats with a disturbed behavior also express high levels of this adhesion molecule.
Effects of STZ and NGF on BDNF Intracellular Signals
As BDNF/proBDNF binding to TrkB or p75NTR activates different intracellular pathways, WB analysis was used to measure the effects of STZ and NGF on the expression levels and phosphorylation of two major downstream signaling molecules, namely Akt and SAPK/JNK (Figure 6).
Figure 6.
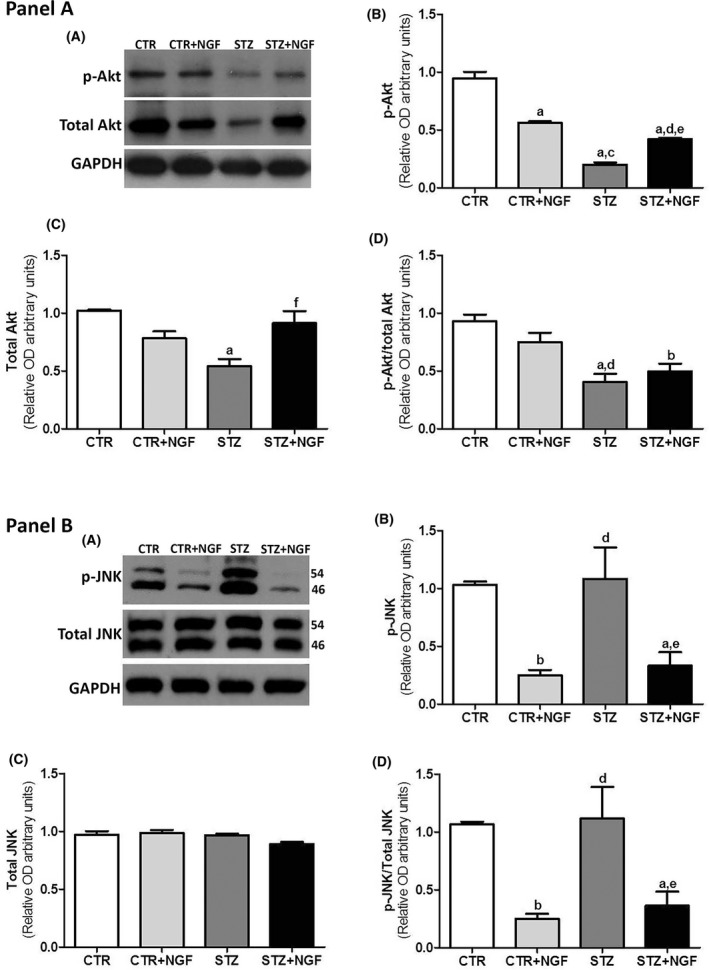
In the Panel A, the effects of diabetes and ed‐NGF treatment on the expression levels of p‐Akt and Akt are shown in the representative Western blot (A) and graph (B–D). The ratio between phospho‐Akt and total Akt protein expression is shown in the graph of D. Panel B. The representative Western blot image of JNK is shown in A. The electrophoresis shows two bands at 46 kDa and 54 kDa correspond to the JNK1 isoform, and the unseparated JNK2 and three isoforms, respectively, in their phosphorylated and no phosphorylated status. The WB quantification analyses of the p‐JNK and total JNK in PFC in the different rat groups are reported in the graphs of B and C. The ratio between p‐JNK and total JNK protein expression is shown in the graph of D. Statistically significant changes: a P < 0.05 and b P < 0.01 versus CTR; c P < 0.05 and d P < 0.01 versus CTR + NGF; e P < 0.05 and f P < 0.01 versus STZ.
Compared with CTR, a decrease of about 80% of phosphorylated Akt (p‐Akt) levels was found in STZ PFC, but a significant reduction was also found in CTR + NGF (about 50%) and STZ + NGF (about 45%; Figure 6B, Panel A). When the relative individual ratio of p‐Akt/total Akt was considered, a significant decrease was found in both STZ and STZ + NGF, but not in CTR + NGF (Figure 6D, Panel A).
Moreover, STZ rats showed no significant variation of phosphorylated JNK (p‐JNK) levels when compared to CTR, while treatment with ed‐NGF in healthy and diabetic rats (CTR + NGF and STZ + NGF) caused a significant decrease in p‐JNK levels (P < 0.01; Figure 6B, Panel B). No changes were found in the levels of total JNK (Figure 6C, Panel B), and thus, the p‐JNK/JNK ratio confirms the effects of STZ and ed‐NGF on the phosphorylation levels of both JNK isoforms (46 kDa and p54).
The caspase‐3 expression level was significantly higher in STZ‐treated rats (STZ = 1.242 ± 0.14 relative OD450 ± SD; P < 0.01) compared with CTR (=0.946 ± 0.052) and STZ + NGF =0.618 ± 0.168; P < 0.01. No significant changes were found in CTR + NGF (=0.782 ± 0.123) and STZ + NGF when compared with CTR group.
Discussion
This study investigated the effects of diabetes and/or ed‐NGF treatment on the expression level of BDNF and its receptors in PFC using STZ‐induced diabetes in adult male rats as the experimental model. The data presented herein confirm that ed‐NGF exerts effects in the pathological brain and suggest a potential mechanism of action of ed‐NGF treatment by demonstrating the modulation of BDNF signaling in prefrontal cortex and the recovery of STZ‐induced FST immobilization time.
Altered expression of BDNF and its receptors and neuronal damage and plasticity have been described in the prefrontal cortex and correlated with the emergence of behavioral and mood disturbances in patients and animal models of neurodegenerative diseases 28. Similar to that which occurs in patients 29, reduced levels of BDNF are found in the serum of STZ rats 30, but whether diabetes also induces alteration in BDNF in PFC has not been fully investigated previously.
In line with previous studies 12, we found that STZ induces a loss on neurons in all the layers of the prefrontal Cg1 and M1 areas. Increased expression of cleaved caspase‐3 was found in the same areas, and in GAD67‐positive neurons in V‐VI layers. The preliminary histological observations were confirmed by the Western blot analysis, which showed increased levels of proBDNF and p75NTR and enhanced caspase‐3, in the prefrontal cortex of STZ rats. Phosphorylation of TrkB and Akt was also reduced, suggesting that apoptotic signals are favored in STZ PFC with respect to the TrkB‐mediated survival pathway. A similar scenario is reported in other neurodegenerative diseases 31, stress condition, and depression 28, which are associated with neuronal death and axonal degeneration, and/or altered plasticity. The evidence that inhibition of proBDNF 32 or infusion of TrkB agonists 33, 34 might reverse the neurodegenerative process in animal models further supports the concept that an unbalance between BDNF maturation and TrkB/p75NTR expression is trigger event of apoptosis in the brain.
In our experimental conditions, we also found that ed‐NGF treatment normalizes the STZ‐induced alteration in PFC by increasing the TrkB/p75NTR ratio and TrkB phosphorylation, and reducing the levels of proBDNF. No variation caspase‐3 was found in PFC of STZ + NGF rats when compared to healthy controls indicating that ed‐NGF treatment counteracts the STZ‐induced activation of the apoptotic pathway. In this context, it is worth noting that the phospho‐JNK level was not significantly altered in STZ PFC, while it is decreased in both CTR and STZ rats receiving treatment with ed‐NGF. As the increase and cleavage of caspase‐3 occurs in STZ but not in rats receiving ed‐NGF, it is reasonable that treatment with NGF does not induce apoptotic pathways in PFC, and suggests other mechanisms and intracellular pathways underlying neuroprotection in the STZ brain.
The JNK pathway plays different roles, regulating neuronal survival and maintenance in both developing and adult brain, and thus influences animal behavior and metabolism 35. Recently, JNK activation in microglia, endothelial cells, and neuronal progenitors has been indicated as a key event during neuroinflammation and blood–brain barrier (BBB) degeneration 36. In addition, different studies demonstrate the survival effect of the nuclear factor kappa‐light‐chain enhancer of activated B cells (NF‐κB) in mediating suppression of JNK cascade during inflammation, also occurring in diabetic brain 37.
Inflammation, BBB damage and microvascular integrity, and permeability are indicated as the causes of neurodegeneration in diabetic encephalopathy, and in turn of neurobehavioral deficits observable in both insulin‐dependent and independent diabetes 38. Dysregulation of glia and endothelial cells, and increased proinflammatory cytokines (TNF‐α, IL‐6, IL‐1, IL‐4), and oxidative stress markers, and Ros pathways 39 are reported in the STZ brain, followed by the activation of NF‐κB. Reduction in caspase‐3 in STZ brain areas, including the hippocampus and the cortex, and amelioration of behavioral impairment are associated with reduced proinflammatory cytokines, and NF‐κB activation, and increased antiinflammatory cytokines such as IL‐10 and CREB phosphorylation 40, 41, supporting the role of inflammation in diabetes‐induced neurodegeneration and neurobehavioral alterations.
Both BDNF and NGF are able to modulate inflammatory mediators in the brain 42, and NGF has been shown to exert antiinflammatory actions in vivo and in vitro by suppressing the inflammatory cascade and/or activating antiinflammatory mechanisms, including the production of IL‐10 43. Recently, we reported that treatment with ed‐NGF in an animal model of brain inflammation reduces the sign of inflammation, and the levels of proinflammatory chemokines and cytokines, as well as of endothelial markers in the brain 8, further supporting the ability of NGF to counteract inflammatory‐mediated neurodegeneration in vivo 42.
Whether the effect of ed‐NGF treatment on BDNF and intracellular signals is associated with reduced inflammation and/or modulation NF‐κB/CREB pathways in PFC, and which cell types are involved in this process were not addressed questions in the present study and remain to be determined. Indeed, cells other than neurones, including astrocytes, microglia, and oligodendrocytes, as well as nonneuronal cells which express TrkA/B and p75NTR 44, might be affected by the STZ‐induced neurotrophin receptor unbalance in PFC, and therefore respond to ed‐NGF treatment. Morphological and molecular aspects of ed‐NGF's actions in adult PFC in both healthy and diabetic conditions are currently under investigation in our laboratory.
Although the intracellular mechanism of action of ed‐NGF needs to be better understood, our data are in line with the hypothesis that the depressive phenotype in diabetes correlates with neuronal dysfunction in the PFC, and altered BDNF signaling 11. The fact that ed‐NGF treatment was effective in suppressing the depressive phenotype in diabetic animals but did not alter this specific behavioral response in healthy rats, as previously reported 4, supports the lack of neurodegeneration in the PFC of CTR + NGF.
Further, the findings that PSA‐NCAM was increased only in STZ rats receiving ed‐NGF but not in CTR + NGF and that the increased latency time in STZ rats is correlated with high levels of proBDNF, but low phosphorylation of TrkB and PSA‐NCAM expression, also suggest a different effect of ed‐NGF treatment in healthy and diabetic PFC.
PSA‐NCAM has been reported in PFC neurons 45 and demonstrated to be involved in neuronal plasticity activated by depression 27, 43, and antidepressants 46. The presence of PSA‐NCAM in neurons potentiates the BDNF action and TrkB phosphorylation, while the loss of the PSA tail of NCAM results in a decreased level of TrkB phosphorylation, suggesting that PSA‐NCAM could interfere with early events in the BDNF signaling cascade 47, 48. Based on these data, our finding that ed‐NGF induces the TrkB phosphorylation and increases PSA‐NCAM in PFC indicates that the activation of neuronal plasticity might also contribute to compensate the STZ‐induced brain and behavioral alterations.
BDNF is involved in the etiopathology of depression by activating several intracellular pathways including inositol triphosphate kinase (PI3) through its high‐affinity receptor, TrkB 49, and antidepressants show neuroprotective and modulatory actions by stimulating TrkB phosphorylation, while on the contrary, proBDNF through p75NTR signaling would be prodepressant 50. PI3 kinase is also necessary to PSA‐NCAM‐induced neuronal growth and plasticity, as well as survival 51. The possibility that the IP3 pathway is activated in the PFC of STZ rats and/or by treatment with ed‐NGF is currently under investigation in our laboratory.
In conclusion, the present study, for the first time, demonstrates the effects of both STZ and ed‐NGF on BDNF signaling in the PFC and their correlation with the diabetes induced manifestation of a depressive phenotype in adults. Although the possibility that prolonged time of treatment or increased dosage might produce adverse effects in both healthy and pathological conditions cannot be ruled out, the present study supports previous observations demonstrating the safety of ed‐NGF treatment in healthy humans 52, and its efficacy in model of neurodegeneration 4, 8. We also feel that the findings reported herein might be useful for the design of future studies addressed to better understand the role of neurotrophins in the mechanisms at the base of comorbidity between mood disorders and diabetes.
Conflict of Interest
The authors declare no conflict of interest.
Acknowledgments
This study was supported by grants to Paola Tirassa in collaboration with Prof. Alessandro Lambiase associated with the project “Effects of Ocular Nerve Growth Factor in animal models of retina and brain neurodegeneration” and sponsorized by the Italian Ministry of Health and Ministry of Education, Universities and Research. Pamela Rosso is recipient of the CNR fellowship founded by Paola Tirassa's grant.
References
- 1. Sofroniew MV, Howe CL, Mobley WC. Nerve growth factor signaling, neuroprotection, and neural repair. Annu Rev Neurosci 2001;24:1217–1281. [DOI] [PubMed] [Google Scholar]
- 2. Chao MV, Hempstead BL. p75 and Trk: A two‐receptor system. Trends Neurosci 1995;18:321–326. [PubMed] [Google Scholar]
- 3. Calza A, Florenzano F, Pellegrini D, Tirassa P. Time‐dependent activation of c‐fos in limbic brain areas by ocular administration of nerve growth factor in adult rats. J Ocul Pharmacol Ther 2011;27:209–218. [DOI] [PubMed] [Google Scholar]
- 4. Tirassa P, Maccarone M, Florenzano F, Cartolano S, De Nicolo S. Vascular and neuronal protection induced by the ocular administration of nerve growth factor in diabetic‐induced rat encephalopathy. CNS Neurosci Ther 2013;19:307–318. [DOI] [PMC free article] [PubMed] [Google Scholar]
- 5. Lambiase A, Mantelli F, Sacchetti M, Rahimi S, Massaro‐Giordano G. Rare diseases of the anterior segment of the eye: Update on diagnosis and management. Biomed Res Int 2015;2015:947326. [DOI] [PMC free article] [PubMed] [Google Scholar]
- 6. Tirassa P. The nerve growth factor administrated as eye drops activates mature and precursor cells in subventricular zone of adult rats. Arch Ital Biol 2011;149:205–213. [DOI] [PubMed] [Google Scholar]
- 7. Di Fausto V, Fiore M, Tirassa P, Lambiase A, Aloe L. Eye drop NGF administration promotes the recovery of chemically injured cholinergic neurons of adult mouse forebrain. Eur J Neurosci 2007;26:2473–2480. [DOI] [PubMed] [Google Scholar]
- 8. Carito V, Nicolo S, Fiore M, Maccarone M, Tirassa P. Ocular nerve growth factor administration (oNGF) affects disease severity and inflammatory response in the brain of rats with experimental allergic encephalitis (EAE). Can J Physiol Pharmacol 2015;29:1–8. [DOI] [PubMed] [Google Scholar]
- 9. Tirassa P, Maccarone M, Carito V, De Nicolo S, Fiore M. Ocular nerve growth factor administration counteracts the impairment of neural precursor cell viability and differentiation in the brain subventricular area of rats with streptozotocin‐induced diabetes. Eur J Neurosci 2015;41:1207–1218. [DOI] [PubMed] [Google Scholar]
- 10. Huang M, Gao L, Yang L, Lin F, Lei H. Abnormalities in the brain of streptozotocin‐induced type 1 diabetic rats revealed by diffusion tensor imaging. Neuroimage Clin 2012;1:57–65. [DOI] [PMC free article] [PubMed] [Google Scholar]
- 11. Chen C, Wang Y, Zhang J, Ma L, Gu J, Ho G. Contribution of neural cell death to depressive phenotypes of streptozotocin‐induced diabetic mice. Dis Model Mech 2014;7:723–730. [DOI] [PMC free article] [PubMed] [Google Scholar]
- 12. Castillo‐Gomez E, Coviello S, Perez‐Rando M, et al. Streptozotocin diabetic mice display depressive‐like behavior and alterations in the structure, neurotransmission and plasticity of medial prefrontal cortex interneurons. Brain Res Bull 2015;116:45–56. [DOI] [PubMed] [Google Scholar]
- 13. Katon WJ. The comorbidity of diabetes mellitus and depression. Am J Med 2008;121(11 Suppl 2):S8–S15. [DOI] [PMC free article] [PubMed] [Google Scholar]
- 14. Woo NH, Lu B. Regulation of cortical interneurons by neurotrophins: From development to cognitive disorders. Neuroscientist 2006;12:43–56. [DOI] [PubMed] [Google Scholar]
- 15. Hashimoto K, Shimizu E, Iyo M. Critical role of brain‐derived neurotrophic factor in mood disorders. Brain Res Brain Res Rev 2004;45:104–114. [DOI] [PubMed] [Google Scholar]
- 16. Dwivedi Y. Involvement of brain‐derived neurotrophic factor in late‐life depression. Am J Geriatr Psychiatry 2013;21:433–449. [DOI] [PMC free article] [PubMed] [Google Scholar]
- 17. Castren E, Voikar V, Rantamaki T. Role of neurotrophic factors in depression. Curr Opin Pharmacol 2007;7:18–21. [DOI] [PubMed] [Google Scholar]
- 18. Duman RS, Monteggia LM. A neurotrophic model for stress‐related mood disorders. Biol Psychiatry 2006;59:1116–1127. [DOI] [PubMed] [Google Scholar]
- 19. Neto FL, Borges G, Torres‐Sanchez S, Mico JA, Berrocoso E. Neurotrophins role in depression neurobiology: A review of basic and clinical evidence. Curr Neuropharmacol 2012;9:530–552. [DOI] [PMC free article] [PubMed] [Google Scholar]
- 20. Lu B, Pang PT, Woo NH. The yin and yang of neurotrophin action. Nat Rev Neurosci 2005;6:603–614. [DOI] [PubMed] [Google Scholar]
- 21. Bathina S, Das UN. Brain‐derived neurotrophic factor and its clinical implications. Arch Med Sci 2015;11:1164–1178. [DOI] [PMC free article] [PubMed] [Google Scholar]
- 22. Bocchini V, Angeletti PU. The nerve growth factor: Purification as a 30,000‐molecular‐weight protein. Proc Natl Acad Sci USA 1969;64:787–794. [DOI] [PMC free article] [PubMed] [Google Scholar]
- 23. Krishnan V, Nestler EJ. Animal models of depression: Molecular perspectives. Curr Top Behav Neurosci 2011;7:121–147. [DOI] [PMC free article] [PubMed] [Google Scholar]
- 24. El Khoury A, Gruber SH, Mork A, Mathe AA. Adult life behavioral consequences of early maternal separation are alleviated by escitalopram treatment in a rat model of depression. Prog Neuropsychopharmacol Biol Psychiatry 2006;30:535–540. [DOI] [PubMed] [Google Scholar]
- 25. Marais L, Stein DJ, Daniels WM. Exercise increases BDNF levels in the striatum and decreases depressive‐like behavior in chronically stressed rats. Metab Brain Dis 2009;24:587–597. [DOI] [PubMed] [Google Scholar]
- 26. Castillo‐Gomez E, Varea E, Blasco‐Ibanez JM, Crespo C, Nacher J. Polysialic acid is required for dopamine D2 receptor‐mediated plasticity involving inhibitory circuits of the rat medial prefrontal cortex. PLoS ONE 2011;6:e29516. [DOI] [PMC free article] [PubMed] [Google Scholar]
- 27. Nacher J, Guirado R, Castillo‐Gomez E. Structural plasticity of interneurons in the adult brain: Role of PSA‐NCAM and implications for psychiatric disorders. Neurochem Res 2013;38:1122–1133. [DOI] [PubMed] [Google Scholar]
- 28. Ninan I. Synaptic regulation of affective behaviors; role of BDNF. Neuropharmacology 2014;76:684–695. [DOI] [PMC free article] [PubMed] [Google Scholar]
- 29. Lee BH, Kim YK. The roles of BDNF in the pathophysiology of major depression and in antidepressant treatment. Psychiatry Investig 2010;7:231–235. [DOI] [PMC free article] [PubMed] [Google Scholar]
- 30. Tirassa P, Iannitelli A, Sornelli F, et al. Daily serum and salivary BDNF levels correlate with morning‐evening personality type in women and are affected by light therapy. Riv Psichiatr 2012;47:527–534. [DOI] [PubMed] [Google Scholar]
- 31. Ibanez CF, Simi A. p75 neurotrophin receptor signaling in nervous system injury and degeneration: Paradox and opportunity. Trends Neurosci 2012;35:431–440. [DOI] [PubMed] [Google Scholar]
- 32. Bai YY, Ruan CS, Yang CR, et al. ProBDNF signaling regulates depression‐like behaviors in rodents under chronic stress. Neuropsychopharmacology 2016;41:2882–2892. [DOI] [PMC free article] [PubMed] [Google Scholar]
- 33. Zhang JC, Wu J, Fujita Y, et al. Antidepressant effects of TrkB ligands on depression‐like behavior and dendritic changes in mice after inflammation. Int J Neuropsychopharmacol 2015;18:1–12. [DOI] [PMC free article] [PubMed] [Google Scholar]
- 34. Shirayama Y, Yang C, Zhang JC, Ren Q, Yao W, Hashimoto K. Alterations in brain‐derived neurotrophic factor (BDNF) and its precursor proBDNF in the brain regions of a learned helplessness rat model and the antidepressant effects of a TrkB agonist and antagonist. Eur Neuropsychopharmacol 2015;25:2449–2458. [DOI] [PubMed] [Google Scholar]
- 35. Yamasaki T, Kawasaki H, Nishina H. Diverse roles of JNK and MKK pathways in the brain. J Signal Transduct 2012;2012:459265. [DOI] [PMC free article] [PubMed] [Google Scholar]
- 36. Wang LW, Tu YF, Huang CC, Ho CJ. JNK signaling is the shared pathway linking neuroinflammation, blood‐brain barrier disruption, and oligodendroglial apoptosis in the white matter injury of the immature brain. J Neuroinflammation 2012;9:175. [DOI] [PMC free article] [PubMed] [Google Scholar]
- 37. Papa S, Zazzeroni F, Pham CG, Bubici C, Franzoso G. Linking JNK signaling to NF‐kappaB: A key to survival. J Cell Sci 2004;117:5197–5208. [DOI] [PubMed] [Google Scholar]
- 38. Prasad S, Sajja RK, Naik P, Cucullo L. Diabetes mellitus and blood‐brain barrier dysfunction: An overview. J Pharmacovigil 2014;2:125. [DOI] [PMC free article] [PubMed] [Google Scholar]
- 39. Kuhad A, Bishnoi M, Tiwari V, Chopra K. Suppression of NF‐kappabeta signaling pathway by tocotrienol can prevent diabetes associated cognitive deficits. Pharmacol Biochem Behav 2009;92:251–259. [DOI] [PubMed] [Google Scholar]
- 40. Miao Y, He T, Zhu Y, Li W, Wang B, Zhong Y. Activation of hippocampal CREB by rolipram partially recovers balance between TNF‐alpha and IL‐10 levels and improves cognitive deficits in diabetic rats. Cell Mol Neurobiol 2015;35:1157–1164. [DOI] [PMC free article] [PubMed] [Google Scholar]
- 41. Datusalia AK, Sharma SS. Amelioration of diabetes‐induced cognitive deficits by GSK‐3beta inhibition is attributed to modulation of neurotransmitters and neuroinflammation. Mol Neurobiol 2014;50:390–405. [DOI] [PubMed] [Google Scholar]
- 42. Villoslada P, Genain CP. Role of nerve growth factor and other trophic factors in brain inflammation. Prog Brain Res 2004;146:403–414. [DOI] [PubMed] [Google Scholar]
- 43. Prencipe G, Minnone G, Strippoli R, et al. Nerve growth factor downregulates inflammatory response in human monocytes through TrkA. J Immunol 2014;192:3345–3354. [DOI] [PubMed] [Google Scholar]
- 44. Cragnolini AB, Friedman WJ. The function of p75NTR in glia. Trends Neurosci 2008;31:99–104. [DOI] [PubMed] [Google Scholar]
- 45. Vutskits L, Djebbara‐Hannas Z, Zhang H, et al. PSA‐NCAM modulates BDNF‐dependent survival and differentiation of cortical neurons. Eur J Neurosci 2001;13:1391–1402. [DOI] [PubMed] [Google Scholar]
- 46. Varea E, Castillo‐Gomez E, Gomez‐Climent MA, et al. Chronic antidepressant treatment induces contrasting patterns of synaptophysin and PSA‐NCAM expression in different regions of the adult rat telencephalon. Eur Neuropsychopharmacol 2007;17:546–557. [DOI] [PubMed] [Google Scholar]
- 47. Muller D, Djebbara‐Hannas Z, Jourdain P, et al. Brain‐derived neurotrophic factor restores long‐term potentiation in polysialic acid‐neural cell adhesion molecule‐deficient hippocampus. Proc Natl Acad Sci USA 2000;97:4315–4320. [DOI] [PMC free article] [PubMed] [Google Scholar]
- 48. Gascon E, Vutskits L, Kiss JZ. Polysialic acid‐neural cell adhesion molecule in brain plasticity: From synapses to integration of new neurons. Brain Res Rev 2007;56:101–118. [DOI] [PubMed] [Google Scholar]
- 49. Chiba S, Numakawa T, Ninomiya M, Richards MC, Wakabayashi C, Kunugi H. Chronic restraint stress causes anxiety‐ and depression‐like behaviors, downregulates glucocorticoid receptor expression, and attenuates glutamate release induced by brain‐derived neurotrophic factor in the prefrontal cortex. Prog Neuropsychopharmacol Biol Psychiatry 2012;39:112–119. [DOI] [PubMed] [Google Scholar]
- 50. Martinowich K, Manji H, Lu B. New insights into BDNF function in depression and anxiety. Nat Neurosci 2007;10:1089–1093. [DOI] [PubMed] [Google Scholar]
- 51. Ditlevsen DK, Kohler LB, Pedersen MV, et al. The role of phosphatidylinositol 3‐kinase in neural cell adhesion molecule‐mediated neuronal differentiation and survival. J Neurochem 2003;84:546–556. [DOI] [PubMed] [Google Scholar]
- 52. Ferrari MP, Mantelli F, Sacchetti M, et al. Safety and pharmacokinetics of escalating doses of human recombinant nerve growth factor eye drops in a double‐masked, randomized clinical trial. BioDrugs 2014;28:275–283. [DOI] [PMC free article] [PubMed] [Google Scholar]