

Summary
Aims
Axonal degeneration is a pathological symbol in the early stage of Alzheimer's disease (AD), which can be triggered by amyloid‐β (Aβ) peptide deposition. Growing evidence indicates that deficit of autophagy eventually leads to the axonal degeneration. Our previous studies have shown that Dendrobium nobile Lindl alkaloid (DNLA) had protective effect on neuron impairment in vivo and in vitro; however, the underlying mechanisms is still unclear.
Methods
We exposed cultured hippocampus neurons to Aβ25‐35 to investigate the effect of DNLA in vitro. Axonal degeneration was evaluated by immunofluorescence staining and MTT assay. Neurons overexpressing GFP‐LC3B were used to measure the formation of autophagosome. Autophagosome‐lysosome fusion, the lysosomal pH, and cathepsin activity were assessed to reflect autophagy process. Proteins of interest were analyzed by Western blot.
Results
DNLA pretreatment significantly inhibited axonal degeneration induced by Aβ25‐35 peptide in vitro. Further studies revealed DNLA treatment increased autophagic flux through promoting formation and degradation of autophagosome in hippocampus neurons. Moreover, enhancement of autophagic flux was responsible for the protective effects of DNLA on axonal degeneration.
Conclusions
DNLA prevents Aβ25‐35‐induced axonal degeneration via activation of autophagy process and could be a novel therapeutic target.
Keywords: Alzheimer's disease, amyloid‐β, autophagy, axonal degeneration, Dendrobium nobile Lindl alkaloid
1. Introduction
Alzheimer's disease (AD) is a fatal neurodegenerative disease characterized by progressive impairment of memory and cognitive function. AD involves progressive dysfunction and degeneration of specific neuronal populations within the central nervous system, especially in the hippocampus and cerebral cortex.1 Axonal degeneration is a pathological symbol in the early stage of AD, where axonal degeneration and abnormalities in synaptic function precede cell body death.2, 3 Although the exact mechanism underlying axonal degeneration in AD remains unclear, several reports have elucidated that cytotoxicity of amyloid‐β (Aβ) could lead to axonal degeneration, which is related to autophagy dysfunction.4, 5
Autophagy is a complex chain of intracellular process in which damaged mitochondria, ribosomes, misfolded proteins, and some long‐lived molecules are transported to lysosome for degradation.6 Autophagy pathway recycles nutrients for cell survival and degrades cargo by lysosomal enzymes to maintain the intracellular homeostasis. Autophagic flux refers to the entire process of autophagy including formation of phagophore (the precursor of the autophagosome) and autophagosome, fusion with lysosome, and its subsequent breakdown. A group of highly conserved autophagy‐related (ATG) proteins are known to regulate autophagic flux.7, 8 The formation of phagophore requires a class III phosphatidylinositol 3‐kinase (PtdIns3K) complex consisting of the proteins VPS34, p150, ATG14, and Beclin1. This complex together with other ATG proteins recruits two ubiquitin‐like conjugation systems, ATG12‐ATG5‐ATG16L1 and ATG8‐phosphatidylethanolamine, to the maturing phagophore.9 The latter is also called MAP1LC3 (microtubule‐associated protein 1 light chain 3), abbreviated as LC3 in mammalian. LC3 is converted into LC3 I by ATG4, and then, LC3 I is conjugated with phosphatidylethanolamine, forming LC3 II by ATG7. Conversion of LC3 I to LC3 II is important for the development of autophagosome.10 SQSTM1/p62, also known as a polyubiquitin‐binding protein, is selectively incorporated into phagophores by directly binding to LC3 II and is efficiently degraded by autophagy.8 Thus, measurement of Beclin1, ATG5, LC3 II protein levels, and the LC3 II/LC3 I ratio by immunoblotting will be the representative of the status of the autophagy, and the protein level of SQSTM1/p62 is negatively correlated with autophagic activity.11
Autophagy dysfunction is a key event in pathophysiology of AD. In the neurons of patients with AD and presenilin‐1 (PS1)/APP transgenic mice, a large number of autophagic vacuoles are observed in dystrophic neurites before extracellular Aβ deposition.12 In both cell cultures and animal models, Aβ was increased by both the application of autophagy inhibitors and the deficiency of autophagy‐related genes such as Beclin1 and ATG5.13, 14 On the contrary, overexpression of Beclin1 reduces the accumulation of Aβ.15 Enhancement of autophagy function by metformin—a pharmacological autophagy inducer—attenuates symptom of AD in patients and animal models.16, 17 Moreover, enhancement of autophagy function protects axonal degeneration from Aβ‐induced cytotoxicity.12, 18 Overall, AD would be treated potentially by regulating autophagy process.
Dendrobium nobile Lindl alkaloid (DNLA) is an active ingredient extracted from Dendrobium nobile Lindl, a well‐known traditional Chinese herb used for thousands of years in China.19 In our previous study, DNLA ameliorates LPS‐induced impairment of memory and cognitive functions in rats. The potential mechanism was addressed at decreasing hyperphosphorylation of tau protein, preventing overexpression of TNFR1, inhibition of p‐p38 MAPK, and inhibition of the downstream NF‐κB signal pathway.20, 21 On the other hand, DNLA treatments increase cell viability and decrease cell apoptosis in rat primary cortical neurons injured by oxygen‐glucose deprivation and reperfusion via decreasing intracellular Ca2+ level in vitro.22 However, all of those aforementioned mechanisms could not fully explain the significant effect of DNLA on AD. Until now, there is still no any publication regarding the relationship between the protective effects of DNLA on AD and the autophagy process. As the strong relevance of axonal degeneration and autophagy, in this study, we aimed to address the effect of DNLA axonal degeneration induced by Aβ25‐35 peptide and the crosstalk with autophagy in hippocampus neurons in vitro.
2. Materials and Methods
2.1. Isolation and purification of DNLA
The dried stems of Dendrobium nobile Lindl were boiled in 95% ethanol. The ethanolic extract was concentrated and then dissolved with the hydrochloric acid solution (pH=3.5). The acid solution was further extracted by petroleum ether and then mixture of chloroform and ammonia solution (pH=10). The chloroform extract was concentrated and further separated through cation exchange resin. DNLA was obtained by freeze‐drying under vacuum.
2.2. Analysis of DNLA content
UPLC‐MS/MS (Q Exactive, Thermo, Waltham, MA, USA) with ESI source was used in this study. A Hypersil Gold C18 (150×2.1 mm, 1.9 μm) column was used for separation. Acetonitrile and formic acid solution (0.1% in water) were used as mobile phase components A and B, respectively. The mobile phase elution gradient was as follows: 0‐2 minutes, 5% A; 2‐15 minutes, 5% to 95% A; 15‐17 minutes, 95% A. The flow rate was 0.3 mL/min. The positive ion monitor mode was adopted, and mass parameters were set as follows: spray voltage, 3.5 kV; capillary and probe heater temperatures, 350 and 300°C, respectively; sheath and aux gas flow, 35 and 15 arb, respectively. DNLA was dissolved in methanol and analyzed.
2.3. Culture of hippocampus primary neurons
Hippocampus tissues were separated on ice from newborn SD rats born within 24 hours and then incubated in 0.125% of trypsin (HyClone, Logan, UT, USA; SH30042.01) at room temperature for 5 minutes. Hippocampus tissues were triturated by passing repeatedly through 1‐mL pipette tip and filtered through 45‐μm nylon mesh, and then, cells were collected by centrifugation at 179 g for 10 minutes. Cells were cultured in DMEM/F12 medium (HyClone, SH3002301B) supplemented with 10% FBS (Solarbio, Beijing, China; S9030), 100 U/mL penicillin, and streptomycin (Invitrogen, Carlsbad, CA, USA; 15140‐122) at 37°C with 5% CO2. After 2 hours, DMEM/F12 medium were replaced with Neurobasal A (Gibco, Grand Island, NY, USA; A2477501) supplemented with 2% B27 (Gibco, 17504044) for the duration of experiments. On the 7th day, neurons in good condition were used for following experiments. The study protocol was approved by the ethics committee of Zunyi Medical University.
2.4. Pretreatment of Aβ25‐35 and DNLA
Aβ25‐35 (molecular formula: C45H81N13O14S; molecular weight: 1060.27; purity: ≥97%; Sigma‐Aldrich Co., St. Louis, MO, USA; A4559) was dissolved to 10−3 mol/L with deionized distilled water and incubated at 37°C for 7 days to induce its aggregation. When using, it was diluted to different concentrations with Neurobasal A. DNLA was soluble in dimethylsulfoxide (DMSO) and was stored at −20°C. When using, it was diluted to different concentrations with Neurobasal A. The final concentration of DMSO was 0.1% (v/v) in our experimental system.
2.5. Automated quantification of axonal degeneration
We improved methods of quantification of axonal degeneration on the basis of description of Sasaki Yet et al.23 The profile of neurons was visualized by immunofluorescence staining using mouse monoclonal anti‐beta III tubulin antibody (1:1000; Abcam, Cambridge, MA, USA; ab14545) and goat anti‐mouse IgG H&L (Alexa Fluor® 488, Life Technologies Corporation, Carlsbad, CA, USA) secondary antibody (1:1000; Abcam, ab150113). DAPI was used to mark cell nucleus. The fluorescence images were captured using Live Cell Station (Olympus, Tokyo, Japan). For computer‐based image analysis, it is important that the axon tracts are well separated. Original images firstly were handled by two‐dimensional (2D) deconvolution using cellSens Life Science imaging software (version 510, Olympus) and then were binarized such that pixel intensity of regions corresponding to axons was converted to black and of all other regions was converted to white. The total number of black pixels was then defined as the total axon area. To detect degenerated axons, we used the particle analyzer module of ImageJ software (NIH, Bethesda, MD, USA) and counted the area of the small fragments or particles (size: 4‐900 pixels) derived from the degenerated axons as degenerated axons area (Fig. S1). The degeneration index was calculated as the ratio of degenerated axons area to total axon area.
2.6. Assessment of cell viability by MTT assay
Neurons were seeded into 96‐well plates and treated with DNLA or other drugs for a desired time period at the indicated concentrations. Five replicates were made for each treatment. After treatment, cell viability was evaluated using the MTT assay as previously described.24 The cell viability was expressed as a percentage of OD in cells with indicated treatments to that in cells with DMSO control treatment.
2.7. Lentivirus vector infection and GFP‐LC3B puncta quantitative analysis
Recombinant lentivirus (pLenti‐Ubc‐EGFP‐3FLAG‐Map1lc3b) and control vector were constructed by Obio Technology (Shanghai) Co, Ltd. The DNA sequence of Map1lc3b was obtained from GenBank (NM_022867.2). For lentivirus infection, neurons were seeded on coverslips in 24‐well plate and infected with recombinant lentivirus or control vector (as negative control) at a multiplicity of infection (MOI) of 10. At 72 hours after infection, cells were treated with DNLA alone or in the presence of 3‐methyladenine (3MA; Gene Operation, Ann Arbor, MI, USA; IPA1021) or hydroxychloroquine (HCQ; Sigma‐Aldrich Co.; H0915) for 24 hours and then fixed with 4% paraformaldehyde for 30 minutes. Image acquisition was executed using an inverted fluorescence microscope (Olympus) equipped with a 60× oil immersion objective. The numbers of GFP‐LC3B dots were counted artificially by the counting tool of Photoshop software (Adobe Systems, CC, San Jose, CA, USA).
2.8. Autophagosome‐Lysosome colocalization analysis
Neurons overexpressing GFP‐LC3B were cultured on coverslips in a medium containing DNLA or HCQ for 24 hours, or EBSS medium for 4 hours. Lysosomes were marked with LysoTracker Red probe (Beyotime, Shanghai, China; C1046) at a final concentration of 50 μmol/L for 60 minutes at 37°C. Images were captured by inverted fluorescence microscope. The colocalization images of GFP‐LC3B puncta and LysoTracker Red fluorescence signaling were created by cellSens Life Science imaging software.
2.9. Acridine orange staining
Neurons were stained with acridine orange (AO; Sigma‐Aldrich Co., A6014) at a final concentration of 5 μg/mL for 15 minutes (37°C, 5% CO2) according to the published procedures.25 Fluorescence pictures were captured using inverted fluorescence microscope. AO produces red fluorescence (emission peak at about 650 nm) in the lysosomal compartments, and green fluorescence (emission peak between 530 and 550 nm) in the cytosolic and nuclear compartments. The fluorescence intensity per pixel was quantified with ImageJ software, and the ratio of red and green fluorescence intensity per pixel was calculated.
2.10. Cathepsin activity assay
Neurons in six‐well plate (106 cells/well) were treated with different concentrations of DNLA for 24 hours. Cells were collected by centrifugation at 179 g for 10 minutes. Cathepsin B (CTSB) or cathepsin D (CTSD) activity was determined using CTSB and CTSD Activity Fluorometric Assay Kit (BioVision, Milpitas, CA, USA; K140‐100, K143‐100) according to the manufacturer's protocol. The activity of cathepsin was standardized with the corresponding samples' protein concentration.
2.11. DQ Red BSA staining and colocalization with GFP‐LC3B puncta analysis
Lysosomal‐dependent proteolysis was visualized with DQ Red BSA (Invitrogen, D‐12051). Neurons overexpressing GFP‐LC3B was incubated with DQ Red BSA at a final concentration of 10 μg/mL for 12 hours (37°C, 5% CO2). The cells were then washed three times with PBS buffer and then cultured in fresh medium supplemented with DNLA alone or in the presence of Bafilomycin A1 (BAFA; Sigma‐Aldrich Co.; B1793) for 24 hours; EBSS medium was used as a positive control for 4 hours. Then, cells were fixed with 4% paraformaldehyde for 30 minutes, and the photographs were captured using inverted fluorescence microscope at a magnification of 600. The fluorescence intensity of DQ Red BSA was measured by ImageJ software. The colocalization images of DQ Red BSA with GFP‐LC3B puncta were developed with the former methods.
2.12. Western blot assay
Total protein was extracted from cultured neurons using a total protein extraction kit (Applygen, Beijing, China; P1250) and quantified by BCA protein assay kit (Beyotime, P0012). Equal amounts of protein (30 μg) per lane were separated by SDS‐PAGE gels and then transferred to a PVDF (0.45 μm for protein of the molecular weight more than 20 kDa, 0.22 μm for protein of the molecular weight less than 20 kDa) membrane. The membranes were incubated with the following primary antibodies: LC3B (1:1000; Abcam, ab63817), Beclin1 (1:1000; Abcam, ab55878), ATG5 (1:1000; Abcam, ab78073), SQSTM1/p62 (1:1000; Abcam, ab91526), CTSB (1:1000; Cell signaling, Danvers, MA, USA; 31718), CTSD (1:200; SANTA CRUZ, Dallas, TX, USA; sc‐6487), postsynaptic density 95 (PSD95; 1:1000; Abcam, ab918258), synaptophysin (SYP; 1:1000; Abcam, ab32594), and GAPDH (1:2000; Proteintech, Rosemont, IL, USA; 10494‐1‐AP) at 4°C overnight, followed by incubation with secondary antibody at room temperature for 2 hours. The membranes were visualized using chemiluminescence reagent ECL Plus (7Sea Biotech, Shanghai, China; E003‐100). The image was scanned, and band densities were quantified using Quantity One 1D analysis software v4.52 (BioRad, Hercules, CA, USA). GAPDH was used to normalize protein loading.
2.13. Statistical analysis
All data were expressed as mean±SD and analyzed statistically by the SPSS 19.0 software (SPSS Inc., Chicago, IL, USA). The normality of data was analyzed statistically by the K‐S test. The normal‐distributed data firstly were analyzed statistically via one‐way analysis of variance (ANOVA), and the statistical significance of difference between two groups was determined using LSD method if equal variance or Dunnett's T3 method if missing variance. Colocalization analysis of fluorescence signal was performed by Pearson's correlation coefficient. A value of P<.05 was considered to be statistically significant.
3. Results
3.1. The alkaloid extracted from Dendrobium nobile Lindl
The extract from the dried stems of Dendrobium nobile Lindl contains 79.8% alkaloid. Relative percentage of alkaloid was 92.6% dendrobine (C16H25O2N) as the main alkaloid, followed by 3.3% dendrobine‐N‐oxide (C16H25O3N), 2.0% nobilonine (C17H27O3N), 0.9% dendroxine (C17H25O3N), 0.32% 6‐hydroxy‐nobilonine (C17H27O4N), and 0.07% 13‐hydroxy‐14‐oxodendrobine (C16H23O4N). Chemical structures of these ingredients are showed in Fig. S2A, and the chromatograms of sample solutions were shown in Fig. S2B. In our studies, the dosages of DNLA were calculated according to dendrobine, and molar concentration of dendrobine in 3.5 ng/mL DNLA was 10−8 mol/L.
3.2. DNLA protects axonal degeneration from Aβ23‐35 peptide cytotoxicity
As shown in Figure 1A, axon underwent widespread catastrophic fragmentation in neurons treated with Aβ25‐35 (10−7 mol/L) alone, but the trace of axon was still visible; some of the cell body disappeared, but cell nucleus remained intact; and these morphological changes were very similar to that of Wallerian degeneration.26 Degeneration index significantly increased in a time‐dependent manner (Figure 1B). Additionally, the results from MTT assay showed that cell viability decreased in neurons treated with Aβ25‐35 (Figure 1C). The protein levels of SYN and PSD95, which were related to axon health status,27 were consistently decreased in neurons treated with Aβ25‐35 (Figure 1D,E). These results suggest that axonal degeneration was successfully established in vitro. Subsequently, we found DNLA pretreatment prevented axon morphological damage, decreased degeneration index, and increased cell viability and the protein levels of PSD95 and SYN (Figure 1). Taken together, these results indicate that DNLA ameliorates axonal degeneration induced by Aβ23‐35 cytotoxicity.
Figure 1.
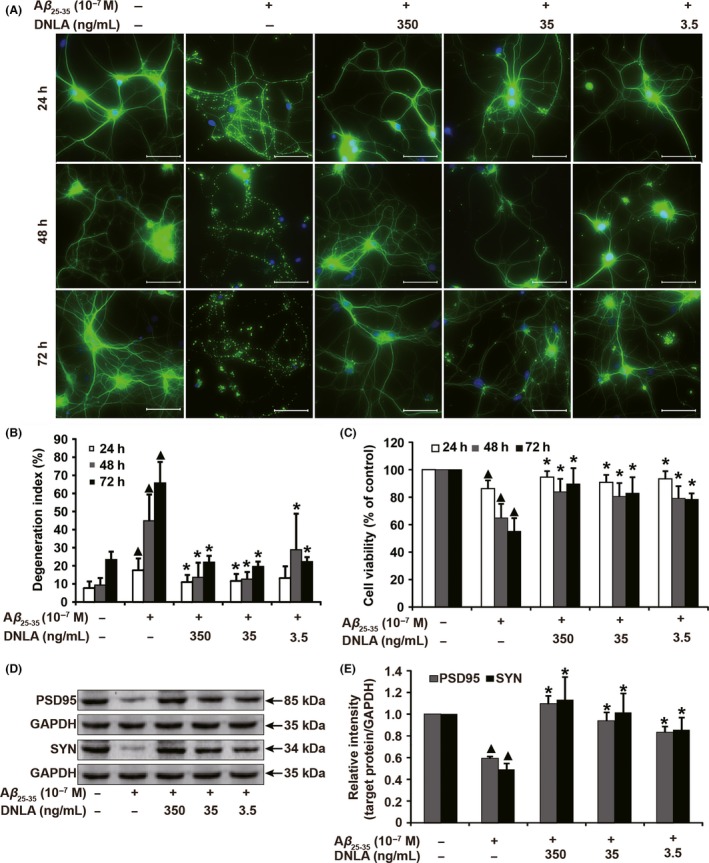
DNLA protect hippocampus neurons axonal degeneration from Aβ25‐35 cytotoxicity. Hippocampus neurons were pretreated with 10−7 mol/L of Aβ23‐35 for 2 hours and then exposed to DNLA (3.5, 35, 350 ng/mL) for 24, 48, and 72 hours, respectively, for immunofluorescence staining, MTT assay, and Western blot analysis. (A) Representative images of neurons suffering from axonal degeneration. (B) The quantification of axonal degeneration namely degeneration index in (A). Raw data were obtained from five random visual fields from three independent wells. (C) Cell viability was measured by MTT assay. (D) The protein levels of PSD95 and SYN were analyzed by Western blot. (E) The statistical bar graph of quantification analysis of protein bands in (D). Compared with nontreatment group ▲ P<.05, compared with alone Aβ23‐35 treatment group *P<.05. Scale bar: 50 μm
3.3. DNLA promotes autophagosome formation and autophagosome‐lysosome fusion in neurons
Neurons overexpressing GFP‐LC3B or GFP were exposed to DNLA for 24 hours. The number of autophagosome increased in a dose‐dependent manner; however, there was no green fluorescence dot formation in neurons with overexpression of GFP, suggesting that dot formation was related to LC3B (Figure 2A,B). Moreover, 3MA, a class III PI3K inhibitor, which blocks autophagosome formation, decreased the number of green fluorescence dots; on the contrary, HCQ, which blocks autophagosome degradation, increased the number of dots following DNLA treatment (Figure 2C,D). These results demonstrated DNLA induced autophagosome formation in neurons.
Figure 2.
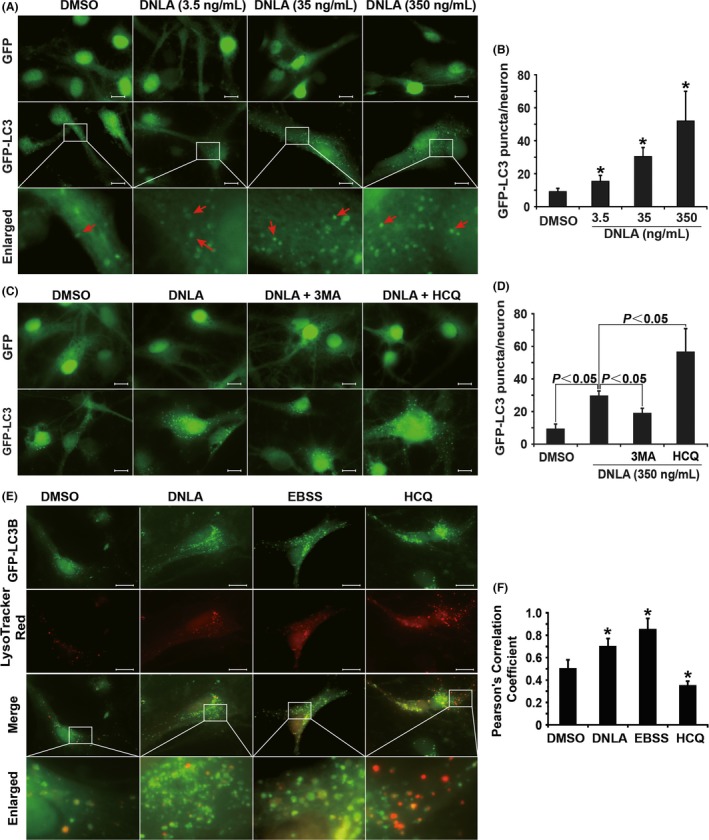
DNLA increases autophagosome formation and promotes autophagosome‐lysosome fusion in hippocampus primary neurons of rats. Scale bar: 10 μm. (A) and (C) Representative fluorescence images of autophagosome in hippocampus neurons overexpressing GFP or GFP‐LC3B. In (A), neurons were treated with DNLA or DMSO for 24 hours. Red arrows indicate autophagosome marked by GFP‐LC3B. In (C), hippocampus neurons were treated with DNLA (350 ng/mL) or DMSO alone or in the presence of 3MA (10−3 mol/L) or HCQ (5×10⁻⁵ mol/L) for 24 hours. (B) and (D) Bar graph of result of GFP‐LC3B puncta quantification in (A) and (C), respectively. (E) Representative fluorescence images of autophagosome‐lysosome fusion. Neurons overexpressing GFP‐LC3B were treated with DNLA (350 ng/mL) or HCQ (5×10⁻⁵ mol/L) for 24 hours or maintained in EBSS medium for 4 hours. Autophagosomes were shown by green fluorescence signal, and lysosome was shown by red fluorescence signals. Merged images display colocalization of green and red fluorescence signal. Enlarged images are cut from the merge panels (white borders). (F) Quantification of Pearson's correlation coefficient as a statistic for quantifying colocalization. More than 50 cells were counted in every group. Compared with DMSO group *P<.05
The fusion of autophagosome with lysosome is a necessary step for cargo degradation. As a positive control, EBSS, which can induce autophagy activation by simulating nutrient deprivation condition, led to colocalization of GFP‐LC3B dots with LysoTracker Red signaling that could be inhibited by HCQ, suggesting that the experiment system was working well. Consistently, we found there was colocalization of GFP‐LC3B with LysoTracker Red in neurons treated with DNLA for 24 hours (Figure 2E,F).
3.4. DNLA induces autophagic flux in hippocampus primary neurons of rats
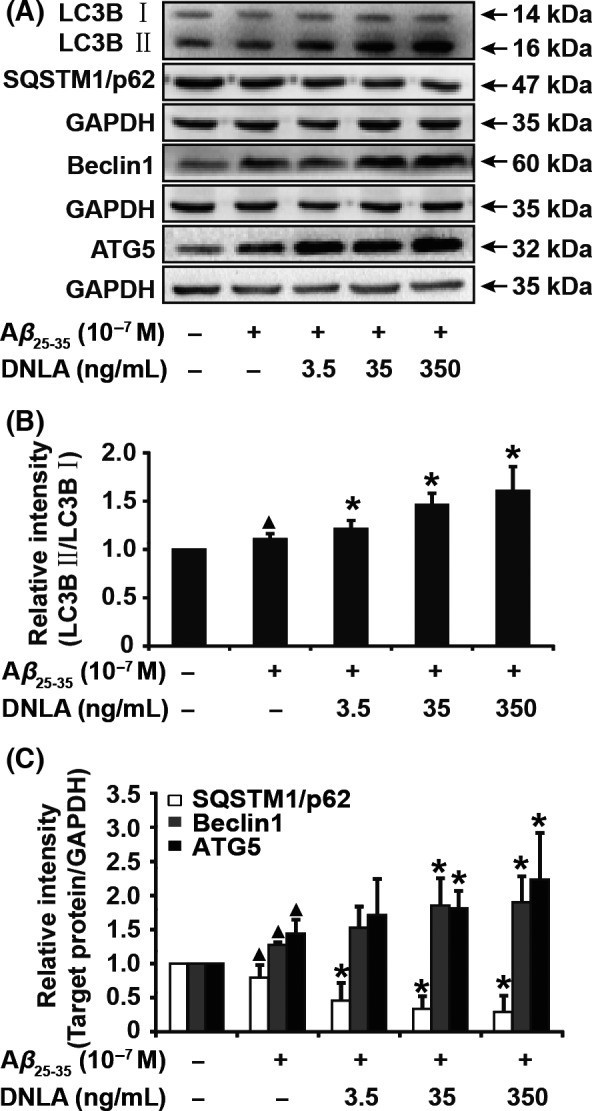
From Figure 3, there was a remarkable increase in endogenous LC3B II, Beclin1, ATG5 in a dose‐ and time‐dependent manner, suggesting again that DNLA treatment improved formation of autophagosome in neurons treated with DNLA. SQSTM1/p62, which is usually used as a marker for the degradation of autophagosome, was decreased in neurons treated with DNLA in the same manner. Collectively, these results demonstrated that DNLA promotes not only formation but also degradation of autophagosome; in other words, DNLA induces autophagic flux in hippocampus primary neurons.
Figure 3.
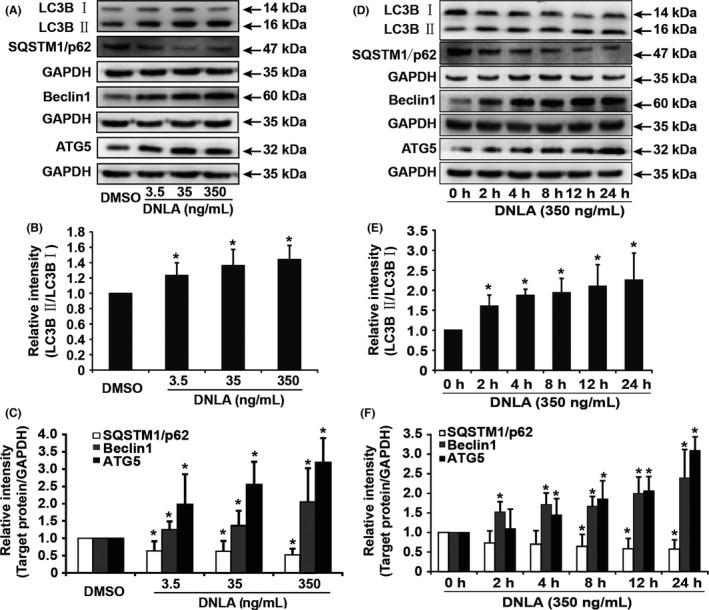
DNLA induces autophagic flux in hippocampus neurons of rats in a dose‐ and time‐dependent manner. (A) Endogenous LC3B II, SQSTM1/p62, Beclin1, and ATG5 were analyzed by Western blot in neurons treated with DNLA for 24 hours. (B) and (C) Statistical bar graph of quantification of protein expression in (A). (D) Representative bands of endogenous LC3B II, SQSTM1/p62, Beclin1, and ATG5 analyzed by Western blot. (E) and (F) Statistical bar graph of quantification of proteins expression in (D). Raw data were obtained from at least five independent samples. * indicates a significant difference from controls, P<.05
3.5. DNLA enhances lysosomal cathepsin activity via acidifying lysosome compartment to improve degradation of lysosome pathway
AO is a nucleic acid dye that accumulates in acidic spaces and usually is used to evaluate the lysosomal pH. As shown in Figure 4A,B, the red fluorescence was greatly raised in neurons treated with DNLA (350 ng/mL), which was inhibited by selective inhibitor of the V‐ATPase BAFA (10−8 mol/L) treatment, suggesting that DNLA decreases the lysosomal pH.
Figure 4.
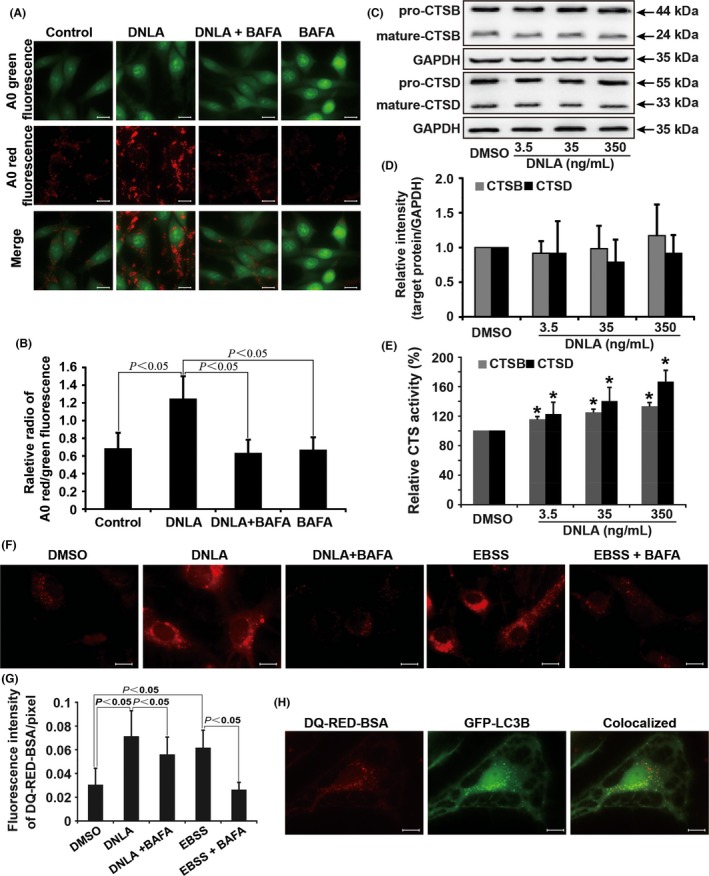
DNLA enhances lysosomal cathepsin activity via acidifying lysosome compartment to promote degradation of lysosome pathway. (A) Representative pictures of neurons stained by AO. (B) Quantification of red/green intensity ratio of (A), raw data originated from at least three independent visual fields from three independent wells. (C) Endogenous CTSB and CTSD protein levels were surveyed by Western blot in neurons treated with DNLA for 24 hours. Pro‐CTSB and pro‐CTSD, precursor form of CTSB and CTSD; mature‐CTSB and mature‐CTSD, mature form of CTSB and CTSD. (D) Statistical bar graph of quantification of proteins expression in (C). (E) Enzymatic activity of CTSB and CTSD. (F) Representative pictures of neurons marked by DQ Red BSA. (G) Statistical bar graph of fluorescence intensity of DQ Red BSA in (F), data were showed as the mean±SD of at least five independent visual fields from three independent wells. (D) Colocalization of green fluorescence signal of GFP‐LC3B and red fluorescence signal of DQ Red BSA. Scale bar: 10 μm. * indicates a significant statistical difference from DMSO treatment group,*P<.05
Subsequently, we investigated the changes in CTSB and CTSD protein levels and activity. As shown in Figure 4C‐E, although the protein levels of mature form of CTSB and CTSD had no obvious changes, their activities were increased in neurons treated with DNLA in a dose‐dependent manner.
DQ Red BSA is a fluorescence indicator of cathepsin activity. As shown in Figure 4F,G, dequenching of DQ Red BSA occurred in neurons treated with DNLA (350 ng/mL) for 24 hours or EBSS for 4 hours, which was significantly attenuated by BAFA (10−8 mol/L). The red fluorescence signaling was colocalized with GFP‐LC3B dots (Figure 4H), suggesting that dequenching of DQ Red BSA stimulated by DNLA happened in autophagic compartments. Summarily, these results suggest that DNLA elevated proteolytic activity in lysosome by acidifying lysosomal compartments.
3.6. DNLA protects against axonal degeneration induced by Aβ23‐35 via activating autophagy
Next, the relationship of protective effect of DNLA on axonal degeneration and autophagy activation was investigated; as shown in Figure 5, DNLA significantly increased the expression of LC3B II, Beclin1, and ATG5 and decreased the expression of SQSTM1/p62 in a dose‐dependent manner in neurons treated with Aβ23‐35. These observations indicate that autophagy flux is induced in this experimental system. To further confirm this relationship, we employed BAFA to interfere with the protective effect of DNLA on axonal degeneration. As shown in Figure 6, Western blot assay revealed that BAFA led to an accumulation of LC3 II as well as blocking of SQSTM1/p62 degradation in neurons following Aβ23‐35 treatment alone or in the presence of DNLA, suggesting that inhibitory effect of BAFA on autophagy flux was working well. Meanwhile, we found BAFA increased degeneration index and decreased cell viability as well as PSD95 and SYN protein levels vs cotreatment of Aβ23‐35 with DNLA, suggesting that the protective effect of DNLA on axonal degeneration stimulated by Aβ23‐35 was markedly antagonized by BAFA. To exclude possible effect of other pharmacological action of BAFA, we used another autophagy inhibitor HCQ to repeat above measurements. The results demonstrated that inhibitory effects of HCQ and BAFA on neuroprotection of DNLA were fully identical (Fig. S3). In summary, these results confirm strongly that the protective effect of DNLA on axonal degeneration suffering from Aβ23‐35 cytotoxicity is related to activating autophagy.
Figure 5.
Autophagic flux was enhanced by DNLA treatment in neurons of axonal degeneration induced by Aβ23‐35 peptide. (A) LC3B, SQSTM1/p62, Beclin1, and ATG5 were analyzed by Western blot in neurons treated with DNLA for 24 hours. (B) and (C) The statistical bar graph of quantification analysis of protein bands in (A). Data from at least five independent samples were used for statistical analysis, compared with nontreatment group ▲ P<.05, compared with alone Aβ23‐35 treatment group *P<.05
Figure 6.
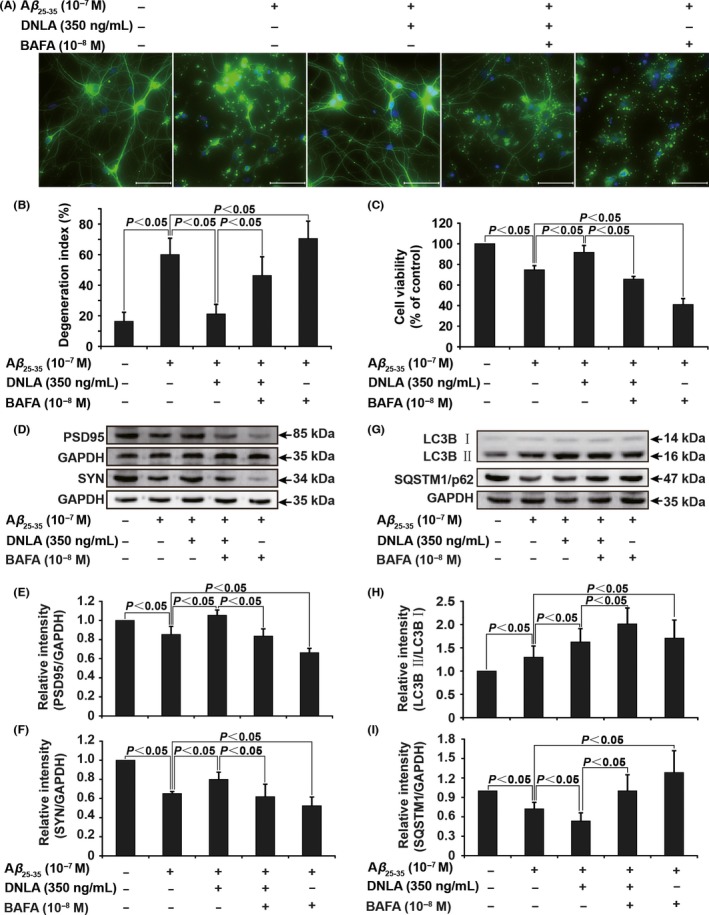
BAFA inhibits protective effect of DNLA on axonal degeneration induced by Aβ25‐35 peptide. (A) Representative images of neurons of axonal degeneration. Cells were visualized by immunofluorescence assay as description in Figure 4. (B) The statistical bar graph of degeneration index was presented. (C) The statistical bar graph of cell viability decided by MTT assay. (D‐F) and (G‐I) Quantification analysis of protein levels of PSD95, SYN, LC3B, and SQSTM1/p62 by Western blot. All data were presented as the mean±SD of 5 samples. Scale bar: 50 μm
4. Discussion
We have certified that DNLA could attenuate impairment of memory and cognitive function in AD model of rats in vivo. Here, we further focus on DNLA effect on axonal degeneration induced by Aβ25‐35 peptide and the potential mechanisms in vitro. Our results clearly demonstrated that DNLA protected axonal degeneration from Aβ25‐35 cytotoxicity via activating autophagy, suggesting again that DNLA has a potential application prospects in the treatment of AD.
Axonal degeneration can be triggered by extracellular Aβ accumulation or deposition.1 Aβ25‐35, a synthetic Aβ peptide, represents the region that aggregates during senile plaque formation and is a functional domain implicated in both neurotrophic and neurotoxic effects.4 In the present study, we firstly examined the neuron injury suffered from Aβ25‐35 peptide treatment at 10−8‐10−5 mol/L dose level for 24, 48, 72 hours; the results (not be shown) showed that Aβ25‐35 peptide treatment not only led to significant axonal degeneration but also reduction in cell viability at 10−7‐10−5 mol/L dose level in a dose‐ and time‐dependent manner, which was very consistent with the report.5 We chose the dosage of 10−7 mol/L for next experiment because at this dose level, axonal degeneration was more serious than reduction in cell viability, which was closely similar to “dying‐back” pattern of neurons degeneration. The communication of signaling events between synapses or axon terminals and soma is dependent on axonal intact28; in adult, damaged axon can hardly regenerate due to the development of an inhibitory CNS environment.29 Thus, DNLA was added into medium prior to Aβ25‐35 peptide in order to prevent axonal degeneration. The results from morphology and cell viability and Western blot analysis prove that DNLA protects axonal degeneration from Aβ25‐35 peptide cytotoxicity.
Next, to fully understand the possible mechanism of DNLA on axonal degeneration protection, we systematically investigated the effect of DNLA on autophagy and its consequence on the crosstalk with axonal degeneration. Using several different approaches, we found that DNLA treatment induced autophagic flux by improving formation and degradation of autophagosome in hippocampus neurons. Autophagosome is the morphological hallmark of autophagy.8 The formation of autophagosome is a key point in the process of autophagy, and once autophagy is induced, isolation of double membrane emerges to coat cargo and then elongates and expands to form the autophagosome.30 Beclin1 and ATG5 are necessary autophagy‐related proteins for the formation of double membrane31, 32; the conversion of endogenous LC3 I to LC3 II and exogenous GFP‐LC3 puncta is typically characterized as an autophagosome marker.33 Here, we found that Beclin1 and ATG5 protein levels were upregulated, and conversion of endogenous LC3 I to LC3 II and GFP‐LC3 puncta significantly increased in hippocampus neurons treated with DNLA, suggesting strongly that DNLA promotes autophagosome formation.
The final purpose of autophagy is to degrade autophagic substrates to maintain cellular homeostasis. Completion of the autophagosome is followed by fusion with lysosome and degradation of the contents. In next experiment, we found DNLA treatment facilitated the fusion of autophagosome and lysosome displayed by colocalization of GFP‐LC3B and LysoTracker Red probe (a dye for live cell lysosome labeling) signal. Moreover, DNLA decreased the pH value of acidic compartments and increased activities of two major lysosomal proteases CTSB and CTSD.34 The DQ Red BSA is designed for the visualization of proteolytic activity in a variety of applications, and our data indicated that proteolysis of the BSA conjugate was successfully executed. Consistently, SQSMT1/p62 protein level was also significantly reduced in neurons treated with DNLA. We concluded with the above evidence that DNLA could also improve degradation of autophagosome. In brief, all these results together certify strongly that DNLA can induce autophagy flux in hippocampus primary neurons of rats.
Under normal conditions, the level of autophagy in neurons is very low, but that is important for intracellular clearance.35 The moderate enhancement of autophagy function in neurons is benefit for maintaining axonal homeostasis and synaptic activity.36, 37 As mentioned above, DNLA treatment induced the activation of autophagy in normal neurons and protected axonal degeneration from Aβ25‐35 peptide. To elucidate their relationship, we employed autophagy inhibitor HCQ to interfere the protective effect of DNLA on axonal degeneration; the results demonstrated that HCQ aggravated axonal degeneration and antagonized the protective effect of DNLA on axonal degeneration in neurons induced by Aβ25‐35 peptide; and it was noteworthy that activation of autophagy elicited parallel changes. We repeated the above experiments with another autophagy inhibitor BAFA, and the results showed that effects of BAFA on neuroprotective actions of DNLA were in fully consistent with HCQ. Based on these facts, we draw a reliable conclusion that DNLA protects axonal degeneration of hippocampus primary neurons from Aβ25‐35 peptide cytotoxicity via moderate activation of autophagy.
Conflict of Interest
The authors declare no conflict of interest.
Supporting information
Acknowledgments
This work was supported by grants from the National Natural Science Foundation of China (grant numbers: 81473201); and Guizhou Provincial Department of Education “125” Major Science and Technology Projects (grant numbers: 2012012).
Li L‐S, Lu Y‐L, Nie J, et al. Dendrobium nobile Lindl alkaloid, a novel autophagy inducer, protects against axonal degeneration induced by Aβ25‐35 in hippocampus neurons in vitro. CNS Neurosci Ther. 2017;23:329‐340. 10.1111/cns.12678
Contributor Information
Yang Lu, Email: luyangssmu@163.com.
Jing‐Shan Shi, Email: shijs@zmc.edu.cn.
References
- 1. Kanaan NM, Pigino GF, Brady ST, et al. Axonal degeneration in Alzheimer's disease: when signaling abnormalities meet the axonal transport system. Exp Neurol. 2013;246:44–53. [DOI] [PMC free article] [PubMed] [Google Scholar]
- 2. Alobuia WM, Xia W, Vohra BPS. Axon degeneration is key component of neuronal death in amyloid‐β toxicity. Neurochem Int. 2013;63:782–789. [DOI] [PMC free article] [PubMed] [Google Scholar]
- 3. Christensen DZ, Huettenrauch M, Mitkovski M, et al. Axonal degeneration in an Alzheimer mouse model is PS1 gene dose dependent and linked to intraneuronal Aβ accumulation. Front Aging Neurosci. 2014;6:1–11. [DOI] [PMC free article] [PubMed] [Google Scholar]
- 4. Frozza RL, Horn AP, Hoppe JB, et al. A comparative study of β‐amyloid peptides Aβ1‐42 and Aβ25‐35 toxicity in organotypic hippocampus slice cultures. Neurochem Res. 2009;34:295–303. [DOI] [PubMed] [Google Scholar]
- 5. Annweiler C, Brugg B, Peyrin J, Bartha R, Beauchet O. Combination of memantine and vitamin D prevents axon degeneration induced by amyloid‐beta and glutamate. Neurobiol Aging. 2014;35:331–335. [DOI] [PubMed] [Google Scholar]
- 6. Feng Y, He D, Yao Z, Klionsky DJ. The machinery of macroautophagy. Cell Res. 2014;24:24–41. [DOI] [PMC free article] [PubMed] [Google Scholar]
- 7. Nazim UM, Jeong JK, Seol JW, et al. Inhibition of the autophagy flux by gingerol enhances TRAIL‐induced tumor cell death. Oncol Rep. 2015;33:2331–2336. [DOI] [PubMed] [Google Scholar]
- 8. Klionsky DJ, Abdelmohsen K, Abe A, et al. Guidelines for the use and interpretation of assays for monitoring autophagy (3rd edition). Autophagy. 2016;12:1–222. [DOI] [PMC free article] [PubMed] [Google Scholar]
- 9. Shanware NP, Bray K, Abraham RT. The PI3K, metabolic, and autophagy networks: interactive partners in cellular health and disease. Annu Rev Pharmacol Toxicol. 2013;53:89–106. [DOI] [PubMed] [Google Scholar]
- 10. Lin L, Baehrecke EH. Autophagy, cell death and cancer. Mol Cell Oncol. 2016;2:e985913. [DOI] [PMC free article] [PubMed] [Google Scholar]
- 11. Mizushima N, Yoshimori T. How to interpret LC3 immunoblotting. Autophagy. 2007;3:542–545. [DOI] [PubMed] [Google Scholar]
- 12. Wirths O, Weis J, Szczygielski J, et al. Axonopathy in an APP/PS1 transgenic mouse model of Alzheimer's disease. Acta Neuropathol. 2006;111:312–319. [DOI] [PubMed] [Google Scholar]
- 13. Chen YS, Chen SD, Wu CL, et al. Induction of sestrin2 as an endogenous protective mechanism against amyloid beta‐peptide neurotoxicity in primary cortical culture. Exp Neurol. 2014;253:63–71. [DOI] [PubMed] [Google Scholar]
- 14. Torres M, Marcilla‐Etxenike A, Fiol‐deRoque MA, et al. The unfolded protein response in the therapeutic effect of hydroxy‐DHA against Alzheimer's disease. Apoptosis. 2015;20:712–724. [DOI] [PubMed] [Google Scholar]
- 15. Salminen A, Kaarniranta K, Kauppinen A, et al. Impaired autophagy and APP processing in Alzheimer's disease: the potential role of Beclin 1 interactome. Prog Neurobiol. 2016;106‐107:33–54. [DOI] [PubMed] [Google Scholar]
- 16. Fant X, Durieu E, Chicanne G, et al. Cdc‐like/dual‐specificity tyrosine phosphorylation‐regulated kinases inhibitor leucettine L41 induces mTOR‐dependent autophagy: implication for Alzheimer's disease. Mol Pharmacol. 2014;85:441–450. [DOI] [PMC free article] [PubMed] [Google Scholar]
- 17. Zhu Z, Yan J, Jiang W, et al. Arctigenin effectively ameliorates memory impairment in Alzheimer's disease model mice targeting both beta‐amyloid production and clearance. J Neurosci. 2013;33:13138–13149. [DOI] [PMC free article] [PubMed] [Google Scholar]
- 18. Yang Y, Coleman M, Zhang L, et al. Autophagy in axonal and dendritic degeneration. Trends Neurosci. 2013;36:418–428. [DOI] [PMC free article] [PubMed] [Google Scholar]
- 19. Lam Y, Ng TB, Yao RM, et al. Evaluation of chemical constituents and important mechanism of pharmacological biology in Dendrobium plants. Evid Based Complement Alternat Med. 2015;2015:841752. [DOI] [PMC free article] [PubMed] [Google Scholar]
- 20. Li Y, Li F, Gong Q, et al. Inhibitory effects of Dendrobium alkaloids on memory impairment induced by lipopolysaccharide in rats. Planta Med. 2011;77:117–121. [DOI] [PubMed] [Google Scholar]
- 21. Yang S, Gong Q, Wu Q, et al. Alkaloids enriched extract from Dendrobium nobile Lindl attenuates tau protein hyperphosphorylation and apoptosis induced by lipopolysaccharide in rat brain. Phytomedicine. 2014;21:712–716. [DOI] [PubMed] [Google Scholar]
- 22. Wang Q, Gong Q, Wu Q, Shi J. Neuroprotective effects of Dendrobium alkaloids on rat cortical neurons injured by oxygen‐glucose deprivation and reperfusion. Phytomedicine. 2010;17:108–115. [DOI] [PubMed] [Google Scholar]
- 23. Sasaki Y, Vohra BPS, Lund FE, Milbrandt J. Nicotinamide mononucleotide adenylyl transferase‐mediated axonal protection requires enzymatic activity but not increased levels of neuronal nicotinamide adenine dinucleotide. J Neurosci. 2009;29:5525–5535. [DOI] [PMC free article] [PubMed] [Google Scholar]
- 24. Huang J, Li L, Yang D, et al. Inhibitory effect of Ginsenoside Rg1 on vascular smooth muscle cell proliferation induced by PDGF‐BB is involved in nitric oxide formation. Evid Based Complement Alternat Med. 2012;2012:314395. [DOI] [PMC free article] [PubMed] [Google Scholar]
- 25. Traganos F, Darzynkiewicz Z. Lysosomal proton pump activity: supravital cell staining with acridine orange differentiates leukocyte subpopulations. Methods Cell Biol. 1994;41:185–194. [DOI] [PubMed] [Google Scholar]
- 26. Neukomm LJ, Freeman MR. Diverse cellular and molecular modes of axon degeneration. Trends Cell Biol. 2014;24:515–523. [DOI] [PMC free article] [PubMed] [Google Scholar]
- 27. Elibol‐Can B, Kilic E, Yuruker S, Jakubowska‐Dogru E. Investigation into the effects of prenatal alcohol exposure on postnatal spine development and expression of synaptophysin and PSD95 in rat hippocampus. Int J Dev Neurosci. 2014;33:106–114. [DOI] [PubMed] [Google Scholar]
- 28. Panayotis N, Karpova A, Kreutz MR, Fainzilber M. Macromolecular transport in synapse to nucleus communication. Trends Neurosci. 2015;38:108–116. [DOI] [PubMed] [Google Scholar]
- 29. Wang X, Sterne GR, Ye B. Regulatory mechanisms underlying the differential growth of dendrites and axons. Neurosci Bull. 2014;30:557–568. [DOI] [PMC free article] [PubMed] [Google Scholar]
- 30. Carlsson SR, Simonsen A. Membrane dynamics in autophagosome biogenesis. J Cell Sci. 2015;128:193–205. [DOI] [PubMed] [Google Scholar]
- 31. Miki Y, Tanji K, Mori F, et al. Alteration of upstream autophagy‐related proteins (ULK1, ULK2, Beclin1, VPS34 and AMBRA1) in lewy body disease. Brain Pathol. 2016;26:359–370. [DOI] [PMC free article] [PubMed] [Google Scholar]
- 32. Li H, Peng X, Wang Y, et al. Atg5‐mediated autophagy deficiency in proximal tubules promotes cell cycle G2/M arrest and renal fibrosis. Autophagy. 2016;12:1–15. [DOI] [PMC free article] [PubMed] [Google Scholar]
- 33. Tanida I, Minematsu‐Ikeguchi N, Ueno T, Kominami E. Lysosomal turnover, but not a cellular level, of endogenous LC3 is a marker for autophagy. Autophagy. 2005;1:84–91. [DOI] [PubMed] [Google Scholar]
- 34. Wang Z, Zhang J, Wang Y, et al. Matrine, a novel autophagy inhibitor, blocks trafficking and the proteolytic activation of lysosomal proteases. Carcinogenesis. 2013;34:128–138. [DOI] [PubMed] [Google Scholar]
- 35. Mizushima N, Levine B, Cuervo AM, Klionsky DJ. Autophagy fights disease through cellular self‐digestion. Nature. 2008;451:1069–1075. [DOI] [PMC free article] [PubMed] [Google Scholar]
- 36. Komatsu M, Wang QJ, Holstein GR, et al. Essential role for autophagy protein Atg7 in the maintenance of axonal homeostasis and the prevention of axonal degeneration. Proc Natl Acad Sci USA. 2007;104:14489–14494. [DOI] [PMC free article] [PubMed] [Google Scholar]
- 37. Hernandez D, Torres CA, Setlik W. Regulation of presynaptic neurotransmission by macroautophagy. Neuron. 2012;74:277–284. [DOI] [PMC free article] [PubMed] [Google Scholar]
Associated Data
This section collects any data citations, data availability statements, or supplementary materials included in this article.
Supplementary Materials