

Microsoft Kinect is a virtual reality system that has become increasingly used in the area of computer‐assisted medical treatment due to its lower costs and nonintrusive techniques. Kinect can help physicians explore the field of body recognition and subjects’ motor function. Tupa et al.1 used normalized stride length (SL) and gait velocity (GV) for recognition and achieved a high accuracy rate of 97.2%.
The present study used the Kinect system to analyze the gait of healthy individuals and patients with stroke and Parkinson's disease (PD) based on normalized SL, and relationships with clinical scales of stroke or PD were explored to investigate potential candidate parameters for the assessment of patients based on the condition of their illness.
This study was approved by the local ethics committees. The present study recruited 14 subjects in each group (a healthy group, PD group, and stroke group). The skeleton models of all subjects were normalized to the same size in terms of location, scale, and view by computer technology. Inclusion criteria for patients with PD or stroke were strictly based on the diagnosis criteria of the ability to be independently mobile without a walking aid while indoors. The clinical conditions of patients with stroke with hemiplegia were assessed with the Fugl‐Meyer score of lower extremity (FMA‐L), and those of patients with PD were assessed with the Unified PD Rating Scale (UPDRS), which is composed of four parts.2 Comprehensive neurological examinations and clinical assessments were performed for each subject prior to gait acquisition. A single Kinect camera fixed at a height of 1.0 m with a depth of field of 4.5 m was placed in front of the subjects as they performed walking sequences to record and collect the accurate data on their motions. Each subject was asked to walk back and forth in front of the camera five times at their most comfortable speed and manner without any other active movements of the limbs or trunk. Ultimately, a person‐centric coordinate system that used the hip center as the origin was built to represent the joints. Six complete continuous steps were collected by Kinect and used to capture depth images of walking subjects, and data were acquired to compute a coherent skeleton in time that tracked 25 joints in the body.3 The skeleton size of each subject was normalized to a standard skeleton without changing the joint angles. Additionally, each body connection map, particularly for leg length, was measured via Kinect. The formula of the distance between joints i and j was structured with the Euclidean distance formula, where i and j represent any two joints of the body. Statistical analyses were performed using SPSS 21.0 (SPSS Inc., Chicago, IL, USA).
In patients with stroke with hemiplegia, the normalized SL had a strong correlation with the FMA‐L scores (r=.815, P=.000). In patients with PD, the normalized SL was significantly correlated with the UPDRS scores (r=−.768, P=.001) as well as the UPDRS‐II (r=−.747, P=.002) and the UPDRS‐III (r=−.769, P=.001) subscale scores (Figure 1). The UPDRS‐I and IV subscales scores were not significantly correlated with SL (r=.262, P=.365 and r=−.043, P=.884, respectively), as the former scale indicates nonmotor aspects of daily living and the latter subscale measures motor complications.
Figure 1.
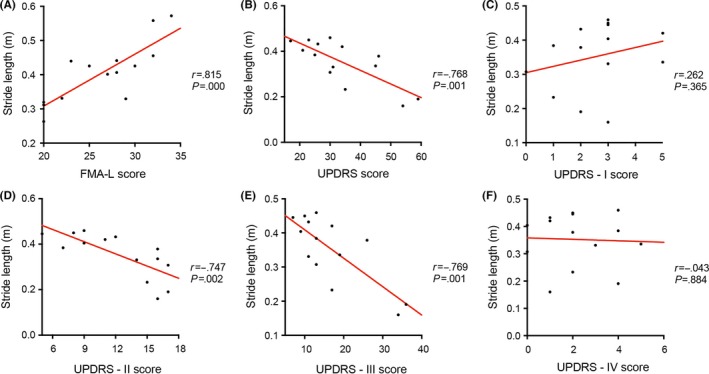
Scatterplots of the SL values for patients with stroke (A) or PD (B‐F) by estimating clinical scores
To more clearly demonstrate the characteristics of SL in each group, a normal subject, a PD patient who scored 59 on the UPDRS, and a stroke patient with hemiplegia that scored 20 on the FMA‐L were selected to determine the trajectories of the distance between the feet. These two patients (PD and stroke) had illnesses that were the most serious in their respective groups. The wave crests in the curve figures represent the SL of each step (Figure 2A). The wave crests of normal subjects were higher than those of the stroke patients, and the wave crests of the PD patients were the lowest of the three groups. The three levels of conditions for each experimental group are provided in Figure 2B,C; a score of 20 on the FMA‐L and a score of 17 on the UPDRS were the lowest scores in the stroke and PD groups, respectively. As the illness conditions that were determined with the FMA‐L and UPDRS worsened, the SL progressively decreased. Furthermore, there were larger significant differences in SL values between the affected and normal sides as the illness condition became more serious (Figure 2D‐E, red arrows).
Figure 2.

Curve figures of the distance between feet. The wave crests represent the SL of each step. (A) Three types of kinematic features from the subjects. (B) and (C) Characteristic trajectories of the serious, moderate, and mild conditions in the stroke and PD group. (D) The most serious patient in the stroke group; the wave crests of the affected side (indicated by the red arrow) are significantly lower than those of the normal side. (E) A moderate patient in the stroke group; the difference between the affected and normal sides is less than in the most serious stroke patient (D)
This present study evaluated patients with PD and stroke for the purposes of measuring and assessing illness conditions with the Kinect sensor tool. Based on the covariance matrices provided by our research partners, the Kinect system has the potential to be a low‐cost home‐based tool that can be used for recognition purposes in stroke and PD patients as well as healthy individuals.4 Additionally, this system may be useful as a readily available computer‐assisted tool in community hospitals to aid physicians in the primary diagnosis of a patient. However, because stroke and PD have unique characteristics associated with their respective onsets, the priorities for physicians in a clinical setting remain the assessment of a patient's illness condition after a passing crisis, the prescription of medications and/or rehabilitation exercises, and/or the discharge of the patient.
The clinical manifestations of stroke vary, but the primary symptoms include a disturbance in consciousness, cranial nerve symptoms, cross‐body hemiplegia, and/or bilateral paralysis. Recently, an increasing number of studies have investigated the usefulness of virtual reality games for patients with disabilities. For example, virtual reality training and ergometer training effectively improve balance, gait abilities, depression, and interpersonal relationships in stroke patients.5 A virtual reality platform was recently developed to aid in the assessment and rehabilitation of cognitive deficits in stroke patients.6 This platform analyzes performance in different grasping tasks, which allows for the evaluation of a patient's ability to locate and handle objects with both sides of the body in a virtual space. Han et al.7, 8 developed the Upper Extremity Reachable Workspace Protocol for the assessment of motor function in the upper extremities of patients with dystrophinopathy and facioscapulohumeral muscular dystrophy (FSHD). These authors used the Brooke scale for dystrophinopathy and the FSHD evaluation subscales II+III to assess patients and found that the upper quadrant relative surface area (RSA) scores decreased as upper extremity function worsened.
Kinect has a relatively accurate measurement as shown by formal studies had showed3; the present study therefore attempted to identify a simpler and easily available parameter to use to perform clinical assessments. Normalized SL and GV have been used to distinguish among PD patients, healthy adults, and young students,1 so these measures represent accessible and measureable parameters. The primary finding of the present study, even if it seems relatively simple, was that SL had a strong clinical significance. The SL values of the normal group differed significantly from those of the two patient groups, but this parameter was not able to definitively distinguish stroke patients from PD patients. However, the SL parameter has the potential to be useful for the assessment of illness conditions in patients because the results of the present study revealed that SL progressively decreased as the illness condition worsened. The present study also indicated that there was a larger difference between the SL of the affected side and the SL of the normal side of the body as the seriousness of the illness condition increased in stroke patients. Previous studies have shown that the UPDRS‐III (motor examination) is a well‐validated tool for the measurement of the severity of motor disabilities in PD patients.2 The present results are in agreement with these findings: they showed that SL was correlated with scores on the UPDRS, UPDRS‐II, and UPDRS‐III. The UPDRS‐III is the most relevant subscale for the present study. In general, SL has the potential to be an appropriate and readily available index of PD patients in terms of disease evaluation and prognosis. However, in stroke patients, SL may be appropriate only for the assessment of motor function in the lower extremities.
Conflict of Interest
The authors declare no conflict of interest.
References
- 1. Tupa O, Prochazka A, Vysata O, et al. Motion tracking and gait feature estimation for recognising Parkinson's disease using MS Kinect. Biomed Eng Online. 2015;14:97. [DOI] [PMC free article] [PubMed] [Google Scholar]
- 2. Goetz CG, Tilley BC, Shaftman SR, et al. Movement Disorder Society‐sponsored revision of the Unified Parkinson's Disease Rating Scale (MDS‐UPDRS): scale presentation and clinimetric testing results. Mov Disord. 2008;23:2129‐2170. [DOI] [PubMed] [Google Scholar]
- 3. Clark RA, Vernon S, Mentiplay BF, et al. Instrumenting gait assessment using the Kinect in people living with stroke: reliability and association with balance tests. J Neuroeng Rehabil. 2015;12:15. [DOI] [PMC free article] [PubMed] [Google Scholar]
- 4. Li Q, Wang Y, Sharf A, et al. Classification of gait anomalies from kinect. Visual Compute. 2016;1‐13. [Google Scholar]
- 5. Song GB, Park EC. Effect of virtual reality games on stroke patients’ balance, gait, depression, and interpersonal relationships. J Phys Ther Sci. 2015;27:2057‐2060. [DOI] [PMC free article] [PubMed] [Google Scholar]
- 6. Cipresso P, Serino S, Pedroli E, et al. A virtual reality platform for assessment and rehabilitation of neglect using a kinect. Stud Health Technol Inform. 2014;196:66‐68. [PubMed] [Google Scholar]
- 7. Han JJ, Kurillo G, Abresch RT, et al. Reachable workspace in facioscapulohumeral muscular dystrophy (FSHD) by Kinect. Muscle Nerve. 2015;51:168‐175. [DOI] [PMC free article] [PubMed] [Google Scholar]
- 8. Han JJ, Kurillo G, Abresch RT, et al. Upper extremity 3‐dimensional reachable workspace analysis in dystrophinopathy using Kinect. Muscle Nerve. 2015;52:344‐355. [DOI] [PMC free article] [PubMed] [Google Scholar]