

Summary
Aims
To investigate the effects of levodopa on the basal ganglia motor circuit (BGMC) in Parkinson's disease (PD).
Methods
Thirty PD patients with asymmetrical bradykinesia and 30 control subjects were scanned using resting‐state functional MRI. Functional connectivity of the BGMC was measured and compared before and after levodopa administration in patients with PD. The correlation between improvements in bradykinesia and changes in BGMC connectivity was examined.
Results
In the PD‐off state (before medication), the posterior putamen and internal globus pallidus (GPi) had decreased connectivity while the subthalamic nucleus (STN) had enhanced connectivity within the BGMC relative to control subjects. Levodopa administration increased the connectivity of posterior putamen‐ and GPi‐related networks but decreased the connectivity of STN‐related networks. Improvements in bradykinesia were correlated with enhanced connectivity of the posterior putamen‐cortical motor pathway and with decreased connectivity of the STN‐thalamo‐cortical motor pathway.
Conclusion
In PD patients with asymmetrical bradykinesia, levodopa can partially normalize the connectivity of the BGMC with a larger effect on the more severely affected side. Moreover, the beneficial effect of levodopa on bradykinesia is associated with normalization of the striato‐thalamo‐cortical motor and STN‐cortical motor pathways. Our findings inform the neural mechanism of levodopa treatment in PD.
Keywords: Basal ganglia motor circuit, Bradykinesia, Connectivity, Levodopa, Parkinson's disease
Introduction
Parkinson's disease (PD) is a progressive neurodegenerative disease that is characterized by bradykinesia, rigidity, postural instability, and tremor. Levodopa is the most effective medication for the management of PD symptoms 1. Previous neuroimaging studies have shown that dopaminergic depletion in PD is accompanied by dysfunction of the basal ganglia motor circuit (BGMC), resulting in hypoactivation of the supplementary motor area (SMA) and striatum 2, 3, 4 as well as decreased connectivity of the striato‐thalamo‐cortical motor pathways 5, 6, 7. Levodopa treatment has been reported to normalize the function of the BGMC (e.g., by enhancing neural activity in the SMA and striatum) 2, 8, 9, 10, 11, 12 and restore striato‐cortical motor pathway connectivity 13, 14, 15 in a manner associated with improvements in motor function 2, 8, 10. Deep brain stimulation (DBS) is another effective therapy for PD that has been shown to modulate the activity 16 and connectivity 17 of the BGMC in association with symptom improvements.
While the abovementioned studies demonstrate that the effects of levodopa on the BGMC are critical to its therapeutic effects in PD, the mechanism by which levodopa modulates the BGMC is unclear. Most previous neuroimaging studies have focused on striatum‐related networks, such that the effects of levodopa on other critical basal ganglia motor pathways (e.g., the subthalamic nucleus [STN]‐cortical motor pathway or the internal globus pallidus [GPi]‐thalamo‐cortical motor pathway) 18 have not been well investigated. In the current study, we used resting‐state functional MRI (RS‐fMRI) to evaluate the functional connectivity of the putamen, STN, and GPi in patients with PD and control subjects. Our aim was to explore the mechanism by which levodopa modulates the functional connectivity of the BGMC and moreover to determine which pathway alterations are associated with the improvement of bradykinesia as a parkinsonian motor symptom. Based on the asymmetry of symptom manifestation in our cohort, we hypothesized that levodopa would modulate the connectivity of BGMC in an asymmetrical manner and that the beneficial effect of levodopa on bradykinesia would be associated with the normalization of certain BGMC circuits, such as the striato‐thalamo‐cortical and/or STN‐cortical pathways. A more complete understanding of the effect of levodopa on the BGMC will inform the neural mechanisms of levodopa treatment and future therapeutic development for PD.
Methods
Subjects
We examined 36 patients with idiopathic PD and 34 age‐ and gender‐matched healthy control subjects. The diagnosis of PD was based on the UK Parkinson's Disease Society Brain Bank Clinical Diagnostic Criteria 19. Patients were assessed using the Movement Disorder Society revision of the Unified Parkinson's Disease Rating Scale (MDS‐UPDRS) 20, the Hoehn and Yahr disability scale 21, and the Mini‐Mental State Examination while off their medication. Mini‐Mental State Exam scores were ≥27 in all subjects. The MDS‐UPDRS motor section (part III) was evaluated for both the “on” and “off” states. Bradykinesia was the predominant symptom and was more severe on the right side in all patients. The bradykinesia subscale included the following six items: finger taps (left and right), hand movements (left and right), pronation–supination movement of the hands (left and right), toe tapping (left and right), leg agility (left and right), and body bradykinesia. Each item was rated 0–4 with 0 representing the absence of a given symptom and 4 denoting the highest possible severity of a given symptom. All patients had, at most, a mild tremor and were taking levodopa. Some patients were also regularly taking other anti‐parkinsonian drugs such as COMT inhibitors (n = 7), MAO‐B inhibitors (n = 11), and dopamine agonists (n = 13). For these medications, levodopa equivalent daily doses were calculated according to recognized standardized formulae 22. Age‐ and gender‐matched healthy control subjects were all right‐handed according to the Edinburgh inventory 23.
In total, six patients with PD and four control subjects were excluded due to excessive head motion during fMRI acquisition. The demographics and clinical details of the remaining 30 patients with PD and 30 control subjects are shown in Table 1. All experiments were performed in accordance with the Declaration of Helsinki and the protocol was approved by the Institutional Review Board of Xuanwu Hospital. All subjects provided written informed consent for participation in the study.
Table 1.
Demographics and clinical characteristics of the subjects (mean ± SD)
| PD group | Control group | P value | |
|---|---|---|---|
| Age (years) | 65.3 ± 7.6 (48–76) | 65.2 ± 7.3 (50–76) | 0.986 |
| Sex | 12 female, 18 male | 12 female, 18 male | 1.000 |
| Disease duration (years) | 4.9 ± 2.6 | N/A | |
| MDS‐UPDRS III (off) | 27.8 ± 9.1 | N/A | |
| MDS‐UPDRS III (on) | 13.6 ± 8.1 | N/A | |
| Hoehn and Yahr staging | 1.9 ± 0.3 | N/A | |
| Bradykinesia subscale (off) | 14.9 ± 4.9 | N/A | |
| Right side | 10.8 ± 3.0 | ||
| Left side | 3.8 ± 1.9 | ||
| Bradykinesia subscale (on) | 5.6 ± 3.3 | N/A | |
| Right side | 4.1 ± 2.5 | ||
| Left side | 1.5 ± 1.0 | ||
| Mini‐mental state examination | 29.2 ± 1.0 | 29.5 ± 0.8 | 0.205 |
| Levodopa equivalent daily dose (mg) | 443.3 ± 141.8 | N/A |
Age and MMSE were analyzed with a two‐sample t‐test; gender was analyzed with a chi‐square test. MDS‐UPDRS, Movement Disorder Society‐Unified Parkinson's Disease Rating Scale.
fMRI Procedure
fMRI was performed using a 3T MRI scanner (Trio system; Siemens Magnetom scanner, Erlangen, Germany). High‐resolution anatomical images were acquired with the 3D‐MPRAGE sequence (repetition time [TR] = 2000 ms, echo time [TE] = 2.19 ms, 176 sagittal slices, slice thickness = 1 mm, field of view = 224 mm × 256 mm). Blood oxygen level‐dependent data were acquired with gradient‐echo echo‐planar sequences (TR = 2000 ms, TE = 40 ms, 33 axial slices, slice thickness = 3.5 mm, no gap, flip angle = 90°, field of view = 256 mm × 256 mm, matrix size = 64 × 64). During RS‐fMRI scanning, subjects were instructed to keep their eyes closed, to remain motionless, and not to think of anything deliberately.
Healthy control subjects were scanned once, whereas patients with PD were scanned twice (once in the “off” state and once in the “on” state). The first scan was performed after medication had been withdrawn for at least 12 h (i.e., the “off” state). After the first scan, patients took their usual dose of levodopa. The second scan was performed when a clinical “on” condition was achieved (i.e., the “on” state). Each RS‐fMRI scanning session lasted for 7 min.
Data Analysis
Preprocessing of fMRI data was carried out using the Data Processing Assistant for Resting‐State fMRI V2.1 (http://www.restfmri.net) 24, which is a MATLAB toolbox for “pipeline” analysis of RS‐fMRI data. A total of 210 data time points were included in each fMRI scan. The first 10 volumes of functional images were discarded to allow for signal equilibrium and participant adaptation to the scanning environment. The remaining data were first slice‐time corrected and aligned to the first image of each session for motion correction. Head motion parameters were evaluated for each subject; excessive head motion was defined as more than 1 mm maximum translation in the x, y, or z plane, or 1° of maximum rotation around these three axes. Functional images were coregistered to high‐resolution anatomical images and underwent spatial normalization into the standard Montreal Neurological Institute (MNI) brain space. This template defines a standard brain based upon a large series of MRI scans from normal control subjects and is commonly used in neuroimaging studies. All images were then resampled into 3 mm3 voxels and smoothed with a 4 mm full width at half maximum Gaussian smoothing kernel. Cerebrospinal fluid signal, nuisance covariates of head motion parameters, and white matter signal were regressed out. Then, we subsequently removed linear drift; a temporal filter (0.01 Hz < f < 0.08 Hz) was applied to remove very low‐frequency drifts and physiological high‐frequency noise.
Since functional connectivity analyses are sensitive to gross head motion 25, head motion parameters were also evaluated with the mean framewise displacement (FD) method 26, averaged for each subject, and then compared among groups using an ANOVA.
Regions of Interest (ROIs)
The bilateral putamen, STN, and GPi were chosen as ROIs for the functional connectivity analysis, as these regions are critical in the BGMC 18. The putamen is divided into anterior and posterior portions by the anterior commissure. As the posterior putamen is a sensorimotor area 27 where dopaminergic neurons are heavily degenerated in PD 28, the bilateral posterior putamen was included in our analysis. The MNI coordinates of the left and right posterior putamen were [−30, −5, 2] and [30, −5, 2], respectively 29. The centers of the left and right STN were [−11, −13, −7] and [12, −13, −7], respectively, according to a recent study that defined the STN using T2*‐weighted images 30 and a previous fMRI study of PD 31. The centers of the left and right GPi were [−18, −6, −3] and [19, −6, −2], respectively 32. The radius for each ROI was 3 mm.
Functional Connectivity Analysis
Functional connectivity was analyzed using the REST Toolkit (http://restfmri.net/forum/REST_V1.8) 33. A seed reference time course was obtained within each ROI. Correlation analyses were conducted on the seed reference and the whole brain in a voxel‐wise manner for each ROI. Individual correlation coefficients were further transformed to z‐values using the Fisher r‐to‐z transformation. Individual results were then entered into a random effects one‐sample t‐test to identify brain regions displaying significant connectivity with each ROI.
We used an ANCOVA to examine differences in connectivity for each ROI among control, PD‐off, and PD‐on conditions. Subsequently, a two‐sample post hoc test analysis was applied to explore differences between conditions for each ROI (within a mask showing group differences in the ANCOVA). For each patient, differences in functional connectivity between the PD‐off and PD‐on conditions for each ROI (ΔFC) were calculated using the Image Calculator in the REST Toolkit. A correlation analysis of ΔFC values against differences in bradykinesia subscale scores between the PD‐off and PD‐on conditions was performed to probe the relationship between improvements in bradykinesia and modulation of the BGMC. In the current study, all results were false discovery rate (FDR)‐corrected. The extent threshold was 10 voxels.
Results
Head Motion
Head motion parameters evaluated with the FD method were 0.127 ± 0.052 (range 0.034–0.211) mm in the control group, 0.145 ± 0.061 (range 0.042–0.287) mm in the PD‐off condition, and 0.136 ± 0.058 (range 0.054–0.264) mm in the PD‐on condition. No significant differences were found in head motion among these conditions (P = 0.461).
The STN
In all groups, the bilateral STN was positively connected with the pons, bilateral midbrain, bilateral cerebellum, bilateral thalamus, bilateral striatum, bilateral globus pallidus, bilateral temporal cortex, bilateral M1, bilateral PMC, bilateral parietal cortex, SMA, anterior cingulate cortex, and bilateral middle frontal gyrus; the bilateral STN was negatively connected with the bilateral occipital lobes (one‐sample t‐test, P < 1 × 10⁻⁵, FDR‐corrected; Figure 1A).
Figure 1.
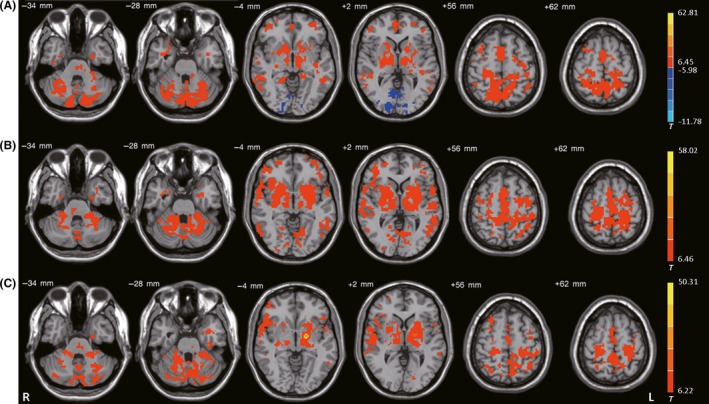
Functional connectivity among the 3 ROIs. Brain regions showing significant connectivity with the (A) left subthalamic nucleus, (B) left posterior putamen, and (C) left internal globus pallidus in healthy control subjects (one‐sample t‐test, P < 1 × 10⁻⁵, FDR‐corrected). T‐value bar is shown on the right. Warm and cold tones indicate positive and negative connectivity with the ROIs, respectively. L, left; R, right.
The left STN had different connectivity with the pons, midbrain, bilateral cerebellum, bilateral M1, bilateral PMC, SMA, bilateral postcentral gyrus, and left inferior parietal cortex among the control, PD‐off, and PD‐on conditions (ANCOVA, P < 0.05, FDR‐corrected; Figure 2A). Compared with the controls, the PD‐off condition exhibited increased connectivity of the left STN with the pons, midbrain, bilateral cerebellum, bilateral M1, bilateral PMC, SMA, and bilateral postcentral gyrus (post hoc analysis, P < 0.05, FDR‐corrected; Figure 2B). Compared with the PD‐off condition, the PD‐on condition exhibited decreased connectivity with the bilateral cerebellum, bilateral M1, SMA, left PMC, and left postcentral gyrus (post hoc analysis, P < 0.05, FDR‐corrected; Figure 2C and Table 2).
Figure 2.
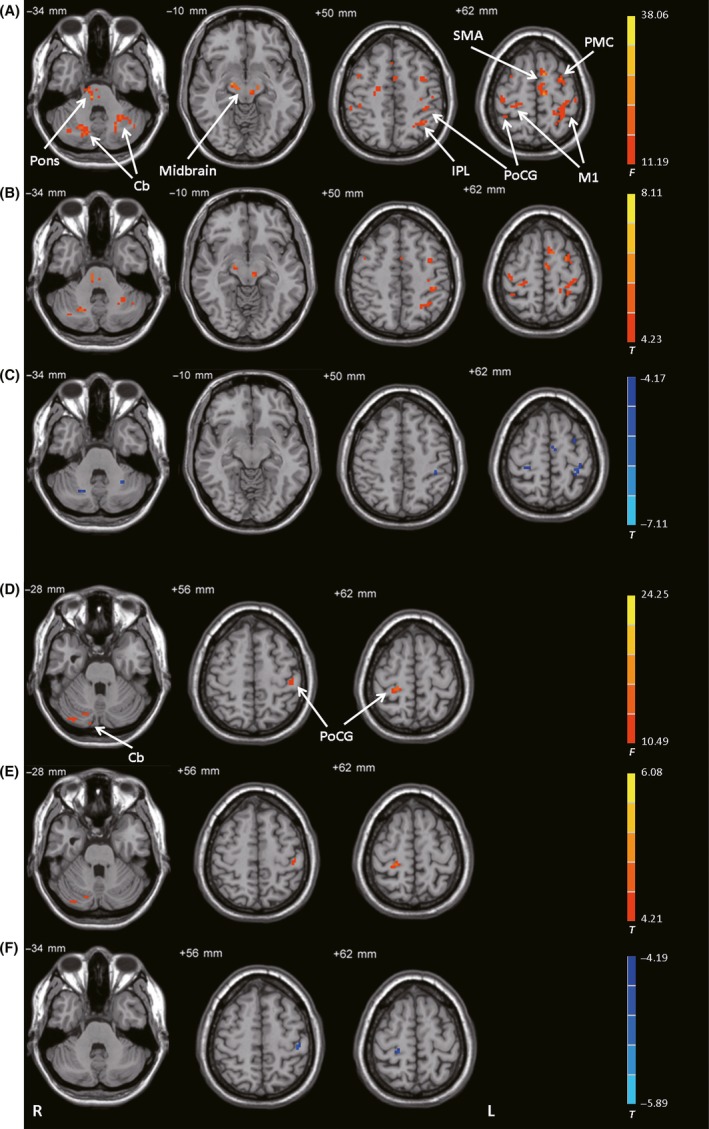
Connectivity with the STN. (A) Brain regions showing significant differences in connectivity with the left STN among control subjects, patients with PD before levodopa administration (PD‐off), and patients with PD after levodopa administration (PD‐on) (ANCOVA, P < 0.05, FDR‐corrected). (B) Increased connectivity with the left STN in the PD‐off condition versus the control condition (post hoc analysis, P < 0.05, FDR‐corrected). (C) Decreased connectivity with the left STN in the PD‐on condition versus the PD‐off condition (post hoc analysis, P < 0.05, FDR‐corrected). (D) Brain regions showing significant differences in connectivity with the right STN among the control, PD‐off, and PD‐on conditions (ANCOVA, P < 0.05, FDR‐corrected). (E) Increased connectivity with the right STN in the PD‐off condition versus the control condition (post hoc analysis, P < 0.05, FDR‐corrected). (F) Decreased connectivity with the right STN in the PD‐on condition versus the PD‐off condition (post hoc analysis, P < 0.05, FDR‐corrected). The warm and cold tones indicate increases and decreases in connectivity, respectively. F‐ or T‐value bars are shown on the right. Cb, cerebellum; IPL, inferior parietal lobule; L, left; M1, primary motor cortex; PMC, premotor cortex; PoCG, postcentral gyrus; R, right; SMA, supplementary motor area.
Table 2.
The effect of levodopa on network connectivity in PD
| ROI | Brain region | Brodmann area | MNI coordinates | T‐value | Cluster size (mm3) | ||
|---|---|---|---|---|---|---|---|
| x | y | z | |||||
| L STN | |||||||
| On<Off | L Cerebellum, Anterior Lobe, Culmen | −28 | −53 | −34 | −5.03 | 432 | |
| R Cerebellum, Anterior Lobe, Culmen | 23 | −64 | −32 | −5.29 | 567 | ||
| L Postcentral Gyrus | 3 | −39 | −33 | 51 | −5.62 | 378 | |
| L M1 | 4 | −35 | −30 | 63 | −7.11 | 1026 | |
| R M1 | 4 | 28 | −30 | 61 | −6.58 | 540 | |
| L SMA | 6 | −3 | −6 | 64 | −5.78 | 432 | |
| L PMC | 6 | −30 | −2 | 61 | −6.16 | 486 | |
| R STN | |||||||
| On<Off | L Postcentral Gyrus | 3 | −42 | −28 | 56 | −5.89 | 648 |
| R Postcentral Gyrus | 3 | 24 | −32 | 64 | −5.36 | 540 | |
| L PPu | |||||||
| On>Off | L Cerebellum, Anterior Lobe, Culmen | −20 | −60 | −32 | 5.42 | 567 | |
| R Cerebellum, Anterior Lobe, Culmen | −21 | −58 | −34 | 5.57 | 702 | ||
| L Lateral Globus Pallidus | −14 | 4 | −6 | 6.15 | 864 | ||
| R Lateral Globus Pallidus | 17 | 0 | −3 | 8.35 | 1296 | ||
| L Putamen | −30 | 4 | −2 | 5.94 | 756 | ||
| R Putamen | 31 | −5 | −2 | 6.01 | 351 | ||
| L M1 | 4 | −31 | −34 | 61 | 6.41 | 1053 | |
| L SMA | 6 | −2 | 20 | 62 | 5.88 | 972 | |
| R PPu | |||||||
| On>Off | R Putamen | 31 | 1 | −2 | 4.78 | 351 | |
| R SMA | 1 | 5 | 61 | 5.02 | 297 | ||
| L GPi | |||||||
| On>Off | L Cerebellum, Posterior Lobe, Declive | −29 | −85 | −28 | 4.84 | 324 | |
| R Thalamus, Ventral Lateral Nucleus | 13 | −11 | 4 | 7.02 | 864 | ||
| L Thalamus, Ventral Lateral Nucleus | −12 | −12 | 2 | 7.69 | 1134 | ||
| L Putamen | −30 | −11 | 2 | 4.48 | 297 | ||
| R Superior Parietal Lobule | 7 | 33 | −54 | 54 | 6.26 | 783 | |
| L Paracentral Lobule | 3 | −14 | −39 | 58 | 6.44 | 648 | |
| L M1 | 4 | −30 | −34 | 59 | 5.28 | 378 | |
| L Superior Parietal Lobule | 7 | −37 | −59 | 54 | 4.37 | 297 | |
| R Paracentral Lobule | 3 | 9 | −41 | 63 | 5.11 | 378 | |
| L Postcentral Gyrus | 2 | −42 | −41 | 64 | 5.24 | 351 | |
| L Precentral Gyrus | 4 | −22 | −23 | 59 | 5.47 | 324 | |
| R GPi | |||||||
| On>Off | L Pons | −3 | −22 | −30 | 5.01 | 297 | |
| R Thalamus, Ventral Lateral Nucleus | 8 | −12 | 2 | 4.59 | 324 | ||
| L Thalamus, Ventral Lateral Nucleus | −12 | −12 | 4 | 7.14 | 999 | ||
| L Inferior Parietal Lobule | 40 | −27 | −44 | 57 | 4.82 | 324 | |
GPi, internal globus pallidus; L, left; M1, primary motor cortex; MNI, Montreal Neurological Institute; PMC, premotor cortex; PPU, posterior putamen; R, right; SMA, supplementary motor area; STN, subthalamic nucleus. Results are the comparison of functional connectivity in ROIs between the PD‐on and PD‐off conditions (two‐sample post hoc t‐test, P < 0.05, FDR‐corrected).
The right STN had different connectivity with the bilateral postcentral gyrus and right cerebellum among the control, PD‐off, and PD‐on conditions (ANCOVA, P < 0.05, FDR‐corrected; Figure 2D). Compared with the controls, the PD‐off condition exhibited increased connectivity with the bilateral postcentral gyrus and right cerebellum (post hoc analysis, P < 0.05, FDR‐corrected; Figure 2E). Compared with the PD‐off condition, the PD‐on condition exhibited decreased connectivity with the bilateral postcentral gyrus (post hoc analysis, P < 0.05, FDR‐corrected; Figure 2F and Table 2).
The Posterior Putamen
In all groups, the bilateral posterior putamen was positively connected with the pons, bilateral midbrain, bilateral cerebellum, bilateral thalamus, bilateral striatum, bilateral globus pallidus, bilateral temporal cortex, bilateral M1, bilateral PMC, bilateral parietal cortex, SMA, bilateral middle frontal gyrus, and bilateral occipital lobes (one‐sample t‐test, P < 1 × 10⁻⁵, FDR‐corrected; Figure 1B).
The left posterior putamen had different connectivity with the pons, midbrain, bilateral cerebellum, bilateral putamen, bilateral globus pallidus, bilateral M1, bilateral precentral gyrus, SMA, bilateral inferior parietal lobule, and right superior parietal cortex among the control, PD‐off, and PD‐on conditions (ANCOVA, P < 0.05, FDR‐corrected; Figure 3A). Compared with the control condition, the PD‐off condition exhibited decreased connectivity with the left posterior putamen in the pons, bilateral cerebellum, bilateral putamen, bilateral globus pallidus, bilateral M1, left precentral gyrus, SMA, bilateral inferior parietal lobule, and right superior parietal cortex (post hoc analysis, P < 0.05, FDR‐corrected; Figure 3B). Compared with the PD‐off condition, the PD‐on condition exhibited increased connectivity with the bilateral cerebellum, bilateral putamen, bilateral globus pallidus, left M1, and SMA (post hoc analysis, P < 0.05, FDR‐corrected; Figure 3C and Table 2).
Figure 3.
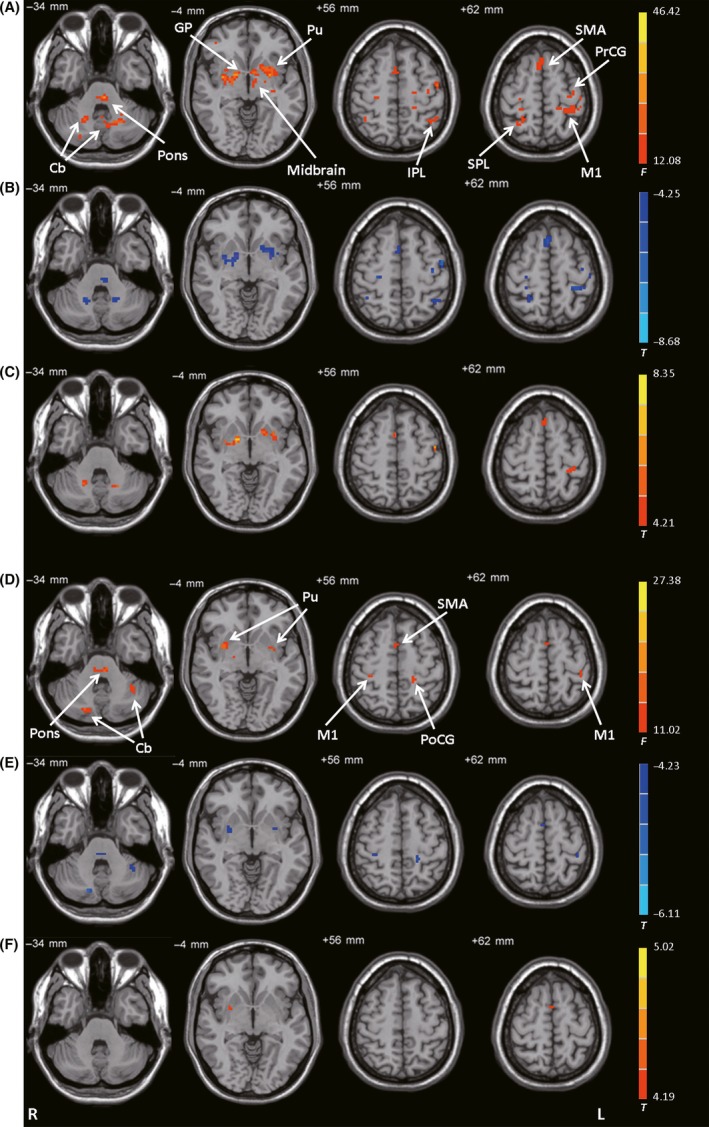
Connectivity with the posterior putamen. (A) Brain regions showing significant differences in connectivity with the left posterior putamen among the control, PD‐off, and PD‐on conditions (ANCOVA, P < 0.05, FDR‐corrected). (B) Decreased connectivity with the left posterior putamen in the PD‐off condition versus the control condition (post hoc analysis, P < 0.05, FDR‐corrected). (C) Increased connectivity with the left posterior putamen in the PD‐on condition versus the PD‐off condition (post hoc analysis, P < 0.05, FDR‐corrected). (D) Brain regions showing significant differences in connectivity with the right posterior putamen among the control, PD‐off, and PD‐on conditions (ANCOVA, P < 0.05, FDR‐corrected). (E) Decreased connectivity with the right posterior putamen in the PD‐off condition versus the control condition (post hoc analysis, P < 0.05, FDR‐corrected). (F) Increased connectivity with the right posterior putamen in the PD‐on condition versus the PD‐off condition (post hoc analysis, P < 0.05, FDR‐corrected). F‐ or T‐ value bars are shown on the right. Cb, cerebellum; GP, globus pallidus; IPL, inferior parietal lobule; L, left; M1, primary motor cortex; PoCG, postcentral gyrus; PrCG, precentral gyrus; Pu, putamen; R, right; SMA, supplementary motor area; SPL, superior parietal lobule.
The right posterior putamen had different connectivity with the pons, bilateral cerebellum, bilateral putamen, bilateral M1, SMA, and left postcentral gyrus among the control, PD‐off, and PD‐on conditions (ANCOVA, P < 0.05, FDR‐corrected; Figure 3D). Compared with the control condition, the PD‐off condition exhibited decreased connectivity with the pons, bilateral cerebellum, bilateral putamen, bilateral M1, SMA, and left postcentral gyrus (post hoc analysis, P < 0.05, FDR‐corrected; Figure 3E). Compared with the PD‐off condition, the PD‐on condition exhibited increased connectivity with the right putamen and SMA (post hoc analysis, P < 0.05, FDR‐corrected; Figure 3F and Table 2).
The GPi
In all groups, the bilateral GPi was positively connected with the pons, bilateral midbrain, bilateral cerebellum, bilateral thalamus, bilateral striatum, bilateral globus pallidus, bilateral temporal cortex, bilateral M1, bilateral PMC, SMA, bilateral parietal cortex, bilateral middle frontal gyrus, bilateral precuneus, and bilateral posterior cingulate gyrus (one‐sample t‐test, P < 1 × 10⁻⁵, FDR‐corrected; Figure 1C).
The left GPi had different connectivity with the left cerebellum, bilateral thalamus, bilateral globus pallidus, left putamen, bilateral M1, right PMC, bilateral postcentral gyrus, left superior frontal gyrus, bilateral temporal lobe, bilateral paracentral lobule, and bilateral superior parietal cortex among the control, PD‐off, and PD‐on conditions (ANCOVA, P < 0.05, FDR‐corrected; Figure 4A). Compared with the control condition, the PD‐off condition exhibited decreased connectivity with the left cerebellum, right middle temporal gyrus, left posterior putamen, bilateral thalamus, bilateral M1, right PMC, bilateral postcentral gyrus, left superior frontal gyrus, bilateral paracentral lobule, and bilateral superior parietal cortex (post hoc analysis, P < 0.05, FDR‐corrected; Figure 4B). Compared with the PD‐off condition, the PD‐on condition exhibited increased connectivity with the left cerebellum, left posterior putamen, bilateral thalamus, left M1, bilateral paracentral lobule, left postcentral gyrus, and bilateral superior parietal cortex (post hoc analysis, P < 0.05, FDR‐corrected; Figure 4C and Table 2).
Figure 4.
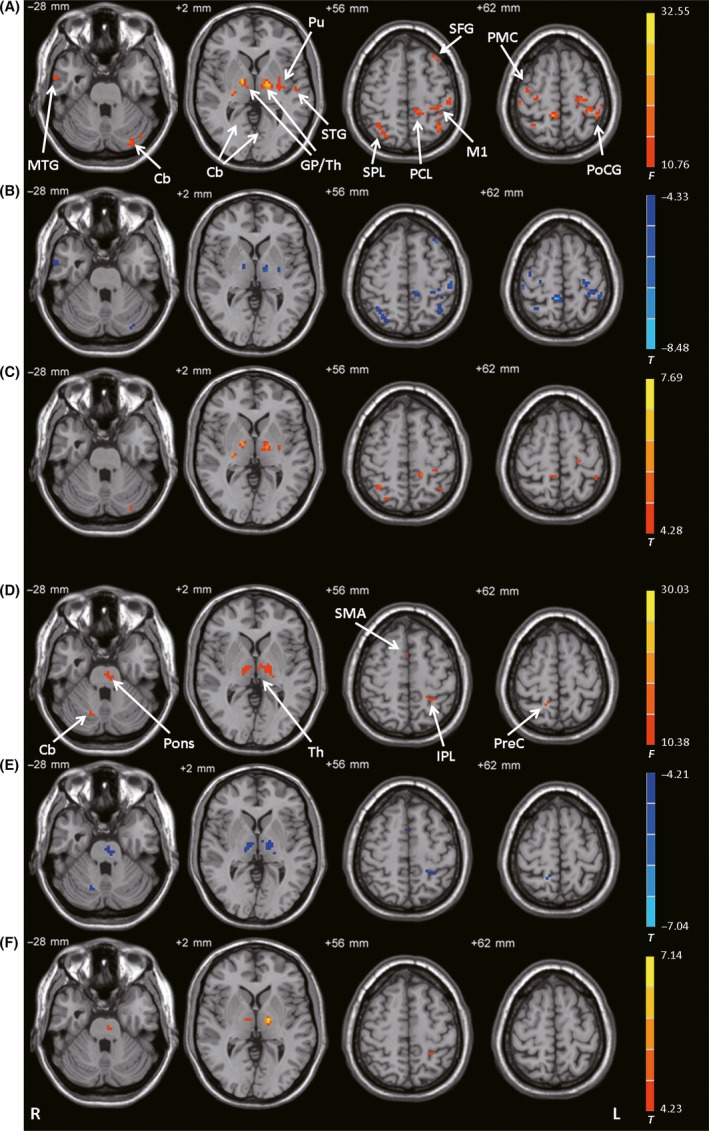
Connectivity with the GPi. (A) Brain regions showing significant differences in connectivity with the left GPi among the control, PD‐off, and PD‐on conditions (ANCOVA, P < 0.05, FDR‐corrected). (B) Decreased connectivity with the left GPi in the PD‐off condition versus the control condition (post hoc analysis, P < 0.05, FDR‐corrected). (C) Increased connectivity with the left GPi in the PD‐on condition versus the PD‐off condition (post hoc analysis, P < 0.05, FDR‐corrected). (D) Brain regions showing significant differences in connectivity with the right GPi among the control, PD‐off, and PD‐on conditions (ANCOVA, P < 0.05, FDR‐corrected). (E) Decreased connectivity with the right GPi in the PD‐off condition versus the control condition (post hoc analysis, P < 0.05, FDR‐corrected). (F) Increased connectivity with the right GPi in the PD‐on condition versus the PD‐off condition (post hoc analysis, P < 0.05, FDR‐corrected). F‐ or T‐value bars are shown on the right. Cb, cerebellum; GP, globus pallidus; IPL, inferior parietal lobule; L, left; M1, primary motor cortex; MTG, middle temporal gyrus; PCL, paracentral lobule; PMC, premotor cortex; PoCG, postcentral gyrus; PreC, precuneus; Pu, putamen; R, right; SMA, supplementary motor area; SPL, superior parietal lobule; STG, superior temporal gyrus; Th, thalamus.
The right GPi had different connectivity with the pons, right cerebellum, bilateral thalamus, SMA, right precuneus, and left inferior parietal lobule among the control, PD‐off, and PD‐on conditions (ANCOVA, P < 0.05, FDR‐corrected; Figure 4D). Compared with the control condition, the PD‐off condition exhibited decreased connectivity with the pons, right cerebellum, bilateral thalamus, SMA, right precuneus, and left inferior parietal lobule (post hoc analysis, P < 0.05, FDR‐corrected; Figure 4E). Compared with the PD‐off condition, the PD‐on condition exhibited increased connectivity with the pons, bilateral thalamus, and left inferior parietal lobule (post hoc analysis, P < 0.05, FDR‐corrected; Figure 4F and Table 2).
Correlation Analysis
A correlation analysis showed that decreased bradykinesia subscale scores in the “on” state relative to the “off” state were positively correlated with the ΔFC between the left posterior putamen and bilateral M1, and negatively correlated with the ΔFC between the left STN and bilateral M1, SMA, and bilateral thalamus (Figure 5). We did not find any significant correlations with the bilateral GPi, right STN, or right posterior putamen.
Figure 5.
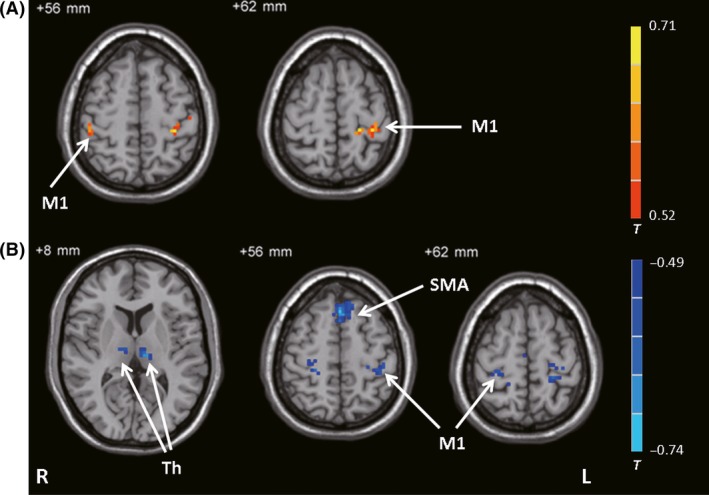
Results of the correlation analysis. Brain regions showing significant correlations with bradykinesia subscale score between the PD‐on and PD‐off conditions against differences in connectivity between the PD‐on and PD‐off conditions (ΔFC) in the left posterior putamen (A) and left STN (B) (correlation analysis, P < 0.05, FDR‐corrected). The warm and cold tones indicate positive and negative correlations, respectively. T‐value bar is shown on the right. L, left; M1, primary motor cortex; R, right; SMA, supplementary motor area; Th, thalamus.
Discussion
Our results showed that levodopa treatment partially normalized the connectivity of the BGMC. A novel finding was that levodopa had asymmetrical effects on the BGMC, with larger effects on the more severely affected side. Moreover, the improvement effect of levodopa on bradykinesia was associated with the normalization of specific basal ganglia motor pathways.
In the “off” state, the posterior putamen and GPi had decreased connectivity, while the STN had enhanced connectivity with extensive brain regions of the BGMC (e.g., M1, SMA, PMC, and thalamus) in patients with PD versus control subjects, which was largely consistent with previous reports 5, 6, 30, 31, 34, 35. As introduced previously, PD‐related neural changes include hypoactivation in the SMA and striatum 2, 3, 4 and decreased connectivity of the striato‐thalamo‐cortical motor pathways 5, 6, 7, 29, 35. According to the classical basal ganglia model, decreased connectivity of the striato‐thalamo‐cortical motor pathway induces increased inhibitory basal ganglia‐thalamo‐cortical output to cortical motor areas, for example, the SMA, which in turn contributes to bradykinesia in PD 18. Another characteristic alteration in neural change in PD is increased STN‐cortical connectivity 30, 31, 34. The STN is a critical node of both indirect and hyperdirect pathways within the BGMC. Enhanced connectivity between the STN and cortical motor areas has been suggested to reflect overactivation of the hyperdirect pathway 31, which may have a pathophysiological role in PD. Meanwhile, hyperactivity in other motor regions such as the PMC, parietal cortex, and cerebellum 3, 36, 37, 38 and strengthened connectivity between the cerebellum and cortical motor regions 5, 39 have been described in PD. Enhanced activity and connectivity are likely a compensatory effect in response to striatal dysfunction 3, 38, 40.
We found that left‐side ROIs exhibited greater degrees of PD‐related change in connectivity than did right‐side ROIs. This finding indicates that the bilateral BGMCs are asymmetrically affected; specifically, the BGMC contralateral to the more severely affected hand is more impaired. A previous study on brain activity patterns in patients with PD had similar finding, with a greater degree of hypoactivity detected in motor regions contralateral to the more affected hand 8. Indeed, PD is typically characterized by asymmetrical symptoms with lateralization that persists throughout the disease duration 41. Significant asymmetry of degeneration in the substantia nigra (with greater neuronal loss contralateral to the initially affected side) has been reported in patients with PD 42. This characteristic pathological change is likely a source of asymmetry in BGMC dysfunction, which in turn contributes to the presentation of asymmetrical symptoms in PD.
Levodopa administration enhanced connectivity between the posterior putamen/GPi and cortical motor areas, and decreased connectivity between the STN and cortical motor areas relative to the “off” state. This finding is in agreement with previous observations suggesting that levodopa treatment normalizes the function of the BGMC 2, 8, 9, 10, 11, 12. However, consistent with the observation of asymmetrical dysfunction of BGMC in PD, levodopa also asymmetrically normalized affected BGMC function. In our study, improvements in bradykinesia subscale scores were noted on both sides, but improvements were more significant for the more severely affected side. A recent study reported that levodopa had a greater normalization effect on brain activity in regions relevant to the affected side 43. An earlier study investigated the effect of levodopa during a finger tapping task and found that the more severely affected side had a shorter response duration, increased latency, and greater response magnitude than the less affected side 44. Our results demonstrate that levodopa normalizes impaired BGMC connectivity with a greater effect on the more affected side of the BGMC. This asymmetrical effect likely underlies the observation of a beneficial effect of levodopa on bradykinesia on the more severely affected side.
In this study, levodopa‐related improvements in bradykinesia were correlated with enhanced connectivity of the posterior putamen‐cortical motor pathway and decreased connectivity of the STN‐thalamo‐cortical motor pathway. The putamen receives projections from cortical motor areas and projects back to these motor areas via the thalamus. As discussed above, decreased functionality of the striato‐thalamo‐cortical motor circuit has been suggested to contribute to bradykinesia in PD 18. There is also evidence showing that pathological synchronization in the STN is related to bradykinesia 45. Accordingly, STN‐DBS is an effective treatment for bradykinesia 46. While the neural mechanism underlying the therapeutic effects of STN‐DBS remains unclear, it is known that STN‐DBS normalizes neural activity in the striatum 47, thalamus 47, 48, 49, and cortical motor areas 50, 51, 52. In addition, STN‐DBS modulates the striato‐thalamo‐cortical and STN‐cortical pathways 17 in association with symptom improvements. These reports together with our findings suggest that the beneficial effects of both levodopa and STN‐DBS on bradykinesia are associated with normalization of the striato‐thalamo‐cortical and STN‐cortical pathways.
Levodopa also had effects on connections outside of the BGMC. In the “off” state, the STN had increased connectivity with the cerebellum while the posterior putamen and GPi had decreased connectivity with the cerebellum, consistent with previous reports 5, 29, 31. It has been demonstrated that there are mutual connections between the basal ganglia and cerebellum 53, and increasing evidence suggests that the cerebellum plays aspecific role in the pathophysiology of PD 39. Administration of levodopa decreased connectivity between the STN and cerebellum and increased connectivity between the posterior putamen/GPi and cerebellum; however, these changes were not correlated with improvements in bradykinesia. The relationship between the recovery of these connections and improvements in other parkinsonian symptoms requires further investigation.
This study had some limitations. It is well known that other parkinsonian motor symptoms including tremor and rigidity also respond to levodopa treatment. In the current study, we did not examine how levodopa modulated neural networks to improve tremor or rigidity. In addition, the effects of other antiparkinsonian medications on the BGMC were not examined. As only eight patients received levodopa alone and 22 patients received levodopa in combination with other antiparkinsonian drugs, we were unable to compare our results between patients receiving only levodopa and those receiving combination therapy in the present study. These issues are important for understanding the neural mechanisms of medical therapy in PD and warrant investigation in future studies.
In conclusion, this study demonstrates that a neural mechanism underlying levodopa treatment is the asymmetrical normalization effects on the BGMC, preferentially affecting the more severely affected side. Moreover, the beneficial effects of levodopa on bradykinesia are associated with normalization of the striato‐thalamo‐cortical motor and STN‐cortical motor pathways. Our findings inform the neural mechanisms of the effect of levodopa therapy on bradykinesia in PD.
Conflict of Interest
The authors have no conflict of interests to disclose.
Supporting information
Table S1. Characteristics and quantitative synthesis of the 75 eligible meta‐analyses of environmental risk factors for Parkinson's disease.
Table S2. Quality assessments of primary studies. 15 papers assessed the quality of the primary observational studies using the Newcastle Ottawa Scale (NOS). Two additional papers used different methods to assess the included studies (criteria set by authors 24 and QUADAS‐2 49). The other 21 papers did not perform any quality assessment.
Table S3. Bias assessment of the 75 eligible meta‐analyses of environmental risk factors for Parkinson's disease.
Table S4. Assessment across the 75 associations of environmental risk factors with Parkinson's disease.
Acknowledgments
This work was supported by grants from the National Science Foundation of China (81271429 and 81571228).
References
- 1. Hauser RA. Levodopa: Past, present, and future. Eur Neurol 2009;62:1–8. [DOI] [PubMed] [Google Scholar]
- 2. Haslinger B, Erhard P, Kampfe N, et al. Event‐related functional magnetic resonance imaging in Parkinson's disease before and after levodopa. Brain 2001;124:558–570. [DOI] [PubMed] [Google Scholar]
- 3. Wu T, Hallett M. A functional MRI study of automatic movements in patients with Parkinson's disease. Brain 2005;128:2250–2259. [DOI] [PubMed] [Google Scholar]
- 4. Herz DM, Eickhoff SB, Lokkegaard A, Siebner HR. Functional neuroimaging of motor control in Parkinson's disease: A meta‐analysis. Hum Brain Mapp 2014;35:3227–3237. [DOI] [PMC free article] [PubMed] [Google Scholar]
- 5. Wu T, Wang L, Hallett M, Chen Y, Li K, Chan P. Effective connectivity of brain networks during self‐initiated movement in Parkinson's disease. NeuroImage 2011;55:204–215. [DOI] [PubMed] [Google Scholar]
- 6. Sharman M, Valabregue R, Perlbarg V, et al. Parkinson's disease patients show reduced cortical‐subcortical sensorimotor connectivity. Mov Disord 2013;28:447–454. [DOI] [PubMed] [Google Scholar]
- 7. Michely J, Volz LJ, Barbe MT, et al. Dopaminergic modulation of motor network dynamics in Parkinson's disease. Brain 2015;138:664–678. [DOI] [PMC free article] [PubMed] [Google Scholar]
- 8. Buhmann C, Glauche V, Sturenburg HJ, Oechsner M, Weiller C, Büchel C. Pharmacologically modulated fMRI–cortical responsiveness to levodopa in drug‐naive hemiparkinsonian patients. Brain 2003;126:451–461. [DOI] [PubMed] [Google Scholar]
- 9. Kraft E, Loichinger W, Diepers M, et al. Levodopa‐induced striatal activation in Parkinson's disease: A functional MRI study. Parkinsonism Relat Disord 2009;15:558–563. [DOI] [PubMed] [Google Scholar]
- 10. Palmer SJ, Eigenraam L, Hoque T, McCaig RG, Troiano A, McKeown MJ. Levodopa‐sensitive, dynamic changes in effective connectivity during simultaneous movements in Parkinson's disease. Neuroscience 2009;158:693–704. [DOI] [PubMed] [Google Scholar]
- 11. Wu T, Long X, Zang Y, et al. Regional homogeneity changes in patients with Parkinson's disease. Hum Brain Mapp 2009;30:1502–1510. [DOI] [PMC free article] [PubMed] [Google Scholar]
- 12. Martinu K, Degroot C, Madjar C, Strafella AP, Monchi O. Levodopa influences striatal activity but does not affect cortical hyper‐activity in Parkinson's disease. Eur J Neurosci 2012;35:572–583. [DOI] [PubMed] [Google Scholar]
- 13. Wu T, Wang L, Chen Y, Zhao C, Li K, Chan P. Changes of functional connectivity of the motor network in the resting state in Parkinson's disease. Neurosci Lett 2009;460:6–10. [DOI] [PubMed] [Google Scholar]
- 14. Kwak Y, Peltier S, Bohnen NI, Müller ML, Dayalu P, Seidler RD. Altered resting state cortico‐striatal connectivity in mild to moderate stage Parkinson's disease. Front Syst Neurosci 2010;4:143. [DOI] [PMC free article] [PubMed] [Google Scholar]
- 15. Agosta F, Caso F, Stankovic I, et al. Cortico‐striatal‐thalamic network functional connectivity in hemiparkinsonism. Neurobiol Aging 2014;35:2592–2602. [DOI] [PubMed] [Google Scholar]
- 16. Trost M, Su S, Su P, et al. Network modulation by the subthalamic nucleus in the treatment of Parkinson's disease. NeuroImage 2006;31:301–307. [DOI] [PMC free article] [PubMed] [Google Scholar]
- 17. Kahan J, Urner M, Moran R, et al. Resting state functional MRI in Parkinson's disease: The impact of deep brain stimulation on ‘effective’ connectivity. Brain 2014;137:1130–1144. [DOI] [PMC free article] [PubMed] [Google Scholar]
- 18. DeLong MR, Wichmann T. Circuits and circuit disorders of the basal ganglia. Arch Neurol 2007;64:20–24. [DOI] [PubMed] [Google Scholar]
- 19. Hughes AJ, Daniel SE, Kilford L, Lees AJ. Accuracy of clinical diagnosis of idiopathic Parkinson's disease: A clinico‐pathological study of 100 cases. J Neurol Neurosurg Psychiatry 1992;55:181–184. [DOI] [PMC free article] [PubMed] [Google Scholar]
- 20. Goetz CG, Tilley BC, Shaftman SR, et al. Movement Disorder Society‐sponsored revision of the Unified Parkinson's Disease Rating Scale (MDS‐UPDRS): Scale presentation and clinimetric testing results. Mov Disord 2008;23:2129–2170. [DOI] [PubMed] [Google Scholar]
- 21. Hoehn MM, Yahr MD. Parkinsonism: Onset, progression and mortality. Neurology 1967;17:427–442. [DOI] [PubMed] [Google Scholar]
- 22. Tomlinson CL, Stowe R, Patel S, Rick C, Gray R, Clarke CE. Systematic review of levodopa dose equivalency reporting in parkinson's disease. Mov Disord 2010;25:2649–2653. [DOI] [PubMed] [Google Scholar]
- 23. Oldfield RC. The assessment and analysis of handedness: The Edinburgh inventory. Neuropsychologia 1971;9:97–113. [DOI] [PubMed] [Google Scholar]
- 24. Chao‐Gan Y, Yu‐Feng Z. DPARSF: A MATLAB Toolbox for “Pipeline” Data Analysis of Resting‐State fMRI. Front Syst Neurosci 2010;4:13. [DOI] [PMC free article] [PubMed] [Google Scholar]
- 25. Yan CG, Cheung B, Kelly C, et al. A comprehensive assessment of regional variation in the impact of head micromovements on functional connectomics. NeuroImage 2013;76:183–201. [DOI] [PMC free article] [PubMed] [Google Scholar]
- 26. Jenkinson M, Bannister P, Brady M, Smith S. Improved optimization for the robust and accurate linear registration and motion correction of brain images. NeuroImage 2002;17:825–841. [DOI] [PubMed] [Google Scholar]
- 27. Lehericy S, Benali H, Van de Moortele PF, et al. Distinct basal ganglia territories are engaged in early and advanced motor sequence learning. Proc Natl Acad Sci U S A 2005;102:12566–12571. [DOI] [PMC free article] [PubMed] [Google Scholar]
- 28. Kish SJ, Shannak K, Hornykiewicz O. Uneven pattern of dopamine loss in the striatum of patients with idiopathic Parkinson's disease. Pathophysiologic and clinical implications. N Engl J Med 1988;318:876–880. [DOI] [PubMed] [Google Scholar]
- 29. Wu T, Zhang J, Hallett M, Feng T, Hou Y, Chan P. Neural correlates underlying micrographia in Parkinson's disease. Brain 2016;139:144–160. [DOI] [PMC free article] [PubMed] [Google Scholar]
- 30. Fernandez‐Seara MA, Mengual E, Vidorreta M, et al. Resting state functional connectivity of the subthalamic nucleus in Parkinson's disease assessed using arterial spin‐labeled perfusion fMRI. Hum Brain Mapp 2015;36:1937–1950. [DOI] [PMC free article] [PubMed] [Google Scholar]
- 31. Baudrexel S, Witte T, Seifried C, et al. Resting state fMRI reveals increased subthalamic nucleus‐motor cortex connectivity in Parkinson's disease. NeuroImage 2011;55:1728–1738. [DOI] [PubMed] [Google Scholar]
- 32. Fox MD, Buckner RL, Liu H, Chakravarty MM, Lozano AM, Pascual‐Leone A. Resting‐state networks link invasive and noninvasive brain stimulation across diverse psychiatric and neurological diseases. Proc Natl Acad Sci U S A 2014;111:E4367–E4375. [DOI] [PMC free article] [PubMed] [Google Scholar]
- 33. Song XW, Dong ZY, Long XY, et al. REST: A toolkit for resting‐state functional magnetic resonance imaging data processing. PLoS One 2011;6:e25031. [DOI] [PMC free article] [PubMed] [Google Scholar]
- 34. Kurani AS, Seidler RD, Burciu RG, et al. Subthalamic nucleus–sensorimotor cortex functional connectivity in de novo and moderate Parkinson's disease. Neurobiol Aging 2015;36:462–469. [DOI] [PMC free article] [PubMed] [Google Scholar]
- 35. Wu T, Long X, Wang L, et al. Functional connectivity of cortical motor areas in the resting state in Parkinson's disease. Hum Brain Mapp 2011;32:1443–1457. [DOI] [PMC free article] [PubMed] [Google Scholar]
- 36. Rascol O, Sabatini U, Fabre N, et al. The ipsilateral cerebellar hemisphere is overactive during hand movements in akinetic parkinsonian patients. Brain 1997;120:103–110. [DOI] [PubMed] [Google Scholar]
- 37. Sabatini U, Boulanouar K, Fabre N, et al. Cortical motor reorganization in akinetic patients with Parkinson's disease: A functional MRI study. Brain 2000;123:394–403. [DOI] [PubMed] [Google Scholar]
- 38. Yu H, Sternad D, Corcos DM, Vaillancourt DE. Role of hyperactive cerebellum and motor cortex in Parkinson's disease. NeuroImage 2007;35:222–233. [DOI] [PMC free article] [PubMed] [Google Scholar]
- 39. Wu T, Hallett M. The cerebellum in Parkinson's disease. Brain 2013;136:696–709. [DOI] [PMC free article] [PubMed] [Google Scholar]
- 40. Appel‐Cresswell S, de la Fuente‐Fernandez R, Galley S, McKeown MJ. Imaging of compensatory mechanisms in Parkinson's disease. Curr Opin Neurol 2010;23:407–412. [DOI] [PubMed] [Google Scholar]
- 41. Djaldetti R, Ziv I, Melamed E. The mystery of motor asymmetry in Parkinson's disease. Lancet Neurol 2006;5:796–802. [DOI] [PubMed] [Google Scholar]
- 42. Kempster PA, Gibb WR, Stern GM, Lees AJ. Asymmetry of substantia nigra neuronal loss in Parkinson's disease and its relevance to the mechanism of levodopa related motor fluctuations. J Neurol Neurosurg Psychiatry 1989;52:72–76. [DOI] [PMC free article] [PubMed] [Google Scholar]
- 43. Martinu K, Nagano‐Saito A, Fogel S, Monchi O. Asymmetrical effect of levodopa on the neural activity of motor regions in PD. PLoS One 2014;9:e111600. [DOI] [PMC free article] [PubMed] [Google Scholar]
- 44. Rodriguez M, Lera G, Vaamonde J, Luquin MR, Obeso JA. Motor response to apomorphine and levodopa in asymmetric Parkinson's disease.J NeurolNeurosurg . Psychiatry 1994;57:562–566. [DOI] [PMC free article] [PubMed] [Google Scholar]
- 45. Kuhn AA, Tsui A, Aziz T, et al. Pathological synchronisation in the subthalamic nucleus of patients with Parkinson's disease relates to both bradykinesia and rigidity. Exp Neurol 2009;215:380–387. [DOI] [PubMed] [Google Scholar]
- 46. Kleiner‐Fisman G, Herzog J, Fisman DN, et al. Subthalamic nucleus deep brain stimulation: Summary and meta‐analysis of outcomes. Mov Disord 2006;21:S290–S304. [DOI] [PubMed] [Google Scholar]
- 47. Geday J, Ostergaard K, Johnsen E, Gjedde A. STN‐stimulation in Parkinson's disease restores striatal inhibition of thalamocortical projection. Hum Brain Mapp 2009;30:112–121. [DOI] [PMC free article] [PubMed] [Google Scholar]
- 48. Xu W, Russo GS, Hashimoto T, Zhang J, Vitek JL. Subthalamic nucleus stimulation modulates thalamic neuronal activity. J Neurosci 2008;28:11916–11924. [DOI] [PMC free article] [PubMed] [Google Scholar]
- 49. Kahan J, Mancini L, Urner M, et al. Therapeutic subthalamic nucleus deep brain stimulation reverses cortico‐thalamic coupling during voluntary movements in Parkinson's disease. PLoS One 2012;7:e50270. [DOI] [PMC free article] [PubMed] [Google Scholar]
- 50. Ceballos‐Baumann AO, Boecker H, Bartenstein P, et al. A positron emission tomographic study of subthalamic nucleus stimulation in Parkinson disease: Enhanced movement‐related activity of motor‐association cortex and decreased motor cortex resting activity. Arch Neurol 1999;56:997–1003. [DOI] [PubMed] [Google Scholar]
- 51. Haslinger B, Kalteis K, Boecker H, Alesch F, Ceballos‐Baumann AO. Frequency‐correlated decreases of motor cortex activity associated with subthalamic nucleus stimulation in Parkinson's disease. NeuroImage 2005;28:598–606. [DOI] [PubMed] [Google Scholar]
- 52. Asanuma K, Tang C, Ma Y, et al. Network modulation in the treatment of Parkinson's disease. Brain 2006;129:2667–2678. [DOI] [PMC free article] [PubMed] [Google Scholar]
- 53. Bostan AC, Dum RP, Strick PL. The basal ganglia communicate with the cerebellum. Proc Natl Acad Sci U S A 2010;107:8452–8456. [DOI] [PMC free article] [PubMed] [Google Scholar]
Associated Data
This section collects any data citations, data availability statements, or supplementary materials included in this article.
Supplementary Materials
Table S1. Characteristics and quantitative synthesis of the 75 eligible meta‐analyses of environmental risk factors for Parkinson's disease.
Table S2. Quality assessments of primary studies. 15 papers assessed the quality of the primary observational studies using the Newcastle Ottawa Scale (NOS). Two additional papers used different methods to assess the included studies (criteria set by authors 24 and QUADAS‐2 49). The other 21 papers did not perform any quality assessment.
Table S3. Bias assessment of the 75 eligible meta‐analyses of environmental risk factors for Parkinson's disease.
Table S4. Assessment across the 75 associations of environmental risk factors with Parkinson's disease.