Summary
Objectives
This study aimed to evaluate the roles of autophagy and endoplasmic reticulum (ER) stress in intracerebral hemorrhage (ICH)‐induced secondary brain injury (SBI) in rats.
Methods
Autophagy inducer (rapamycin) and inhibitor (3‐methyladenine), as well as ER stress activator (tunicamycin, TM) and inhibitor (tauroursodeoxycholic acid, TUDCA), were used. Bafilomycin A1, an inhibitor of autophagosome‐lysosome fusion, was used to assess autophagic flux.
Results
Autophagy and ER stress were enhanced in the week after ICH. At 6 hours after ICH, autophagy was excessive, while the autophagic flux was damaged at 72 hours and return to be intact at 7 days after ICH. At 6 hours after ICH, ER stress induction by TM could enhance autophagy and lead to caspase 12‐mediated apoptosis and neuronal degeneration, which was further aggravated by autophagy induction. At 7 days after ICH, ER stress inhibition by TUDCA still could suppress ICH‐induced SBI. And, the effects of TUDCA were enhanced by autophagy induction.
Conclusions
At 6 hours after ICH, excessive autophagy may participate in ER stress‐induced brain injury; at 7 days after ICH, autophagy could enhance the protection of ER stress inhibitor possibly via clearing up the cell rubbish generated due to the early‐stage damaged autophagic flux.
Keywords: autophagy, endoplasmic reticulum stress, intracerebral hemorrhage, secondary brain injury
1. INTRODUCTION
Intracerebral hemorrhage (ICH) is a neurosurgical emergency characterized by high mortality and morbidity.1, 2, 3, 4, 5 In the general population, the incidence of ICH is approximately 24.6/100 000, with a mortality rate of 30%‐50%. Secondary brain injury (SBI) after ICH is an important factor that affects quality of life of patients with ICH.6 Therefore, prevention of SBI after ICH is very valuable.7 Studies on molecular mechanisms of SBI after ICH may provide new targets for the treatment of patients with ICH.8 Neuronal damage and apoptosis are important pathological process in SBI after ICH. It has also been shown that autophagy is activated after ICH and endoplasmic reticulum (ER) stress occur in neurodegenerative diseases.9, 10, 11, 12 And autophagy may play different role36s in ischemic and hemorrhagic stroke.13, 14, 15, 16, 17 However, it is not entirely clear whether ER stress and autophagy are involved in the pathological process of ICH‐induced SBI.
Previous studies have shown that, in central nervous system diseases, oxidative stress triggers sustained ER stress and thus mediates cell apoptosis. Apoptosis can be induced by activating the pro‐apoptotic transcription factor C/EBP homologous protein (CHOP) and the downstream apoptotic signaling molecules. In addition, sustained ER stress can cause Ca2+ balance disorders and ultimately induce apoptosis.18 It has been reported that ER stress is involved in brain damage caused by subarachnoid hemorrhage (SAH) by promoting neuronal apoptosis.20 Numerous studies have shown that severe oxidative stress is present in SBI after ICH.21 In addition, sustained oxidative stress and ER stress synergistically promote and further induce inflammation and apoptosis of nerve cells. However, the level of ER stress in the SBI after ICH has rarely been reported.
Autophagy is a cellular self‐degradation process, in which homeostasis is maintained by degrading damaged cells or components within cells in the case of inadequate nutrition and oxidative stress.21 However, cellular homeostasis maintained by autophagy relies on the integrity of autophagy flux.22, 23 Incomplete autophagy flux can rupture lysosomes and autophagosomes, which results in cellular damage. Seven days after ICH, autophagic vesicles are highly aggregated in neurons.24 However, the integrity of autophagy flux after ICH is unclear.
Autophagy is closely related to ER stress. In the early stage of brain damage caused by SAH, ER stress exerts a neuroprotective effect by reducing neuronal apoptosis through activation of the autophagy pathway.25 Moreover, it has been reported that in the formation of fatty liver, sustained ER stress can damage the integrity of autophagy flux and cause apoptosis. In spinal cord injuries, autophagy flux, together with ER stress, can induce neuronal apoptosis.26 However, the regulation and mechanisms of the ER stress‐autophagy pathway have not been reported in previous studies of SBI after ICH.
In this study, we investigated the relationship between ER stress and autophagy using a rat ICH model generated by autologous blood injection. In addition, we evaluated the role of ER stress and autophagy in SBI after ICH using an autophagy inducer (rapamycin) and inhibitor (3‐methyladenine, 3‐MA) as well as an ER stress activator (tunicamycin, TM) and inhibitor (tauroursodeoxycholic acid, TUDCA).
2. MATERIALS AND METHODS
2.1. Establishment of the experimental ICH model in rats
Adult male Sprague‐Dawley (SD) rats weighting 250‐300 g were provided by the Experimental Animal Research Center at the Medical College of Soochow University. All experimental procedures were approved by the ethics committee of Suzhou University and implemented with reference to National Institute of Health Guide for the Care and Use Laboratory Animals. The experimental ICH model was established by injection of autologous blood using the modified methods described by Deinsberger et al.27 After anesthesia with intraperitoneal injection of 10% chloral hydrate at a dosage of 36 mg/100 g body weight, rats were fixed in the stereotaxic frame (ZH‐Lanxing B type, Anhui Zhenghua Biological Equipment Co. Ltd. Anhui, China). The skull was exposed by a 2 cm longitudinal incision on the back of the scalp, and craniotomy was performed. The drilling locations (0.2 mm anterior to the intersection between the coronal suture and sagittal midline and 3.5 mm to the right of the sagittal suture). Subsequently, 100 μL of autologous blood was collected from the heart using a 100‐μL microsyringe (Hamilton Company, Nevada, USA), and a microsyringe was corrected with the drilling location. The needle was slowly inserted into the subdural space 5.5 mm in depth to reach the basal ganglia, where 100 μL of autologous blood was slowly injected at an injection rate of 10 μL/min. Typical visual representation of the brain surface in the rat ICH model was shown in Figure 1A. While establishing the rat model, we monitored heart rate, blood pressure, and body temperature in real‐time and rectal temperature was maintained at 37.5°C. Neurological symptoms were evaluated. After indicated treatment, the rats were killed and the brains was removed quickly and subsequently sectioned coronally into 2‐mm‐thick slices starting from the frontal pole. The sections with hematoma from each rat were collected and separately used for paraffin section preparation and Western blot assay.
Figure 1.
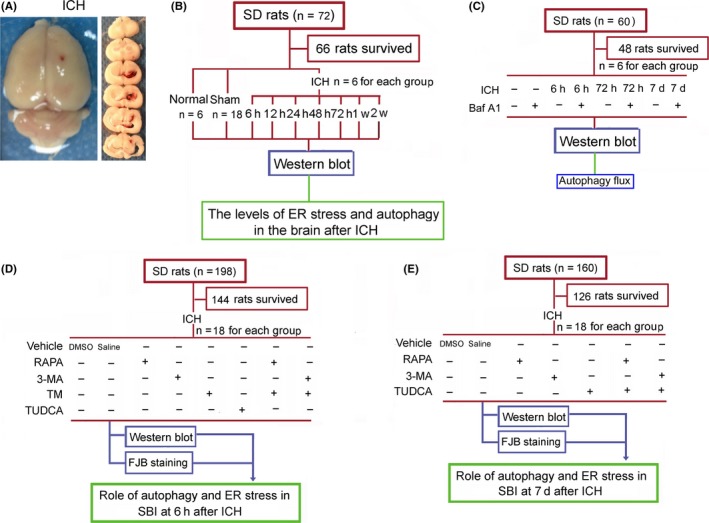
Visual representation of intracerebral hemorrhage (ICH) in rats and the experimental design. (A) Typical visual representation of the brain surface in the rat ICH model. Slices on the right side show brain tissue sections from the frontal pole to the back at 2 mm, 4 mm, 6 mm, 8 mm, 10 mm, and 12 mm. Each brain section was 2 mm thick. (B) Experimental design 1: The protein levels of endoplasmic reticulum (ER) stress marker proteins C/EBP homologous protein (CHOP) and glucose‐regulated protein 78 (GRP78), and a autophagy marker protein microtubule‐associated protein light‐chain 3 (LC3) at each time point after ICH. (C) Experimental design 2: Bafilomycin A1(Baf A1), a potent inhibitor of autophagosome‐lysosome fusion, was used to test the integrity of autophagic flux at the indicated time points after ICH. (D) Experimental design 3: Effects of ER stress and autophagy regulators on secondary brain injury (SBI) at 6 h after ICH. (E) Experimental design 4: Effects of ER stress and autophagy regulators on SBI at 7 d after ICH. RAPA, rapamycin; 3‐MA, 3‐methyladenine; TM, tunicamycin; TUDCA, tauroursodeoxycholic acid
2.2. Experiment grouping
2.2.1. Part I
Evaluation of the levels of ER stress and autophagy after ICH via Western blot assay of the protein levels of ER stress markers and autophagy markers at different time points after ICH (Figure 1B). A total of 66 rats were divided into normal (n=6), sham (n=18), and ICH groups (n=42). Rats in the sham group underwent collection of cardiac blood, drilling of burr holes into the skull, and puncturing of basal ganglia, but no blood injection. ICH model rats were randomly divided into seven groups (n=6 for each group): 6 hours, 12 hours, 24 hours, 48 hours, 72 hours, 7 days, and 14 days after ICH. Rats in the sham group were killed at 48 hours, and brain tissues from rats in the ICH group were collected at different time points for Western blot experiments.
2.2.2. Part II
Evaluation of the integrity of autophagic flux at different time points after ICH (Figure 1C). A total of 48 rats were divided into the indicated eight groups (n=6), including sham group, sham+bafilomycin A1(Baf A1) group, ICH (6 hours) group, ICH (6 hours)+Baf A1 group, ICH (72 hours) group, ICH (72 hours)+Baf A1 group, ICH (7 days) group, and ICH (7 days)+Baf A1 group. Rats were received an intracerebral ventricular injection of Baf A1 (120 ng) at 6 hours before they were killed. Brain tissues were collected at indicated time points for Western blot experiments.
2.2.3. Part III
Effects ER stress and autophagy on SBI 6 hours after ICH (Figure 1D). A total of 144 rats were randomly divided into eight groups (n=18 per group): ICH+DMSO group, ICH+saline group, ICH+TM pretreatment group, ICH+TUDCA pretreatment group, ICH+rapamycin pretreatment group, ICH+3‐MA pretreatment group, ICH+TM+rapamycin pretreatment group, and ICH+TM+3‐MA pretreatment group. Drugs were administered to rats in each group at 24 hours before establishment of the ICH model and 2 hours before sacrifice. Six hours after ICH, brain tissues were used for fluoro‐Jade B (FJB) staining and Western blot analysis of cleaved‐caspase 12.
2.2.4. Part IV
Effects of ER stress and autophagy on SBI 7 days after ICH (Figure 1E). In pilot experiments, no rats treated with TM survived more than 48 hours. Therefore, no TM treatment group was included in this part of the study. A total of 126 rats with a successfully established ICH model were randomly divided into seven groups (n=18 per group): ICH+DMSO group, ICH+saline group, ICH+TUDCA intervention group, ICH+rapamycin intervention group, ICH+3‐MA intervention group, ICH+TUDCA+rapamycin group, and ICH+TUDCA+3‐MA intervention group. Drugs were administered to rats in each group 6 days after ICH and 2 hours before they were killed.Seven days after ICH, brain tissues were used for FJB staining and Western blot analysis of cleaved‐caspase 12. If an experimental animal died during the experiment, an additional experimental animal was randomly added to the same group.
To minimize the number of animals used in this study, Part I, Part III, and Part IV experiments share the sham group.
2.3. Drug treatment
TM was dissolved in DMSO to 1 mg/mL. TUDCA was dissolved in saline to 200 mg/mL.28, 29 Rapamycin was dissolved in DMSO to 1 mg/mL.30, 31 3‐MA was dissolved in saline to 20 mg/mL.32 Rapamycin (1 mg/kg body weight),33 3‐MA (30 mg/kg body weight),32 TM (2 mg/kg body weight),28 and TUDCA (250 mg/kg body weight) 26 were administrated by intraperitoneal injection. Rats in the ICH+vehicle group were injected with an equal volume (0.5 mL) of saline+DMSO.
2.4. Western blot analysis
The perihematoma tissues immersed in liquid nitrogen were fully ground on ice and lysed in RIPA lysis buffer (Beyotime Institute of Biotechnology, Jiangsu, China). After 30 minutes, the lysate was transferred to a centrifuge tube and centrifuged at 16 000 g for 5 minutes at 4°C. The supernatant was stored at −80°C for later use. A BCA protein concentration assay kit (Beyotime Institute of Biotechnology) was used to determine protein concentration. A total of 50 μg protein were subjected to SDS‐PAGE and transferred to a membrane for ECL and imaging. ImageJ software (Rawak Software, Inc., Stuttgart, Germany) was used to analyze optical density.
2.5. Fluoro‐Jade B (FJB) staining
Fluoro‐Jade B (FJB) is a sensitive and highly specific fluorescent stain that indicates neuronal degradation.34 FJB staining of brain tissue sections was performed as previously described.36 Briefly, after dewaxing the paraffin‐embedded brain sections (described above), the samples were placed in the dark at room temperature and incubated with 0.06% KMnO4 solution for 15 minutes. Sections were then washed three times with PBS (5 min/wash), incubated with FJB working solution (containing 0.1% acetic acid solvent) for 60 minutes, and washed three times with PBS (5 min/wash). Brain sections on glass slides were air‐dried at room temperature in a dark room and sealed with antiquenching mounting medium and coverslips. Six microscopic fields in each tissue section and three sections per rat were examined and photographed in parallel for FJB‐positive cell counting. Microscopy was performed by an experienced pathologist blind to the experimental condition. Brain tissues were examined and photographed 1 mm away from the blood clots to avoid potential red blood cell contamination.
2.6. Statistical analysis
All data are expressed as mean±SEM. SPSS 19.0 software (SPSS Inc., Chicago, IL, USA) was used for data analysis. All data were analyzed using Student's t test or one‐way ANOVA. Differences between experimental groups were determined by the Tukey's post hoc test. The P‐values were adjusted for multiple comparisons by applying the Bonferroni‐Holm procedure.
3. RESULTS
3.1. The levels of endoplasmic reticulum (ER) stress and autophagy were increased after ICH
The protein levels of ER stress markers glucose‐regulated protein 78 (GRP78) and CHOP were measured in perihematoma tissues at 6 hours, 12 hours, 24 hours, 48 hours, 72 hours, 1 week, and 2 weeks after ICH using Western blots (Figure 2A‐C). The results showed that, compared with the sham group, the protein levels of GRP78 and CHOP were significantly increased respectively at 6 hours and 48 hours after ICH, continued to increase until 7 days, and then significantly decreased by 14 days. The protein level of autophagy marker microtubule‐associated protein light‐chain 3 (LC3), especially the conversion of LC3‐I to LC3‐II, in perihematoma tissues was also detected using Western blots (Figure 2D and E). The results showed that, compared with the sham group, LC3‐II/LC3‐I ratio was significantly increased at 6 hours after ICH, returned to levels comparable to the sham group at 12 hours to 48 hours, significantly rebounded between 72 hours and 7 days, and then significantly decreased at 14 days, although the level was still significantly higher than that in the sham group.
Figure 2.
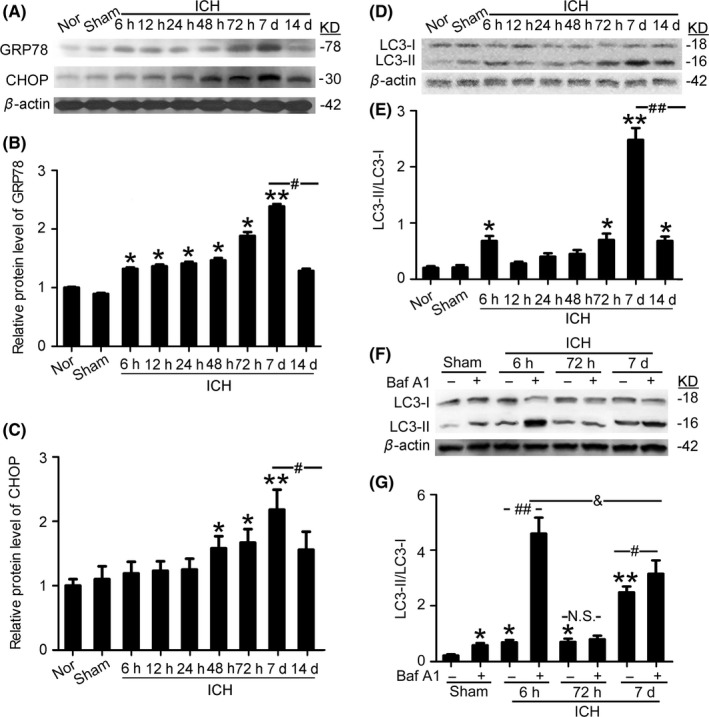
Changes in the protein levels of GRP78, CHOP, and the conversion of LC3‐I to LC3‐II in perihematoma tissues in the rat intracerebral hemorrhage (ICH) model. (A) GRP78 and CHOP protein levels in perihematoma tissues of the rat ICH model determined by Western blots. (B, C) Results of quantitative analysis of (A) Bars represent mean±SEM, *P<.05, **P<.01 compared with the sham group; #P<.05, n=6. (D) The protein level of LC3 in perihematoma tissues of the rat ICH model determined by Western blots. (E) Quantitative analysis of the conversion of LC3‐I to LC3‐II shown in (D) Bars represent mean±SEM, *P<.05, **F 8,48=28.13, P<.01 compared with the sham group; ##F 8,48=20.02, P<.01, n=6. (F) Western blot assay of the protein level of LC3 in perihematoma tissues of rats with indicated treatment. (G) Results of quantitative analysis of F. Bars represent mean±SEM, *P<.05, **F 7,40=29.53, P<.01 compared with the sham group; #F 7,40=11.12, P<.05, ##F 7,40=27.25, P<.001, &F 7,40=12.71, P<.05, N.S.=No significant differences, n=6. CHOP, C/EBP homologous protein; GRP78, glucose‐regulated protein 78; LC3, microtubule‐associated protein light‐chain 3; Nor, normal
3.2. The integrity of autophagic flux after ICH
Then, we test the integrity of autophagic flux at 6 hours, 72 hours, and 7 days after ICH using Baf A1 (Figure 2F and G). Compared with the sham group, LC3‐II/LC3‐I ratio was significantly increased in sham+Baf A1 group, suggesting 120 ng is an effective dose for preventing autophagosome‐lysosome fusion in this model. Both in ICH (6 hours) group and ICH (7 days) group, there was significant increase in LC3‐II/LC3‐I ratio after Baf A1 treatment, suggesting an intact flux through these system. However, there was no significant change between ICH (72 hours) group and ICH (72 hours) +Baf A1 group, suggesting that there was a limited autophagic flux. As it is well known that impaired autophagic flux would lead to autophagosomes ejection or lysosomal leakage, as well as cell death,36 we focused on the effects of autophagy on brain injury at 6 hours and 7 days after ICH. In addition, compared with the moderate change between ICH (7 days) group and ICH (7 days)+Baf A1 group, Baf A1 treatment induced about six times increase in LC3‐II/LC3‐I ratio at 6 hours after ICH, suggesting that there was an excessive autophagy at 6 hours after ICH.
3.3. Endoplasmic reticulum (ER) stress induction increased SBI 6 hours after ICH
Western blot results showed that, at 6 hours after ICH, the protein levels of GRP78 and CHOP were significantly upregulated by TM pretreatment group and downregulated by TUDCA pretreatment (Figure 3A), suggesting that TM and TUDCA could effectively activate and inhibit ER stress at 6 hours after ICH. To assess the effects of ER stress on autophagy at 6 hours after ICH, the protein level of LC3 was determined using Western blots to measure the conversion of LC3‐I to LC3‐II (Figure 3B). The results showed that, compared with the vehicle group, LC3‐II/LC3‐I ratio was significantly increased in the TM pretreatment group, while LC3‐II/LC3‐I ratio was significantly decreased in the TUDCA pretreatment group, suggesting that ER stress could activate autophagy at 6 hours after ICH. In addition, Western blots also showed that, compared with the sham group, ICH induced a significant increase in the level of cleaved‐caspase 12, which was further increased by TM pretreatment and significantly decreased by TUDCA pretreatment, suggesting that ER stress induced caspase 12‐mediated apoptosis at 6 hours after ICH (Figure 3C). Finally, FJB staining showed that, compared with the vehicle group, neuronal degradation was significantly increased in the TM pretreatment group and decreased in the TUDCA pretreatment group (Figure 3D). Taken together, at 6 hours after ICH, ER stress participated in ICH‐induced SBI via inducing excessive autophagy and caspase 12‐mediated apoptosis.
Figure 3.
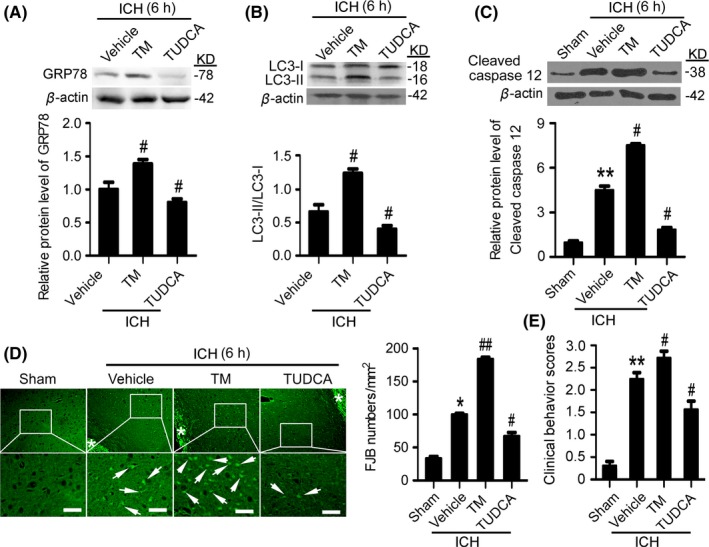
Endoplasmic reticulum (ER) stress exacerbates secondary brain injury (SBI) at 6 h after intracerebral hemorrhage (ICH). (A) GRP78 protein levels and statistics in perihematoma tissues of the rat ICH model determined by Western blots. (B) The conversion of LC3‐I to LC3‐II and statistics in perihematoma tissues of the rat ICH model determined by Western blots. (C) Cleaved‐caspase 12 protein levels and statistics in perihematoma tissues of the rat ICH model determined by Western blots. (D) Fluoro‐Jade B (FJB) staining shows neuronal degradation (green). Arrows point to FJB‐positive cells. Asterisks indicate hematoma location. Bar=64 μm. FJB‐positive cells/mm2 in perihematomal brain were shown. (E) Clinical Behavior Scores. In (A, B, C, D, and E), bars represent mean±SEM, *P<.05, **P<.01 compared with the sham group and #P<.05, ##P<.01 compared with the vehicle group, n=18. GRP78, glucose‐regulated protein 78; LC3, microtubule‐associated protein light‐chain 3; TM, tunicamycin; TUDCA, tauroursodeoxycholic acid
3.4. Induction of autophagy intensified SBI at 6 hours after ICH
Western blot results showed that, compared with the vehicle group, at 6 hours after ICH, rapamycin pretreatment significantly upregulated LC3‐II/LC3‐I ratio, while 3‐MA pretreatment significantly reduced LC3‐II/LC3‐I ratio (Figure 4A), suggesting that rapamycin and 3‐MA effectively activated and suppressed autophagy at 6 hours after ICH. To assess the effects of autophagy on ER stress at 6 hours after ICH, the protein level of GRP78 was determined using Western blots (Figure 4B). The results showed that, compared with the vehicle group, both rapamycin and 3‐MA could not affect the protein level of GRP78, suggesting that autophagy could not affect ER stress at 6 hours after ICH. In addition, Western blots also showed that, compared with the vehicle group, the level of cleaved‐caspase 12 was significantly increased by rapamycin pretreatment group and decreased by 3‐MA pretreatment, suggesting that autophagy participated in caspase 12 activation, and then ER stress‐induced apoptosis at 6 hours after ICH (Figure 4C). Furthermore, FJB staining showed that, compared with the vehicle group, neuronal degradation significantly increased in the rapamycin pretreatment group, whereas neuronal degradation significantly decreased in the 3‐MA pretreatment group (Figure 4D). Taken together, at 6 hours after ICH, autophagy participated in ICH‐induced SBI via promoting caspase 12 activation.
Figure 4.
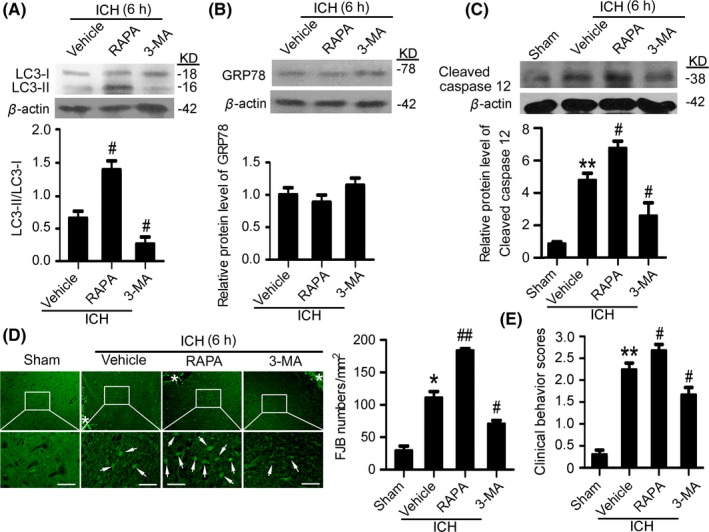
Autophagy induction exacerbates secondary brain injury (SBI) at 6 hours after intracerebral hemorrhage (ICH). (A) The conversion of LC3‐I to LC3‐II and statistics in perihematoma tissues of the rat ICH model determined by Western blots. (B) GRP78 protein levels and statistics in perihematoma tissues of the rat ICH model determined by Western blots. (C) Cleaved‐caspase 12 protein levels and statistics in perihematoma tissues of the rat ICH model determined by Western blots. (D) Fluoro‐Jade B (FJB) staining shows neuronal degradation (green). Arrows point to FJB‐positive cells. Asterisks indicate hematoma location. Bar=64 μm. FJB‐positive cells/mm2 in perihematomal brain were shown. (E) Clinical Behavior Scores. In (A, B, C, D, and E), bars represent mean±SEM, *P<.05, **P<.01 compared with the sham group and #P<.05, ##P<.01 compared with the vehicle group, n=18. LC3, microtubule‐associated protein light‐chain 3; GRP78, glucose‐regulated protein 78; RAPA, rapamycin; 3‐MA, 3‐methyladenine
3.5. Autophagy aggravated ER stress‐induced brain damage at 6 hours after ICH
We further investigated the interaction between autophagy and ER stress in SBI at 6 hours after ICH. Western blot results showed that, compared with the TM group, the level of cleaved‐caspase 12 was significantly higher in the TM+rapamycin pretreatment group, while the level of cleaved‐caspase 12 was significantly lower in the TM+3‐MA pretreatment group (Figure 5A). In addition, FJB staining showed that, compared with the TM group, neuronal degradation significantly decreased in the TM+3‐MA pretreatment group, while neuronal degradation significantly increased in the TM+rapamycin pretreatment group (Figure 5B). Taken together, at 6 hours after ICH, rapamycin‐induced autophagy intensified TM‐induced SBI.
Figure 5.
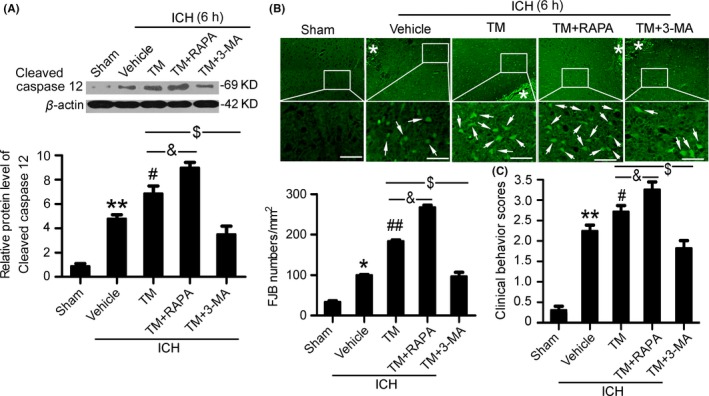
Autophagy exacerbates brain injury induced by endoplasmic reticulum (ER) stress at 6 h after intracerebral hemorrhage (ICH). (A) Cleaved‐caspase 12 protein levels and statistics in perihematoma tissues of the rat ICH model determined by Western blots. (B) Fluoro‐Jade B (FJB) staining shows neuronal degradation (green). Arrows point to FJB‐positive cells. Asterisks indicate hematoma location. Bar=64 μm. FJB‐positive cells/mm2 in perihematomal brain were shown. (C) Clinical Behavior Scores. In (A, B, and C), bars represent mean±SEM, *P<.05, **P<.01 compared with the sham group and #P<.05, ##P<.01 compared with the vehicle group, &P<.05 and $P<.05, n=18. RAPA, rapamycin; 3‐MA, 3‐methyladenine; TM, tunicamycin
3.6. Inhibition of ER stress relieved SBI at 7 days after ICH
Western blot results showed that, at 7 days after ICH, TUDCA pretreatment significantly reduced GRP78 protein levels compared with the vehicle group (Figure 6A), which suggests that TUDCA effectively suppresses ER stress at 7 days after ICH. To assess the effects of ER stress on autophagy at 7 days after ICH, the protein level of LC3 was determined using Western blots to measure the conversion of LC3‐I to LC3‐II (Figure 6B). The results showed that there was no significant change between the vehicle group and TUDCA pretreatment group, suggesting that ER stress could not regulate the level of autophagy at 7 days after ICH. In addition, Western blots also showed that, compared with the vehicle group, the level of cleaved‐caspase 12 was significantly decreased by TUDCA pretreatment, suggesting that ER stress participated in caspase 12‐mediated apoptosis at 7 days after ICH (Figure 6C). Finally, FJB staining showed that, compared with the vehicle group, neuronal degradation was significantly decreased in the TUDCA pretreatment group (Figure 6D). Taken together, at 7 days after ICH, ER stress participated in caspase 12‐mediated apoptosis.
Figure 6.
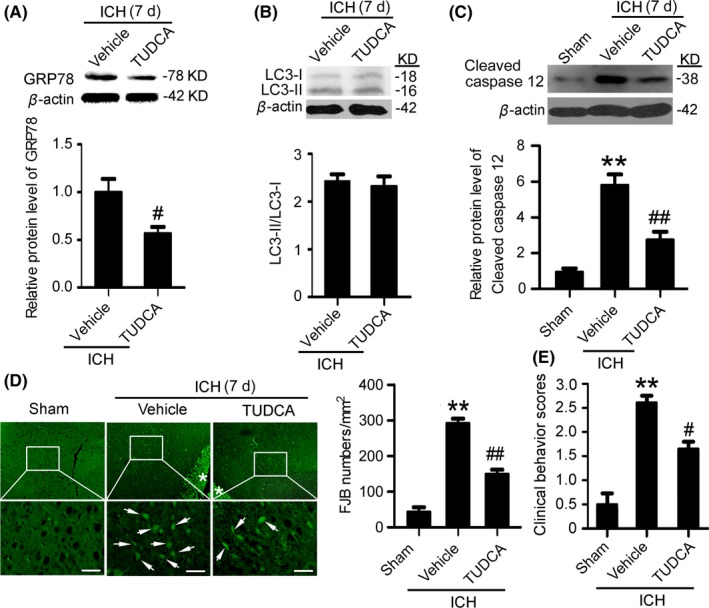
Inhibition of endoplasmic reticulum (ER) stress mitigates secondary brain injury (SBI) at 7 d after intracerebral hemorrhage (ICH). (A) GRP78 protein levels and statistics in perihematoma tissues of the rat ICH model determined by Western blots. (B) The conversion of LC3‐I to LC3‐II and statistics in perihematoma tissues of the rat ICH model determined by Western blots. (C) Cleaved‐caspase 12 protein levels and statistics in perihematoma tissues of the rat ICH model determined by Western blots. (D) Fluoro‐Jade B (FJB) staining shows neuronal degradation (green). Arrows point to FJB‐positive cells. Asterisks indicate hematoma location. Bar=64 μm. FJB‐positive cells/mm2 in perihematomal brain were shown. (E) Clinical Behavior Scores. In (A, B, C, D and E), bars represent mean±SEM, **P<.01 compared with the sham group and #P<.05, ##P<.01 compared with the vehicle group, n=18. LC3, microtubule‐associated protein light‐chain 3; GRP78, glucose‐regulated protein 78; TUDCA, tauroursodeoxycholic acid
3.7. Induction of autophagy mitigated SBI 7 days after ICH
Western blot results showed that, compared with the vehicle group, at 7 days after ICH, rapamycin pretreatment significantly upregulated LC3‐II/LC3‐I ratio, while 3‐MA pretreatment significantly reduced LC3‐II/LC3‐I ratio (Figure 7A), suggesting that rapamycin and 3‐MA effectively activated and suppressed autophagy at 7 days after ICH. To assess the effects of autophagy on ER stress at 7 days after ICH, the protein level of GRP78 was determined using Western blots (Figure 7B). The results showed that, compared with the vehicle group, both rapamycin and 3‐MA could not affect the protein level of GRP78, suggesting that autophagy could not affect ER stress at 7 days after ICH. In addition, Western blots also showed that, compared with the vehicle group, the level of cleaved‐caspase 12 was significantly decreased by rapamycin pretreatment group and increased by 3‐MA pretreatment, suggesting that autophagy inhibited caspase 12 activation, and then ER stress‐induced apoptosis at 7 days after ICH (Figure 7C). Furthermore, FJB staining showed that, compared with the vehicle group, neuronal degradation significantly decreased in the rapamycin pretreatment group, whereas neuronal degradation significantly increased in the 3‐MA pretreatment group (Figure 7D). Taken together, at 7 days after ICH, autophagy inhibited ICH‐induced SBI via inhibiting caspase 12 activation.
Figure 7.
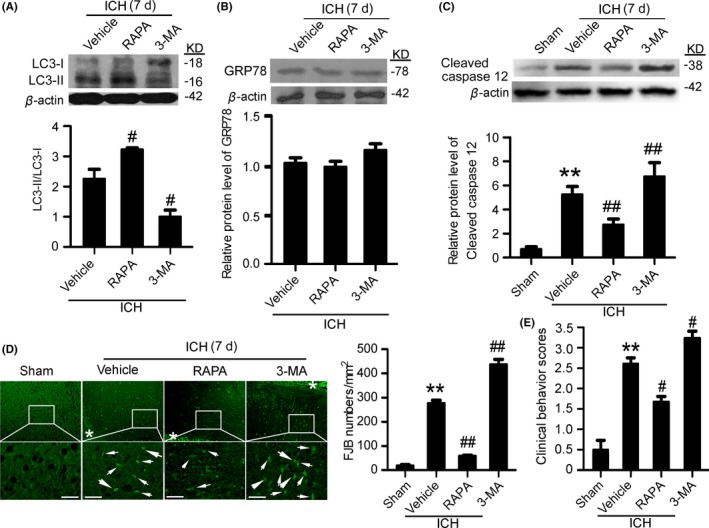
Autophagy induction mitigates secondary brain injury (SBI) at 7 d after intracerebral hemorrhage (ICH). (A) The conversion of LC3‐I to LC3‐II and statistics in perihematoma tissues of the rat ICH model determined by Western blots. (B) GRP78 protein levels and statistics in perihematoma tissues of the rat ICH model determined by Western blots. (C) Cleaved‐caspase 12 protein levels and statistics in perihematoma tissues of the rat ICH model determined by Western blots. (D) Fluoro‐Jade B (FJB) staining shows neuronal degradation (green). Arrows point to FJB‐positive cells. Asterisks indicate hematoma location. Bar=64 μm. FJB‐positive cells/mm2 in perihematomal brain were shown. (E) Clinical Behavior Scores. In (A, B, C, D, and E), bars represent mean±SEM, **P<.01 compared with the sham group and #P<.05, ##P<.01 compared with the vehicle group, n=18. LC3, microtubule‐associated protein light‐chain 3; GRP78, glucose‐regulated protein 78; RAPA, rapamycin; 3‐MA, 3‐methyladenine
3.8. Induction of autophagy enhanced the protective effect of ER stress suppression on brain injury at 7 days after ICH
We further investigated the interaction between autophagy and ER stress in SBI 7 days after ICH. Western blot results showed that, compared with the TUDCA group, the level of cleaved‐caspase 12 was significantly lower in the TM+rapamycin pretreatment group, while the level of cleaved‐caspase 12 was significantly higher in the TM+3‐MA pretreatment group (Figure 8A). In addition, FJB staining showed that, compared with the TM group, neuronal degradation significantly decreased in the TM+rapamycin pretreatment group, while neuronal degradation significantly increased in the TM+3‐MA pretreatment group (Figure 8B). Taken together, at 7 days after ICH, rapamycin‐induced autophagy enhanced the neuroprotective effect of ER stress inhibition.
Figure 8.
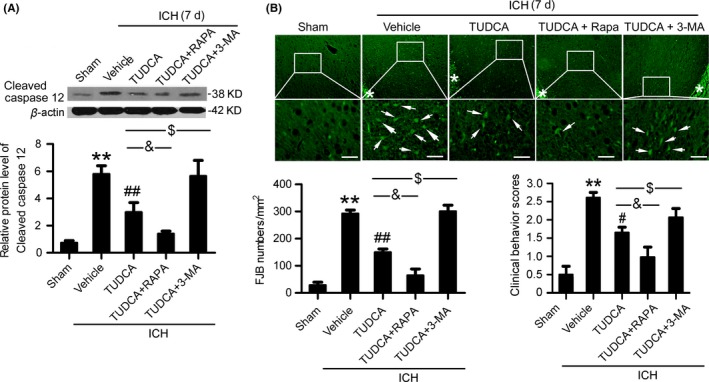
Autophagy enhanced the neuroprotective effects of endoplasmic reticulum (ER) stress inhibitors at 7 d after intracerebral hemorrhage (ICH). (A) Cleaved‐caspase 12 protein levels and statistics in perihematoma tissues of the rat ICH model determined by Western blots. (B) Fluoro‐Jade B (FJB) staining shows neuronal degradation (green). Arrows point to FJB‐positive cells. Asterisks indicate hematoma location. Bar=64 μm. FJB‐positive cells/mm2 in perihematomal brain were shown. (C) Clinical Behavior Scores. In (A, B, and C), bars represent mean±SEM, **P<.01 compared with the sham group and #P<.05, ##P<.01 compared with the vehicle group, &P<.05 and $P<.05, n=18.RAPA: rapamycin; 3‐MA, 3‐methyladenine; TUDCA, tauroursodeoxycholic acid
4. DISCUSSION
Protein misfolding and oxidative stress caused by acute central nervous system damage can lead to sustained ER dysfunction and neuronal cell death.18, 19 Autophagy is also involved in the pathogenesis of ICH.24 To date, the relationship between ER stress‐induced neuronal death and the level of autophagy after ICH has not been reported. In this study, we investigated the role of ER stress in SBI after ICH as well as the relationship between ER stress and autophagy during this process. Our results suggest that ICH condition increased the levels of autophagy and ER stress. ER stress participated in ICH‐induced SBI via caspase 12‐mediated apoptosis, at least partially. Inhibition of ER stress could attenuate brain injury both at 6 hours and at 7 days after ICH. At 6 hours after ICH, the autophagy level was excessive, which could be further enhanced by ER stress induction. The excessive autophagy also participated in caspase 12‐mediated apoptosis after ICH. The autophagic flux was damaged at 72 hours and return to be intact at 7 days after ICH. At 7 days after ICH, autophagy could enhance the protection of ER stress inhibitor possibly via clearing up the cell rubbish generated due to the early‐stage damaged autophagic flux.
In recent years, numerous studies have shown that ER dysfunction caused by ER stress plays an important role in many neurological diseases,18 including cerebral ischemia and reperfusion, sleep apnea syndrome, Alzheimer's disease, multiple sclerosis, amyotrophic lateral sclerosis, prion disease, and familial encephalopathy. ER stress‐mediated cell autophagy and apoptosis are associated with the development and treatment of these diseases. GRP78, also known as immunoglobulin heavy‐chain binding protein, is the primary chaperone in ER stress and a key molecule in this reaction. Activation of ER stress occurs when misfolded/unfolded proteins accumulate and the folding capacity of ER chaperones exceeds the capacity of the ER lumen. However, unfolded protein response (UPR) impairment due to severe or persistent stress can lead to cell death. Activation of chaperone protein gene transcription increases chaperone protein GRP78 levels, inhibits protein synthesis, and increases the folding or degradation of misfolded/unfolded proteins to reduce the burden of ER stress, which can protect cells to some extent.37, 38 However, when the ER stress response is too strong and too long in duration, it exceeds the protective effect of the ER and ultimately leads to cell apoptosis. Recent studies found that ER stress‐induced activation of several neuronal cell death pathways plays an important role in the pathophysiology of stroke. GRP78 protein is a specific marker for ER stress. Previous studies have found that GRP78 protein levels increase in rat brain tissue after SAH, while the key protein (CHOP) in ER stress‐induced apoptosis is also upregulated. TM treatment upregulates GRP78 protein levels, while TUDCA treatment downregulates GRP78 protein levels.25 In neurons cultured in vitro, oxygen deprivation significantly increased GRP78 protein levels, accompanied by decreased HSP70 protein levels and increased protein levels of CHOP, caspase‐12, and caspase‐3, which indicates that increased neuronal apoptosis may be caused by ER stress‐induced activation of the caspase pathway.39 Our results showed that, following ICH, the protein levels of GRP78 and CHOP were significantly increased respectively at 6 hours and 48 hours, continued to increase until 7 days, and significantly decreased by 14 days (Figure 2A‐C), which suggests that ER stress is activated after ICH. Six hours after ICH, TM and TUDCA significantly upregulated and downregulated GRP78 protein levels, respectively, which indicates that TM and TUDCA effectively activate and inhibit ER stress, respectively. Thus, we hypothesize that ER stress is activated after ICH, which leads to activation of the neuronal apoptosis pathway, an increase in neuronal apoptosis and necrosis and that treatment with inhibitors of ER stress exerts neuroprotective effects following ICH.
A study has shown that, at 7 days after ICH, the ratio of LC3‐II/LC3‐I protein levels is significantly increased.24 In this study, we also found that LC3‐II accumulation at 6 hours and 7 days after ICH (Figure 2). In mice, lack of autophagy modulator Atg7 mitigated hippocampal neuronal death after hypoxic‐ischemic brain injury.40 Rapamycin treatment could inhibit the insulin‐like growth factor‐1/mammalian target of rapamycin complex‐1 signaling pathway, selectively activate autophagy, downregulate p62 protein levels, and reduce excessive accumulation of autophagy substrate caused by autophagy flux disorder, which results in reduced neuronal apoptosis, promotion of neuronal repair, and improvement in neurological dysfunction.41, 42 Excessive autophagy contributes to neuron death in cerebral ischemia.43 All these results suggest an autophagy activation after ICH and a dual role of autophagy in central nervous system disease and that whether autophagy flux is intact and the autophagy level are key factors influencing the autophagy efficacy. In this study, with the use of lysosomal inhibitor Baf A1, the data showed that autophagy flux is intact at 6 hours and 7 days, while it is blocked at 72 hours (Figure 2F and G). We also found that, at 6 hours after ICH, rapamycin‐induced autophagy worsened SBI (Figure 4). This may be explained by that excessive autophagy increases SBI at the early stage after ICH, which further proved by the neuroprotection mediated by 3‐MA‐induced autophagy inhibition (Figure 4). Also, we found that, at 7 days after ICH, autophagy exerts protection against SBI and inhibits ER stress‐dependent apoptosis (Figure 7). This may be explained by that, at 7 days after ICH, autophagy exerts neuroprotection possibly via clearing up the cell rubbish generated due to the early‐stage damaged autophagic flux.
This study was designed to study the role of autophagy and ER stress in SBI at 6 hours and 7 days after ICH onsets. To obtain the ideal levels of autophagy and ER stress at 6 hours and 7 days after ICH onsets, we performed drug pretreatment and post‐treatment in our preliminary experiments (data not shown). Based on the results of the preliminary experiments, in Part III experiment, the time points for drug administration were 24 hours before ICH and 2 hours before sacrifice, while in Part IV experiment, the time points for drug administration were 6 days after ICH and 2 hours before sacrifice. Because the rats in Part IV was killed at 7 days after ICH, the time points in Part IV, the drugs were administered at 6 days after ICH, are consistent with that in Part III, the drugs were administered at 24 hours before ICH. In other words, both the rats in Part III and Part IV received drug administration at 24 hours and 2 hours before sacrifice. As far as we know, it is the first time to systematically describe the methodology for regulating autophagy and ER stress after ICH.
Previous studies suggest that ER stress and obstacles to autophagy flux are involved in many disease processes.44 Our study also found that GRP78 protein levels were elevated within a certain time window after ICH, along with increased LC3‐II/LC3‐I, which suggests that autophagy activation mediates ER activation. Barriers to ER activation increase autophagy flux obstacles, which result in increased accumulation of LC3‐II after ICH. We found that 6 hours after ICH, rapamycin intensified SBI and worsened SBI with activation of ER stress. This suggests that, during the early stage following ICH, autophagy activation plays a role in nerve damage and suppression of ER stress may enhance the role of autophagy inhibitors in brain protection. Seven days after ICH, we found that rapamycin reduced SBI and played a synergistic role in brain protection due to TUDCA suppression of ER stress. Although modest autophagy is essential for cell survival, abnormal activation of autophagy pathways can lead to SBI in chronic and acute central nervous system injury. Control of autophagy at moderate physiological stress levels is conducive to recovery of intracellular components and tissue repair, while excessive activation of autophagy as in serious pathologic stress can damage and kill cells.21 ER stress can increase the formation of autophagosomes through the inositol‐requiring enzyme 1‐c‐Jun N‐terminal kinase (IRE1‐JNK) signaling pathway and ER‐associated protein degradation (ERAD) inactivation. These result in a failure to produce protein folding, which makes cells vulnerable to ER stress damage.45 Studies have shown that autophagy activated by ER stress is beneficial, and removal of autophagy substrate does not require unfolded proteins in the ubiquitin‐proteasome system.46 However, UPR‐induced increase in cytosolic calcium and activation of the IRE1 pathway is one of the regulatory mechanisms of ER stress‐induced autophagy in mammalian cells.47 Other studies indicate that ER stress‐induced autophagy contributes to the neuroprotection of ischemic preconditioning.48 Furthermore, precise molecular mechanisms of ER function are unclear, such as which ER is involved in autophagy after ICH, and how do pathways that subserve ER stress‐induced autophagy interact with those that mediate activation of cell death.
The current study has some limitations. First, the used pharmacological tools in this study are not absolutely specific for autophagy and ER stress. Fundamentally, 3‐MA is a PI3K/Akt inhibitor and Baf A1 is a H+‐ATPase inhibitor. They not only disrupt autophagy. Second, neuroinflammation and oxidative stress are critical for neuronal survival in ICH. We only focused on the interaction between ER stress and autophagy in ICH‐induced brain cell death. Finally, our study used healthy adult male SD rats, which did not mimic human high‐risk populations maximally, such as patients with cardiovascular diseases and the elderly.
CONCLUSIONS
Our results demonstrated that autophagy and ER stress are activated after ICH, and inhibition of ER stress exerts neuroprotective effects in the brain. However, autophagy plays a dual role in brain injury after ICH: At 6 hours after ICH, excessive autophagy may participate in ER stress‐induced brain injury; at 7 days after ICH, autophagy could enhance the protection of ER stress inhibitor via clearing up the cell rubbish generated due to the early‐stage damaged autophagic flux. As ICH‐induced autophagy itself has both beneficial and detrimental roles at part in a time‐dependent manner, more specific time point for interventions targeting autophagy in ICH treatment could be considered.
CONFLICT OF INTEREST
The authors declare no competing financial interests.
ACKNOWLEDGMENTS
This work was supported by grants from the National Natural Science Foundation of China (No. 81601009) and Suzhou Government (No. SZS201413).
Duan X‐C, Wang W, Feng D‐X, et al. Roles of autophagy and endoplasmic reticulum stress in intracerebral hemorrhage‐induced secondary brain injury in rats. CNS Neurosci Ther. 2017;23:554–566. 10.1111/cns.12703
The first two authors contributed equally to this work.
Contributor Information
Hai‐Ying Li, Email: sz_haiyingli@sina.com.
Zhong Wang, Email: lhy1015@suda.edu.cn.
REFERENCES
- 1. Iwuchukwu I, Nguyen D, Sulaiman W. MicroRNA profile in cerebrospinal fluid and plasma of patients with spontaneous intracerebral hemorrhage. CNS Neurosci Ther. 2016;22:1015‐1018. [DOI] [PMC free article] [PubMed] [Google Scholar]
- 2. Zhang Y, Yang Y, Zhang GZ, et al. Stereotactic administration of edaravone ameliorates collagenase‐induced intracerebral hemorrhage in rat. CNS Neurosci Ther. 2016;22:824‐835. [DOI] [PMC free article] [PubMed] [Google Scholar]
- 3. Brüning T, Al‐Khaled M. Risk of symptomatic intracerebral hemorrhage after thrombolysis with rt‐PA: the SEDAN score. CNS Neurosci Ther. 2015;21:296‐297. [DOI] [PMC free article] [PubMed] [Google Scholar]
- 4. Behrouz R. Re‐exploring tumor necrosis factor alpha as a target for therapy in intracerebral hemorrhage. Transl Stroke Res. 2016;7:93‐96. [DOI] [PubMed] [Google Scholar]
- 5. Wan S, Cheng Y, Jin H, et al. Microglia activation and polarization after intracerebral hemorrhage in mice: the role of protease‐activated receptor‐1. Transl Stroke Res. 2016;7:478‐487. [DOI] [PMC free article] [PubMed] [Google Scholar]
- 6. Zhao XR, Gonzales N, Aronowski J. Pleiotropic role of PPARγ in intracerebral hemorrhage: an intricate system involving Nrf2, RXR, and NF‐κB. CNS Neurosci Ther. 2015;21:357‐366. [DOI] [PMC free article] [PubMed] [Google Scholar]
- 7. Dang G, Yang Y, Wu G, Hua Y, Keep RF, Xi G. Early erythrolysis in the hematoma after experimental intracerebral hemorrhage. Transl Stroke Res. 2017;8:174‐182. [DOI] [PMC free article] [PubMed] [Google Scholar]
- 8. Jiang B, Li L, Chen Q, et al. Role of glibenclamide in brain injury after intracerebral hemorrhage. Transl Stroke Res. 2017;8:183‐193. [DOI] [PubMed] [Google Scholar]
- 9. Gao Y, Ma L, Luo CL, et al. IL‐33 exerts neuroprotective effect in mice intracerebral hemorrhage model through suppressing inflammation/apoptotic/autophagic pathway. Mol Neurobiol. 2016. doi: 10.1007/s12035-016-9947-6. [DOI] [PubMed] [Google Scholar]
- 10. Yuan B, Shen H, Lin L, et al. Autophagy promotes microglia activation through beclin‐1‐atg5 pathway in intracerebral hemorrhage. Mol Neurobiol. 2017;54:115‐124. [DOI] [PubMed] [Google Scholar]
- 11. Chen CW, Chen TY, Tsai KL, et al. Inhibition of autophagy as a therapeutic strategy of iron‐induced brain injury after hemorrhage. Autophagy. 2012;8:1510‐1520. [DOI] [PubMed] [Google Scholar]
- 12. Ratliff EP, Barekatm A, Lipinski MM, Finley KD. Brain trauma and autophagy: What flies and mice can teach us about conserved responses. Autophagy. 2016;12:2256‐2257. [DOI] [PMC free article] [PubMed] [Google Scholar]
- 13. Papadakis M, Hadley G, Xilouri M, et al. Tsc1 (hamartin) confers neuroprotection against ischemia by inducing autophagy. Nat Med. 2013;19:351‐357. [DOI] [PMC free article] [PubMed] [Google Scholar]
- 14. Wang P, Xu TY, Wei K, et al. ARRB1/β‐arrestin‐1 mediates neuroprotection through coordination of BECN1‐dependent autophagy in cerebral ischemia. Autophagy. 2014;10:1535‐1548. [DOI] [PMC free article] [PubMed] [Google Scholar]
- 15. Wang P, Guan YF, Du H, et al. Induction of autophagy contributes to the neuroprotection of nicotinamide phosphoribosyltransferase in cerebral ischemia. Autophagy. 2012;8:77‐87. [DOI] [PubMed] [Google Scholar]
- 16. Xie C, Ginet V, Sun Y, et al. Neuroprotection by selective neuronal deletion of Atg7 in neonatal brain injury. Autophagy. 2016;12:410‐423. [DOI] [PMC free article] [PubMed] [Google Scholar]
- 17. Papp D, Kovács T, Billes V, et al. AUTEN‐67, an autophagy‐enhancing drug candidate with potent antiaging and neuroprotective effects. Autophagy. 2016;12:273‐286. [DOI] [PMC free article] [PubMed] [Google Scholar]
- 18. Nakka VP, Prakash‐Babu P, Vemuganti R. Crosstalk Between Endoplasmic Reticulum Stress, Oxidative Stress, and Autophagy: Potential Therapeutic Targets for Acute CNS Injuries. Mol Neurobiol. 2016;53:532‐544. [DOI] [PMC free article] [PubMed] [Google Scholar]
- 19. He Z, Ostrowski RP, Sun X, et al. CHOP silencing reduces acute brain injury in the rat model of subarachnoid hemorrhage. Stroke. 2012;43:484‐490. [DOI] [PMC free article] [PubMed] [Google Scholar]
- 20. Mracsko E, Veltkamp R. Neuroinflammation after intracerebral hemorrhage. Front Cell Neurosci. 2014;8:388. [DOI] [PMC free article] [PubMed] [Google Scholar]
- 21. Mehrpour M, Esclatine A, Beau I, Codogno P. Autophagy in health and disease. 1. Regulation and significance of autophagy: an overview. Am J Physiol Cell Physiol. 2010;298:C776‐C785. 10.1152/ajpcell.00507.2009. [DOI] [PubMed] [Google Scholar]
- 22. Klionsky D, Abdelmohsen K, Abe A, et al. Guidelines for the use and interpretation of assays for monitoring autophagy (3rd edition). Autophagy. 2016;12:1‐222. [DOI] [PMC free article] [PubMed] [Google Scholar]
- 23. Mizushima N, Levine B. Autophagy in mammalian development and differentiation. Nat Cell Biol. 2010;12:823‐830. [DOI] [PMC free article] [PubMed] [Google Scholar]
- 24. He Y, Wan S, Hua Y, Keep RF, Xi G. Autophagy after experimental intracerebral hemorrhage. J Cereb Blood Flow Metab. 2008;28:897‐905. [DOI] [PubMed] [Google Scholar]
- 25. Yan F, Li J, Chen J, et al. Endoplasmic reticulum stress is associated with neuroprotection against apoptosis via autophagy activation in a rat model of subarachnoid hemorrhage. Neurosci Lett. 2014;563:160‐165. [DOI] [PubMed] [Google Scholar]
- 26. Liu S, Sarkar C, Dinizo M, et al. Disrupted autophagy after spinal cord injury is associated with ER stress and neuronal cell death. Cell Death Dis. 2015;6:e1582. [DOI] [PMC free article] [PubMed] [Google Scholar]
- 27. Deinsberger W, Vogel J, Kuschinsky W, Auer LM, Boker DK. Experimental intracerebral hemorrhage: description of a double injection model in rats. Neurol Res. 1996;18:475‐477. [DOI] [PubMed] [Google Scholar]
- 28. Krokowski D, Han J, Saikia M, et al. A self‐defeating anabolic program leads to beta‐cell apoptosis in endoplasmic reticulum stress‐induced diabetes via regulation of amino acid flux. J Biol Chem. 2013;288:17202‐17213. [DOI] [PMC free article] [PubMed] [Google Scholar]
- 29. Lee JS, Lee JS, Zheng Z, et al. Pharmacologic ER stress induces non‐alcoholic steatohepatitis in an animal model. Toxicol Lett. 2012;211:29‐38. [DOI] [PMC free article] [PubMed] [Google Scholar]
- 30. Ding K, Wang H, Wu Y, et al. Rapamycin protects against apoptotic neuronal death and improves neurologic function after traumatic brain injury in mice via modulation of the mTOR‐p53‐Bax axis. J Surg Res. 2015;194:239‐247. [DOI] [PubMed] [Google Scholar]
- 31. Tanemura M, Ohmura Y, Deguchi T, et al. Rapamycin causes upregulation of autophagy and impairs islets function both in vitro and in vivo. Am J Transplant. 2012;12:102‐114. [DOI] [PubMed] [Google Scholar]
- 32. Kim WY, Nam SA, Song HC, et al. The role of autophagy in unilateral ureteral obstruction rat model. Nephrology. 2012;17:148‐159. [DOI] [PubMed] [Google Scholar]
- 33. Erlich S, Alexandrovich A, Shohami E, Pinkas‐Kramarski R. Rapamycin is a neuroprotective treatment for traumatic brain injury. Neurobiol Dis. 2007;26:86‐93. [DOI] [PubMed] [Google Scholar]
- 34. Zhu HT, Bian C, Yuan JC, et al. Curcumin attenuates acute inflammatory injury by inhibiting the TLR4/MyD88/NF‐kappaB signaling pathway in experimental traumatic brain injury. J Neuroinflammation. 2014;11:59. [DOI] [PMC free article] [PubMed] [Google Scholar]
- 35. Lin S, Yin Q, Zhong Q, et al. Heme activates TLR4‐mediated inflammatory injury via MyD88/TRIF signaling pathway in intracerebral hemorrhage. J Neuroinflammation. 2012;9:46. [DOI] [PMC free article] [PubMed] [Google Scholar]
- 36. Li H, Huang S, Wang S, et al. Targeting annexin A7 by a small molecule suppressed the activity of phosphatidylcholine‐specific phospholipase C in vascular endothelial cells and inhibited atherosclerosis in apolipoprotein E(‐)/(‐)mice. Cell Death Dis. 2013;4:e806. [DOI] [PMC free article] [PubMed] [Google Scholar]
- 37. Ni M, Zhang Y, Lee AS. Beyond the endoplasmic reticulum: atypical GRP78 in cell viability, signalling and therapeutic targeting. Biochem J. 2011;434:181‐188. [DOI] [PMC free article] [PubMed] [Google Scholar]
- 38. Quinones QJ, de Ridder GG, Pizzo SV. GRP78: a chaperone with diverse roles beyond the endoplasmic reticulum. Histol Histopathol. 2008;23:1409‐1416. [DOI] [PubMed] [Google Scholar]
- 39. Sheng R, Liu XQ, Zhang LS, et al. Autophagy regulates endoplasmic reticulum stress in ischemic preconditioning. Autophagy. 2012;8:310‐325. [DOI] [PubMed] [Google Scholar]
- 40. Koike M, Shibata M, Tadakoshi M, et al. Inhibition of autophagy prevents hippocampal pyramidal neuron death after hypoxic‐ischemic injury. Am J Pathol. 2008;172:454‐469. [DOI] [PMC free article] [PubMed] [Google Scholar]
- 41. Bitto A, Lerner CA, Nacarelli T, Crowe E, Torres C, Sell C. P62/SQSTM1 at the interface of aging, autophagy, and disease. Age (Dordr). 2014;36:9626. [DOI] [PMC free article] [PubMed] [Google Scholar]
- 42. Duran A, Amanchy R, Linares JF et al. p62 is a key regulator of nutrient sensing in the mTORC1 pathway. Mol Cell 2011;44:134‐146. [DOI] [PMC free article] [PubMed] [Google Scholar]
- 43. Shi R, Weng J, Zhao L, Li XM, Gao TM, Kong J. Excessive autophagy contributes to neuron death in cerebral ischemia. CNS Neurosci Ther. 2012;18:250‐260. [DOI] [PMC free article] [PubMed] [Google Scholar]
- 44. Yuzefovych LV, LeDoux SP, Wilson GL, Rachek LI. Mitochondrial DNA damage via augmented oxidative stress regulates endoplasmic reticulum stress and autophagy: crosstalk, links and signaling. PLoS One. 2013;8:e83349. [DOI] [PMC free article] [PubMed] [Google Scholar]
- 45. Ogata M, Hino S, Saito A, et al. Autophagy is activated for cell survival after endoplasmic reticulum stress. Mol Cell Biol. 2006;26:9220‐9231. [DOI] [PMC free article] [PubMed] [Google Scholar]
- 46. Kim I, Xu W, Reed JC. Cell death and endoplasmic reticulum stress: disease relevance and therapeutic opportunities. Nat Rev Drug Discov. 2008;7:1013‐1030. [DOI] [PubMed] [Google Scholar]
- 47. Kouroku Y, Fujita E, Tanida I, et al. ER stress (PERK/eIF2alpha phosphorylation) mediates the polyglutamine‐induced LC3 conversion, an essential step for autophagy formation. Cell Death Differ. 2007;14:230‐239. [DOI] [PubMed] [Google Scholar]
- 48. Gao B, Zhang XY, Han R, et al. The endoplasmic reticulum stress inhibitor salubrinal inhibits the activation of autophagy and neuroprotection induced by brain ischemic preconditioning. Acta Pharmacol Sin. 2013;34:657‐666. [DOI] [PMC free article] [PubMed] [Google Scholar]


