

Summary
Aims
The main purpose was to verify the potent capacity of Neurotropin® against neuronal damage in hippocampus and to explore its underlying mechanisms.
Methods
HT22 cells were treated with 40 μmol/L Aβ25‐35 in the presence of various concentrations of Neurotropin® or in its absence. The cell viability was assessed with a CCK‐8 assay, and flow cytometry was used to measure cell apoptosis, intracellular ROS levels, and mitochondrial membrane potential. Aβ plaques were examined by Bielschowsky silver staining, and the activities of antioxidants were detected in hippocampus of APP/PS1 mice after Neurotropin® treatment. The expression of proteins, including HIF‐1α, Bcl‐2, Bax, and MAPKs signaling molecules was evaluated by Western blot.
Results
Neurotropin® significantly reversed the cell injury induced by Aβ25‐35 through increasing cell viability and mitochondrial membrane potential, decreasing intracellular ROS and cell apoptosis of HT22 cells (P<.05). Furthermore, Neurotropin® markedly reduced the formation of Aβ plaques and upregulated the activities of antioxidants (P<.05). Additionally, the protein expression of HIF‐1α, p‐ERK1/2, p‐JNK, and p‐P38 was significantly inhibited in hippocampus of APP/PS1 mice.
Conclusions
Neurotropin® exhibited a potent neuroprotective effect on inhibiting Aβ‐induced oxidative damage and alleviating Aβ deposition in hippocampus via modulation of HIF‐1α/MAPK signaling pathway.
Keywords: Alzheimer's disease, HIF‐1α/MAPK signaling, neuroprotective effect, neurotropin®
1. Introduction
According to the 2016 World Alzheimer Report, the global population is aging at a rapid pace due to rising life expectancy. It is reported that there are 47 million people living with dementia worldwide, and the number is projected to increase over more than 131 million by 2050. In China, the number is expected to rise over 16 million by 2030.1 Clearly, the prevalence of dementia results in huge impacts on people's life quality and economy.
Alzheimer's disease (AD) is the most common progressive dementia among the elderly. Up to date, there are no effective antidementia drugs available for the management of AD due to its complex mechanisms. What's more, it is known that it will require enormous research costs and efforts for the discovery, development, and clinical trials for a new antidementia drug. For example, the search for Alzheimer's drug solanezumab ended in failure after spending millions on late‐stage trials recently. Therefore, it is pretty necessary to reassess a promising current drug to halt the progressive cognitive dysfunctions with an established safety profile for AD.
Neurotropin® (NTP), a nonprotein extract from inflamed rabbit skin inoculated with vaccinia virus, is a well‐known analgesic drug for treatment of chronic pain, such as low back pain, postherpetic neuralgia, neck‐shoulder‐arm syndrome, hyperesthesia of subacute myelo‐optic neuropathy (SMON), and fibromyalgia.2, 3, 4, 5 Recently, it is reported that NTP‐stimulated BDNF expression in SH‐SY5Y cells, and repeated oral administration of NTP (200 NU/kg/d for 3 months) inhibited the decline of hippocampal BDNF expression, accompanied by improvement in spatial cognition of Ts65Dn mice, a model of Down syndrome.6 Furthermore, Nakajo et al.7 demonstrated that chronic NTP treatment reduced the volumes of infracted lesions, brain edema, and the extent of the neurological deficits, and also enhanced spatial learning of C57BL/6J mice. A pilot study for clinical applications of NTP had shown that NTP was capable of improving clinical symptoms of senile patients with dementia.8 Besides, it is found by Hoshino et al.9 that NTP demonstrated cytoprotective effects against hydrogen peroxide and cigarette smoke through elevating the expression of redox‐regulating molecules, glutathione peroxidase, and catalase and, especially, thioredoxin‐1. NTP also increased the cellular thioredoxin‐1 content and regulated thioredoxin‐1 release from cells, suppressing intracellular oxidative activity. Nevertheless, the potential antioxidative effect of NTP against neuronal damage remains to be determined. Besides, oxidative stress plays a crucial role in the pathogenetic mechanism for AD. Thus, we investigated the antioxidative capabilities of NTP on HT22 cells and APP/PS1 mice to obtain evidence for the administration of NTP for the treatment of AD.
In this study, we used immortalized murine hippocampal neurons (HT22 cells) as a cell model to explore whether NTP had potential capability to alleviate Aβ25‐35‐induced neuronal damage. As reported, Aβ25‐35 is the shortest active fragment with similar neurotoxicity effect to a full‐length Aβ.10 In addition, Aβ25‐35 can be easily synthesized and has been widely used in scientific researches.11, 12, 13 Thus, we choose this fragment in our research. In vivo, we examined the alterations of the activities of antioxidants and Aβ deposition in hippocampus of APP/PS1 mice after administration of NTP and further investigated the potential underlying mechanisms.
2. Materials and Methods
2.1. Materials
Neurotropin® was provided from Nippon Zoki Pharmaceutical Co.Ltd. (Osaka, Japan). Aβ25‐35 was synthesized by Shanghai Sangon Biological Engineering Technology & Services Co. (Shanghai, China). Fetal bovine serum (FBS), medium (DMEM), neurobasal medium, and N2 supplement were obtained from Gibco (New York, NY, USA). A cell counting kit‐8 (CCK‐8) was acquired from Dojin Kagaku (Kumamoto, Kyushu, Japan). Apoptosis detection kit was purchased from eBioscience (San Diego, CA, USA). A ROS detection kit and mitochondrial membrane potential assay kit with JC‐1 were purchased from the Beyotime Institute of Biotechnology (Shanghai, China). Hoechst 33342 and propidium iodide (PI) were procured from Invitrogen/Life Technologies (Carlsbad, CA, USA). SOD, GSH, MDA, and CAT kits were supplied by Jiancheng Bioengineering Institute (Nanjing, China).The following primary antibodies against p‐ERK1/2, p‐P38, p‐JNK, ERK1/2, P38, JNK, Bcl‐2, Bax, and secondary antibody horseradish peroxidase (HRP)‐conjugated goat antirabbit IgG were obtained from Cell Signaling Technology (Danvers, MA, USA). The primary antibody against HIF‐1α was obtained from Abcam (Cambridge, MA, USA), and the primary antibody against Aβ1‐42 was purchased from Sigma‐Aldrich (St. Louis, MO, USA). The chemiluminescent horseradish peroxidase substrate was purchased from Millipore (Billerica, MA, USA). All other routine experimental supplies and reagents were acquired from Thermo Fisher, Invitrogen, and MR Biotech.
2.2. Cell culture, differentiation, Aβ25‐35 preparation, and treatment
The methods used for the culture and differentiation of HT22 cells have been previously described in detail.14, 15 Briefly, HT22 cells were cultured in DMEM media supplemented with 10% FBS, 100 U/mL penicillin, and 100 μg/mL streptomycin, and differentiated in neurobasal medium with N2 supplement for 24 hours before treatment. Aβ25‐35 was diluted in sterile saline at a concentration of 0.5 mmol/L and was maintained at 37°C for 7 days to preage the peptide. According to our previous study,13 the viabilities of HT22 cells could significantly decrease when the cells were exposed to 40 μmol/L Aβ25‐35 for 24 hours. Thus, we selected 40 μmol/L as the optimal concentration of Aβ25‐35 for our subsequent research. HT22 cells were preconditioned with specified doses of NTP for 16 hours and subsequently treated with or without 40 μmol/L Aβ25‐35 for 24 hours.
2.3. Cytotoxicity assays
A CCK‐8 assay was applied to assess the viabilities of HT22 cells. Briefly, following different treatment interventions, 10 μL/well of CCK‐8 reagent was added to the cells, after which HT22 cells were incubated for 1.5 hours at 37°C and 5% CO2 in dark conditions. Absorbance of the samples was detected at 450 nm with a multifunctional microplate reader (SpectraMax M5, Sunnyvale, CA, USA).
2.4. Apoptosis assay by flow cytometry (FCM)
Apoptotic cell death of HT22 cells was measured by flow cytometric analysis with annexin V‐FITC and PI apoptosis detection kit as detailed previously.15 Briefly, HT22 cells were washed twice using phosphate‐buffered saline (PBS) and incubated with annexin V‐FITC and PI in binding buffer after 24‐hour exposure to Aβ25‐35 in the presence or absence of NTP. The cell suspension was applied for flow cytometric analysis with a flow cytometer (FACSCalibur; BD, Franklin Lakes, NJ, USA). Ten thousand cells per sample were measured. In parallel with the flow cytometric analysis, Hoechst 33342 and PI staining were performed for morphological assessment. The HT22 cells were fixed with 4% paraformaldehyde for 10 minutes. After three rinses with PBS, the cells were stained with 5 mg/L Hoechst 33342 and 1 mg/L PI. Cells were observed under a fluorescent microscope (BX51WI, Olympus, Tokyo, Japan).
2.5. Measurement of intracellular ROS generation
Intracellular ROS were measured by an oxidation‐sensitive fluorescent probe (DCFH‐DA) as reported previously.16 In brief, HT22 cells were pretreated with NTP for 16 hours and then exposed to 40 μmol/L Aβ25‐35 for 24 hours. After treatment, cells were collected by pipetting, washed twice with PBS, and incubated with 10 μmol/L DCFH‐DA at 37°C for 20 minutes. Ten thousand cells per sample were detected using a FACSCalibur flow cytometer. The geomean fluorescence intensity in positive cells represents the level of ROS. In addition, the DCF fluorescence intensity was also observed under a fluorescent microscope.
2.6. Estimation of the mitochondrial membrane potential (MMP, △Ψmt)
MMP was estimated using a mitochondrial membrane potential assay kit with JC‐1 according to the manufacturer's instructions. After treated, cells were washed twice with PBS and then stained with 5 μL/mL JC‐1 for 20 minutes at 37°C. After two rinses with JC‐1 staining buffer, the cell suspension was collected, and MMP was monitored using a flow cytometer. Approximately 10 000 events from each sample were used for flow cytometric analysis.
2.7. Animals and drug administration
Six‐month‐old male APP/PS1 transgenic mice were obtained from Jackson Laboratory (Bar Harbor, ME, USA) and were maintained with free access to food and water. All mice used in this study were handled according to the protocols approved by the Institutional Animal Care and Use Committee of Sun Yat‐sen University. The subjects in this study consisted of six‐month‐old APP/PS1 transgenic mice (TG, n=16) and wild‐type littermates (WT, n=8). Animals were randomly assigned into three groups: NTP‐treated (TG+NTP), control (TG) APP/PS1 transgenic mice, and control wild‐type (WT) mice. Treated mice received daily administration of NTP (200 NU/kg/d) for 3 months by oral gavage delivery. The remaining mice were treated with saline (0.9% NaCl) as placebo control.
2.8. Measurements of SOD, MDA, GSH, and CAT
The activities of superoxide dismutase (SOD), glutathione (GSH), and catalase (CAT), as well as the contents of malondialdehyde (MDA) were determined using the commercial kits according to the manufacturer's instructions. The tissues of hippocampus were homogenized by sonication in cold 0.9% NaCl (9 mL), centrifuged at 4000 g for 10 minutes at 4°C, and the supernatants were collected and stored at 80°C for the subsequent analysis. Protein concentration in the supernatant was assessed using micro BCA protein assay kit.
2.9. Bielschowsky silver staining and immunohistochemistry
Bielschowsky silver staining was performed on fixed sections using the previously published method.17, 18 For immunohistochemical staining, the mice brain sections were stained with DAB kit according to the instructions of the manufacturer for peroxidase labeling. Images were acquired from a fluorescent microscope. The primary antibody used in immunohistochemical staining was mouse anti‐HIF‐1α (1:800; Abcam, MA, USA). The surface area of the senile plaques and HIF‐1α positive cells were measured and compared as percentage of the hippocampus with Image J software (NIH, Bethesda, MD, USA).
2.10. Western blot analysis
After treatment, HT22 cells were lysed with an appropriate amount of boiling, denaturing lysate buffer (1% SDS, 1 mmol/L sodium orthovanadate, 10 mmol/L Tris‐Cl, pH 7.4) supplemented with a protease inhibitor cocktai. Sample proteins of mouse hippocampus were extracted in rapid immunoprecipitation assay buffer (50 mmol/L Tris [pH 7.4], 150 mmol/L NaCl, 1% Triton X‐100, 1% sodium deoxycholate, 0.1% sodium dodecyl sulfate [SDS]). Western blotting and semiquantitative analyses were performed by previously described procedures.15, 19 Primary antibodies and dilution rates used were listed as follow: HIF‐1α, 1:2000; Bcl‐2, 1:1000; Bax, 1:1000; Aβ1‐42, 1:1000; p‐JNK, 1:500; p‐P38, 1:500; p‐ERK1/2, 1:500; JNK, 1:1000; P38, 1:500; ERK1/2, 1:2000; and β‐actin,1:1000.
2.11. Statistical analysis
All data were expressed as mean±SE, and all statistical analyses were carried out using the SPSS 16.0 software (SPSS Inc., Chicago, IL, USA). One‐way analysis of variance (ANOVA) with post hoc tests was used between groups, and differences between groups were compared using Student's t test. Differences were considered statistically significant at P<.05.
3. Results
3.1. In vitro neuroprotection by neurotropin®
As shown in Figure 1, pretreatment with NTP at various concentrations from 0.001 to 0.1 UN/mL suppressed cytotoxicity induced by Aβ25‐35 (P<.05). Flow cytometric analysis of cell apoptosis demonstrated that the administration of NTP from 0.001 to 0.1 UN/mL could significantly inhibit cell apoptosis caused by Aβ25‐35 (P<.05; Figure 2A‐F). A similar effect was observed by fluorescent microscopy in Hoechst 33342 and PI staining (Figure 2G‐K). We next explored whether NTP alleviated ROS levels. NTP treatment decreased the geomean DCF fluorescence, and the effect was markedly significant at the concentrations of 0.001 and 0.01 UN/mL, but no significant differences of ROS generation were observed at the dose of 0.1 UN/mL, suggesting that high concentration of NTP may have no effect on suppressing intracellular ROS generation (Figure 3A‐F). The observation of ROS level by fluorescent microscopy was consistent with the results obtained from flow cytometry (Figure 3G‐K). Moreover, JC‐1 staining revealed that mitochondrial membrane potential was attenuated by 0.01 NU/mL NTP compared to the Aβ25‐35 group (Figure 4A‐D).
Figure 1.
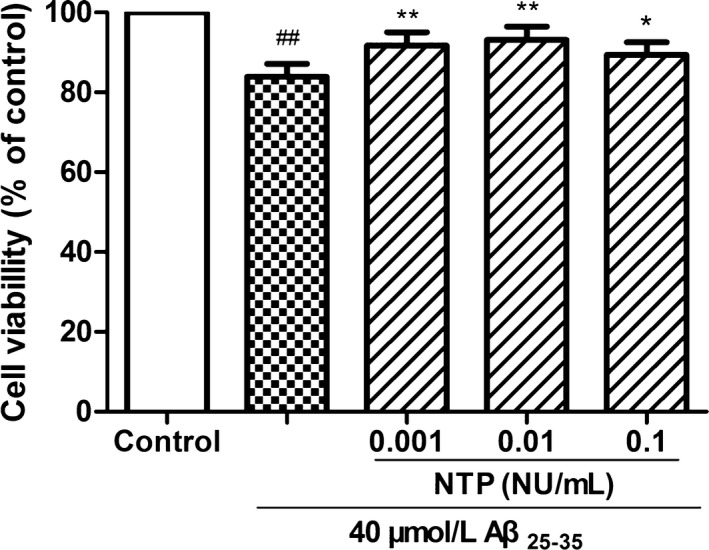
Neurotropin® (NTP) inhibited Aβ25‐35‐induced decrease in cell viability. HT22 cells were coincubated with 40 μmol/L Aβ25‐35 for 24 h after pretreatment with various concentrations of NTP for 16 h, following the evaluation of cell viability with CCK8 assays. Data were represented as relative percentage to the control group and shown as mean±SE (n=6). ## P<.01 versus control, *P<.05 and **P<.01 versus Aβ25‐35 group
Figure 2.
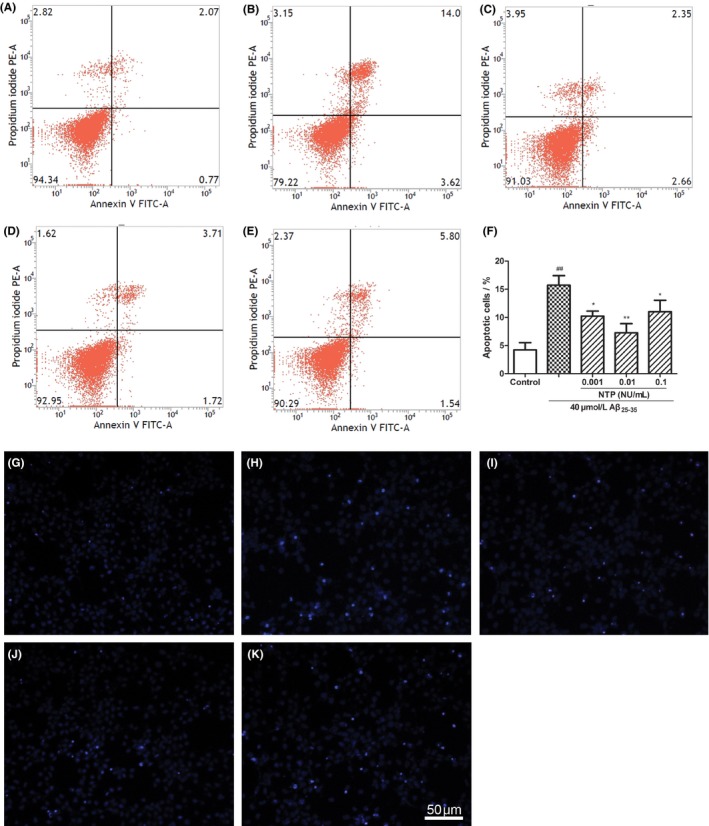
Neurotropin® (NTP) alleviated Aβ25‐35‐induced apoptosis. (A) Control group. (B) HT22 cells were exposed to 40 μmol/L Aβ25‐35 for 24 h. (C‐E) HT22 cells were coincubated with 40 μmol/L Aβ25‐35 for 24 h after pretreatment with various concentrations of NTP (0.001, 0.01, 0.1 UN/mL) for 16 h. Cell apoptosis was assessed by flow cytometry. (F) Statistical results of cell apoptotic rates. (G‐K) HT22 cells were stained with Hoechst 33342 and propidium iodide (PI) and observed under a fluoroscent microscope after treatment. As demonstrated in the pictures, Aβ25‐35 induced apoptosis was characterized by condensed, intensely fluorescent nuclei. Neurotropin® markedly reduced the number of apoptotic cells. Values were represented as relative percentage to the control group and shown as mean±SE (n=6). ## P<.01 versus control, *P<.05 and **P<.01 versus Aβ25‐35 group
Figure 3.
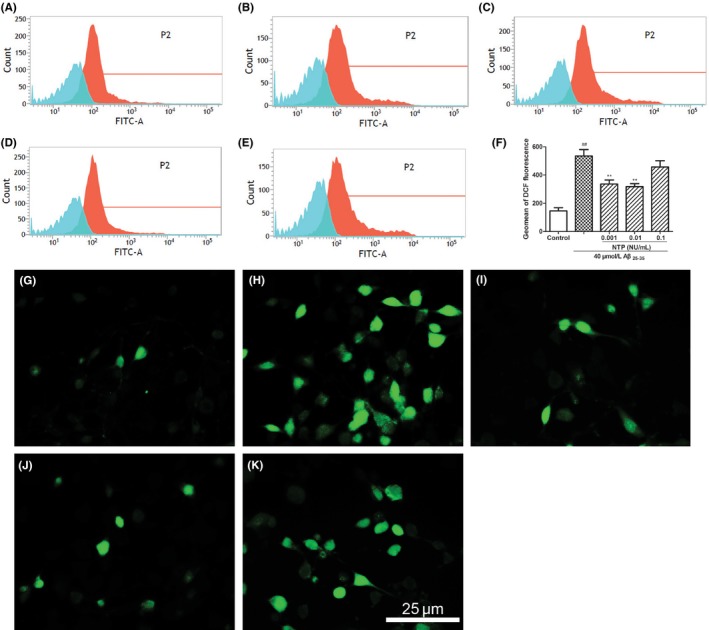
Neurotropin® (NTP) ameliorated Aβ25‐35‐induced intracellular ROS level. (A) Control group. (B) HT22 cells were treated with 40 μmol/L Aβ25‐35 for 24 h. (C‐E) HT22 cells were coincubated with 40 μmol/L Aβ25‐35 for 24 h after pretreatment with various concentrations of NTP (0.001, 0.01, 0.1 UN/mL) for 16 h. Cells were stained with H2DCFDA for 20 min, and cellular green fluorescence was measured using a flow cytometer. (F) Statistical results of DCF fluorescence intensity. (G‐K) HT22 cells were stained with H2DCFDA for 20 min, and cellular green fluorescence was detected under a fluoroscent microscope after treatment. Values were presented as mean±SE (n=6). ## P<.01 versus control, *P<.05 and **P<.01 versus Aβ25‐35 group
Figure 4.
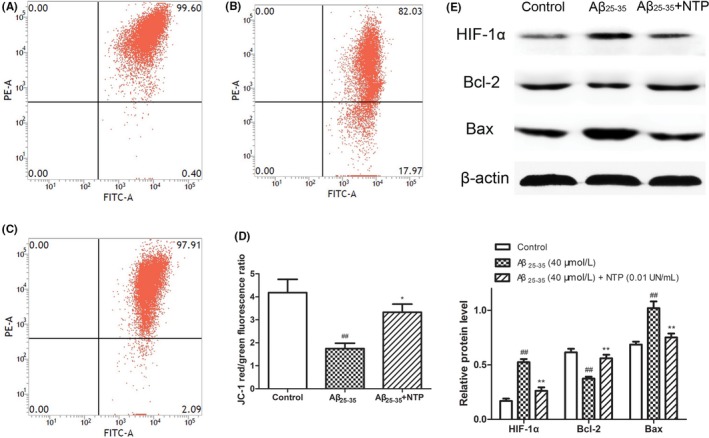
Neurotropin® (NTP) improved MMP and affected the expression of HIF‐1α and apoptosis‐related molecules in HT22 cells. (A) Control group. (B) HT22 cells were treated with 40 μmol/L Aβ25‐35 for 24 h. (C) HT22 cells were pretreated with 0.01 UN/mL NTP for 16 h and then coincubated with 40 μmol/L Aβ25‐35 for 24 h. Mitochondrial membrane potential (MMP, △Ψmt) was measured by JC‐1 staining. (F) Statistical results of JC‐1 red/green fluorescence ratio. (E) The protein expression of HIF‐1α, Bcl‐2, and Bax following treatment above. The results were shown as mean±SE from at least three independent experiments. ## P<.01 versus control, *P<.05 and **P<.01 versus Aβ25‐35 group
3.2. In vitro neurotropin® regulation of HIF‐1α and apoptosis‐related molecules
To further explore the mechanism of the neuroprotective capacity of NTP against Aβ25‐35 in HT22 cells, we then measured the protein expression of HIF‐1α, Bcl‐2, and Bax. As shown in Figure 4E, Western blot analysis revealed that NTP significantly enhanced the expression of Bcl‐2. In contrast to Bcl‐2 induction, NTP suppressed the expression of HIF‐1α and Bax (P<.01).
3.3. In vivo antioxidative effect by neurotropin®
Oxidative stress markers were assessed in the hippocampus of APP/PS1 mice treated with NTP. Compared with the control APP/PS1 mice group, the administration of NTP increased levels of superoxide dismutase (SOD), catalase (CAT), glutathione (GSH) (P<.01, P<.05, P<.05, respectively), and decreased Malondialdehyde (MDA) content in hippocampus of NTP‐treated APP/PS1 mice (P<.01; Figure 5), suggesting that NTP exhibited a capability of regulating the balance of antioxidant system.
Figure 5.
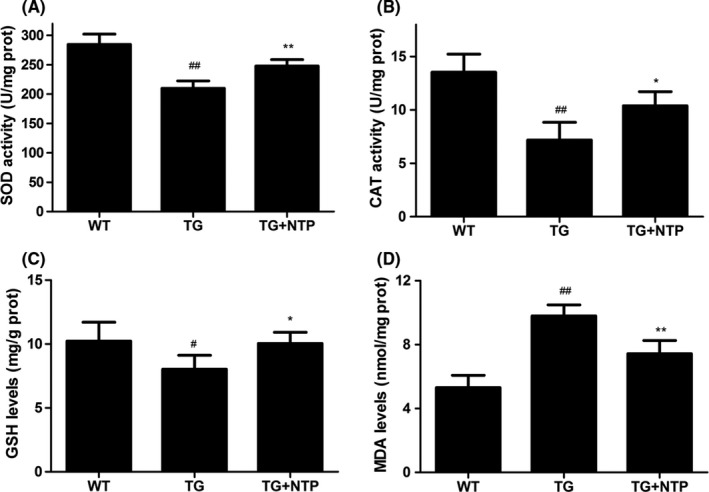
Neurotropin® (NTP) regulated the activity of antioxidants in hippocampus of APP/PS1 mice. NTP‐treated (TG+NTP), control (TG) APP/PS1 transgenic mice, and control wild‐type (WT) mice. Treated APP/PS1 mice received daily administration of NTP (200 NU/kg/d) for 3 months by oral gavage delivery. The control (TG) APP/PS1 transgenic mice and control wild‐type (WT) mice were treated with saline (0.9% NaCl). (A) Superoxide dismutase (SOD) activity. (B) Catalase (CAT) activity. (C) Glutathione (GSH) levels. (D) Malondialdehyde (MDA) levels. Data were presented as means±SE, n=6 hippocampus in each group. # P<.05 and ## P<.01versus WT mice, *P<.05 and **P<.01 versus TG mice
3.4. In vivo neurotropin® inhibition of aβ deposition in hippocampus
To investigate the potential effect of NTP treatment on Aβ deposition in hippocampus of APP/PS1 mice, the coronal sections of hippocampus of control wide‐type mice, control, and NTP‐treated APP/PS1 mice were determined using Bielschowsky silver staining, and hippocampal tissues were collected for the measurement of Aβ protein level. Quantification analysis showed that the surface area of Aβ plaque deposits decreased significantly in the NTP‐treated group compared to the APP/PS1 mice group (Figure 6A; P<.01). In accordance with this result, we observed a reduced level of Aβ1‐42 protein in hippocampus of NTP‐treated group (Figure 6C).
Figure 6.
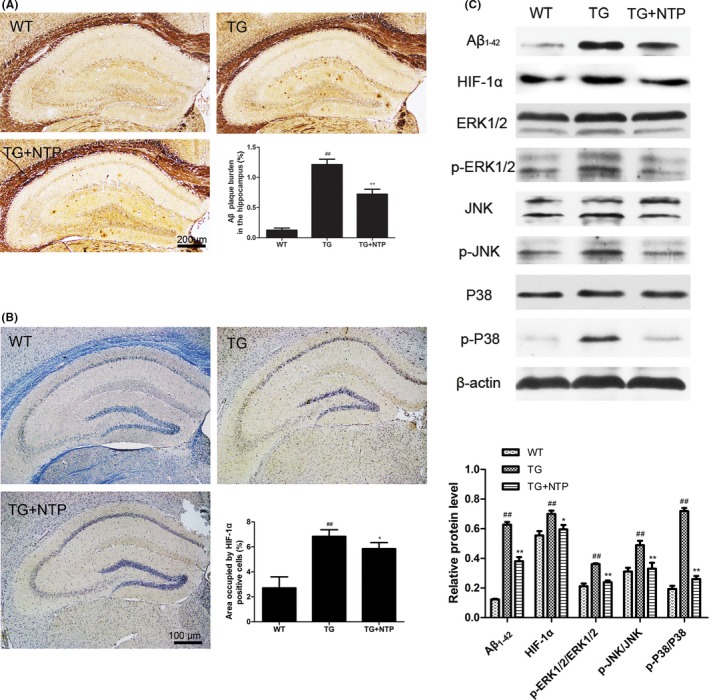
Neurotropin® (NTP) suppressed Aβ deposition and activation of HIF‐1α/MAPK pathway. (A) Aβ plaques were detected by Bielschowsky silver staining. (B) Quantification of HIF‐1α using immunohistochemistry. (C) Western blots and quantitative analysis for HIF‐1α, p‐ERK1/2, p‐JNK1/2, and p‐P38. The results presented as means±SE from at least three independent experiments. ## P<.01 versus WT mice, *P<.05 and **P<.01 versus TG mice
3.5. In vivo suppression of HIF‐1α and MAPK family activation by neurotropin®
To further investigate the underlying mechanisms of the neuroprotective effects of NTP, we first detected the expression of HIF‐1α in hippocampus by immunohistochemistry and Western blot. Results showed that HIF‐1α expression was inhibited in NTP‐treated mice (Figure 6B; P<.05). As shown in Figure 6C, we also examined the activation of mitogen‐activated protein kinase (MAPK) pathways using Western blot analysis. Compared to the wide‐type group, we found that the phosphorylation of ERK1/2, JNK, and P38 was promoted in APP/PS1 mice. However, NTP treatment markedly decreased the expression of p‐ERK1/2, p‐JNK, and p‐P38 (P<.01).
4. Discussion
Neurotropin® is an analgesic drug clinically applied for the treatment of several series of chronic pain. Recently, NTP had been reported to facilitate the improvement in spatial cognition of Ts65Dn mice and protect the brain from ischemic injuries, along with properties that improve spatial learning in C57BL/6J mice.6, 7 As NTP is a mixture of nonprotein molecules originating from inflamed rabbit tissue, it is supposed that it may contain antioxidative molecules for modulation of oxidative responses. Moreover, Hoshino et al. demonstrated that NTP enhanced lung thioredoxin (TRX) expression and reduced intracellular oxidative activity in lungs of mice.9 Therefore, we investigated the potential neuroprotective effects of NTP as a radical scavenger against neuronal damage in HT22 cells and APP/PS1 mice and explored the potential underlying mechanisms.
Central nervous system is particularly vulnerable to oxidative damage known as oxidative stress due to the relatively high oxygen consumption, metal cations, and lipid concentrations, but low levels of cellular antioxidants.20 Growing evidence indicated that in the process of aging and neurodegenerative diseases, abnormal antioxidant defense mechanisms increased oxidative damage to the brain.21 It is reported that ROS were capable to modify crucial molecules involved in neurodegenerative diseases.22
In healthy cells, ROS are byproducts of oxidative phosphorylation in the mitochondria's electron transport chain, and there are several endogenous antioxidant molecules existing for the modulation of oxidative balance, including SOD, CAT, and GSH. These antioxidants can coordinate to facilitate the dismutation of superoxide into oxygen and water to effectively mitigate ROS damage.23, 24, 25 However, when ROS levels break the protection of endogenous antioxidants or antioxidants are oxidized by ROS in persistence, homeostasis becomes hard to maintain, which can promote mitochondrial membrane permeability, activate cell death signals and other disorders in cells.26 In AD, one possible vehicle for Aβ plaque formation is ROS production, due to either mitochondrial dysfunction, age, or both.27 Reduced antioxidant activity is a hallmark of AD, and it is found that the activities of antioxidants were markedly reduced in AD brains, which could even result in the formation of Aβ plaques.28, 29
Accumulating evidence indicates that hypoxia inducible factor‐1α (HIF‐1α) is essential for cellular oxygen balance. Under physiological conditions, HIF‐1α levels are low but increase dramatically under hypoxia. It has been found that an upregulation of HIF‐1α enhanced expression of BACE1, while the HIF‐1α knock‐out mouse demonstrated a downregulation in BACE1 expression in hippocampus.30 Recently, another investigation reported that high glucose‐induced oxidative stress condition stimulated Aβ production in ZDF rats through HIF‐1α‐dependent direct expression of BACE1, indicating a close link between HIF‐1α and Aβ formation under oxidative conditions.31 However, whether NTP plays an important role in the regulation of HIF‐1α requires further investigation.
Our results from in vitro experimentation provided direct evidence of NTP protection against Aβ25‐35‐induced oxidative damage and cell death. ROS levels and HIF‐1α were significantly decreased in HT22 cells. Simultaneously, mitochondrial membrane potential was increased. In fact, mitochondrial function had been recognized as a pivotal role in AD pathogenesis. Mitochondria accumulate membrane damage could assist increased ROS production in cells and in an AD mouse model. Mitochondrial dysfunction was found to begin as early as 3 months.32 In particular, chen et al. demonstrated that mitochondrial injury induced by oxidative and nitrative stress could trigger the caspase cascades via the release of cytochrome c, leading to cell apoptosis in hippocampus.33, 34
The findings from in vivo study showed us that NTP exerted a protective effect on enhancing the activities of antioxidants and reducing the formation of Aβ deposition. For further study of the mechanism of NTP, we investigated the expression of HIF‐1α and stress‐related mitogen‐activated protein kinase (MAPK) signals. The MAPKs, a family of serine/threonine protein kinases, are key signaling pathways in modulation of cell growth, differentiation, and cell death.35 Aβ‐induced oxidative stress could alter these cellular signaling pathways and induce phosphorylation responses in cells. An upregulation of activation of JNK and P38 had been implicated in AD brains, and the MAPK signaling pathways could be activated in response to Aβ accumulation.36 Guo et al. observed that MAPKs signals could be activated by anisomycin and induce intracellular Aβ production in neuroblastoma cells.37 Therefore, the dysregulation of MAPK cascades further supports the pathological association between Aβ and oxidative stress in AD. In this present study, we found an increased activation of ERK1/2, JNK, and P38 in APP/PS1 mice. However, activation of the MAPKs was reduced in NTP‐treated APP/PS1 mice, indicating that the phosphorylation responses could be suppressed by NTP.
Taken together, our results demonstrated that Aβ25‐35 could induce hippocampal neuronal injury including the upregulation of ROS levels, the downregulation of mitochondrial membrane potential, and the promotion of cell apoptosis. In contrast, NTP treatment could reverse the damage mediated by Aβ25‐35 in HT22 cells. Furthermore, NTP could ameliorate the deposition of Aβ plaques in hippocampus of APP/PS1 mice and modify the activities of antioxidants. The neuroprotective capability of NTP is likely to be associated with the suppression of HIF‐1α and MAPK signaling pathways. In brief, NTP may act as a radical scavenger to be applied for the prevention and treatment of AD in the future. However, the optimal concentration of NTP is crucial for therapeutic use, and further investigation is warranted for the determination of appropriate dose.
Conflict of Interest
The authors declare no conflict of interest.
Acknowledgments
We are grateful for support from The National Nature Science Foundation of China (No. 81372919).
Fang W‐L, Zhao D‐Q, Wang F, et al. Neurotropin® alleviates hippocampal neuron damage through a HIF‐1α/MAPK pathway. CNS Neurosci Ther. 2017;23:428–437. 10.1111/cns.12689
The first two authors contributed equally to this work.
Contributor Information
Ping Luan, Email: pingluan01@163.com.
Jun Liu, Email: docliujun@hotmail.com.
References
- 1. Prince M, Comas‐herrera A, Knapp M, Guerchet M, Karagiannidou M. World Alzheimer report 2016: improving healthcare for people living with dementia: coverage, quality and costs now and in the future. Alzheimers Dis Int. 2016; Alzheimer’s Disease International (ADI), London. [Google Scholar]
- 2. Ono K, Ochi T, Yonenobu S, Ogawa N. Usefulness of Neurotropin tablets for low back pain and neck–shoulder–arm syndrome: a ketoprofen and placebo double blind controlled study. J Clin Report. 1987;21:837‐873. [Google Scholar]
- 3. Hanakago R, Sobue I, Ugawa N. Clinical evaluation of neurotropin in the treatment of sequelae of subacute myelo‐optico‐neuropathy a double‐blind cross‐over study. Pain. 1987;16:S278. [Google Scholar]
- 4. Nagaoka S, Nakamura M, Sekiguchi A. An open clinical trial of Neurotropin in patients with fibromyalgia. Rheumatology. 2004;32:104‐108. [Google Scholar]
- 5. Masuguchi K, Watanabe H, Kawashiri T, et al. Neurotropin relieves oxaliplatin‐induced neuropathy via Gi protein‐coupled receptors in the monoaminergic descending pain inhibitory system. Life Sci. 2014;98:49‐54. [DOI] [PubMed] [Google Scholar]
- 6. Fukuda Y, Berry TL, Nelson M, et al. Stimulated neuronal expression of brain‐derived neurotrophic factor by Neurotropin. Mol Cell Neurosci. 2010;45:226‐233. [DOI] [PubMed] [Google Scholar]
- 7. Nakajo Y, Yang D, Takahashi JC, Zhao Q, Kataoka H, Yanamoto H. ERV enhances spatial learning and prevents the development of infarcts, accompanied by upregulated BDNF in the cortex. Brain Res. 2015;1610:110‐123. [DOI] [PubMed] [Google Scholar]
- 8. Kimura H, Nakamura S, Okamoto K, Toyama I, Watanabe M, Ikeuchi K. A pilot study for clinical applications of Neurotropin to senile patients with dementia. Jpn Pharmacol Ther. 1987;15:407‐423. [Google Scholar]
- 9. Hoshino Y, Nakamura T, Sato A, Mishima M, Yodoi J, Nakamura H. Neurotropin demonstrates cytoprotective effects in lung cells through the induction of thioredoxin‐1. Am J Respir Cell Mol Biol 2007;37:438‐446. [DOI] [PubMed] [Google Scholar]
- 10. Harkany T, Abrahám I, Kónya C, et al. Mechanisms of beta‐amyloid neurotoxicity: perspectives of pharmacotherapy. Rev Neurosci. 2000;11:329‐382. [DOI] [PubMed] [Google Scholar]
- 11. Choi YY, Maeda T, Fujii H, et al. Oligonol improves memory and cognition under an amyloid β 25‐35 –induced Alzheimer's mouse model. Nutr Res. 2014;34:595. [DOI] [PubMed] [Google Scholar]
- 12. Limón ID, Díaz A, Mendieta L, et al. Amyloid‐beta(25‐35) impairs memory and increases NO in the temporal cortex of rats. Neurosci Res. 2009;63:129‐137. [DOI] [PubMed] [Google Scholar]
- 13. Fan S, Zhang B, Luan P, et al. PI3K/AKT/mTOR/p70S6K Pathway is involved in Aβ25‐35‐induced autophagy. Biomed Res Int. 2015;2015:1‐9. [DOI] [PMC free article] [PubMed] [Google Scholar]
- 14. Liu J, Li L, Suo WZ. HT22 hippocampal neuronal cell line possesses functional cholinergic properties. Life Sci. 2009;84:267‐271. [DOI] [PubMed] [Google Scholar]
- 15. Zhao ZY, Luan P, Huang SX, et al. Edaravone protects HT22 neurons from H2O2‐induced apoptosis by inhibiting the MAPK signaling pathway. CNS Neurosci Ther. 2013;19:163‐169. [DOI] [PMC free article] [PubMed] [Google Scholar]
- 16. Bao FX, Shi HY, Qi L, et al. Mitochondrial membrane potential‐dependent endoplasmic reticulum fragmentation is an important step in neuritic degeneration. CNS Neurosci Ther. 2016;22:648‐660. [DOI] [PMC free article] [PubMed] [Google Scholar]
- 17. Schwab C, Steele JC, McGeer PL. Dystrophic neurites are associated with the majority of early stage extracellular neurofibrillary tangles in parkinsonism dementia complex of Guam. Acta Neuropathol. 1997;94:486‐492. [DOI] [PubMed] [Google Scholar]
- 18. Schwab C, Hosokawa M, Mcgeer PL. Transgenic mice overexpressing amyloid beta protein are an incomplete model of alzheimer disease. Exp Neurol. 2004;188:52‐64. [DOI] [PubMed] [Google Scholar]
- 19. Liu J, Rasul I, Sun Y, et al. GRK5 deficiency leads to reduced hippocampal acetylcholine level via impaired presynaptic M2/M4 autoreceptor desensitization. J Biol Chem. 2009;284:19564‐19571. [DOI] [PMC free article] [PubMed] [Google Scholar]
- 20. Brown DR, Schmidt B, Kretzschmar HA. Effects of oxidative stress on prion protein expression in PC12 cells. Int J Dev Neurosci. 1997;15:961‐972. [DOI] [PubMed] [Google Scholar]
- 21. Buffenstein R, Edrey YH, Yang T, Mele J. The oxidative stress theory of aging: embattled or invincible? Insights from non‐traditional model organisms Age. 2008;30:99‐109. [DOI] [PMC free article] [PubMed] [Google Scholar]
- 22. Zuo L, Motherwell MS. The impact of reactive oxygen species and genetic mitochondrial mutations in Parkinson's disease. Gene. 2013;532:18‐23. [DOI] [PubMed] [Google Scholar]
- 23. Halliwell B. Oxidative stress and neurodegeneration: where are we now? J Neurochem. 2006;97:1634‐1658. [DOI] [PubMed] [Google Scholar]
- 24. Afonso V, Champy R, Mitrovic D, Collin P, Lomri A. Reactive oxygen species and superoxide dismutases: role in joint diseases. Joint Bone Spine. 2007;74:324‐329. [DOI] [PubMed] [Google Scholar]
- 25. Chelikani P, Fita I, Loewen PC. Diversity of structures and properties among catalases. Cell Mol Life Sci. 2004;61:192‐208. [DOI] [PMC free article] [PubMed] [Google Scholar]
- 26. Le BM, Clément MV, Pervaiz S, Brenner C. Reactive oxygen species and the mitochondrial signaling pathway of cell death. Histol Histopathol. 2005;20:205‐219. [DOI] [PubMed] [Google Scholar]
- 27. Mariani E, Polidori MC, Cherubini A, Mecocci P. Oxidative stress in brain aging, neurodegenerative and vascular diseases: an overview. J Chromatogr B Analyt Technol Biomed Life Sci. 2005;827:65‐75. [DOI] [PubMed] [Google Scholar]
- 28. Choi J, Rees HD, Weintraub ST, Levey AI, Chin LS, Li L. Oxidative modifications and aggregation of cu, zn‐superoxide dismutase associated with alzheimer and parkinson diseases. J Biol Chem. 2005;280:11648‐11655. [DOI] [PubMed] [Google Scholar]
- 29. Murakami K, Murata N, Noda Y, et al. SOD1 (copper/zinc superoxide dismutase) deficiency drives amyloid β protein oligomerization and memory loss in mouse model of Alzheimer disease. J Biol Chem. 2011;286:44557‐44568. [DOI] [PMC free article] [PubMed] [Google Scholar]
- 30. Zhang X, Zhou K, Wang R, et al. Hypoxia‐inducible factor 1alpha (HIF‐1alpha)‐mediated hypoxia increases BACE1 expression and beta‐amyloid generation. J Biol Chem. 2007;282:10873‐10880. [DOI] [PubMed] [Google Scholar]
- 31. Lee HJ, Ryu JM, Jung YH, et al. High glucose upregulates BACE1‐mediated Aβ production through ROS‐dependent HIF‐1α and LXRα/ABCA1‐regulated lipid raft reorganization in SK‐N‐MC cells. Sci Rep. 2016;6:36746. [DOI] [PMC free article] [PubMed] [Google Scholar]
- 32. Hauptmann S, Scherping I, Dröse S, et al. Mitochondrial dysfunction: an early event in Alzheimer pathology accumulates with age in AD transgenic mice. Neurobiol Aging. 2009;30:1574‐1586. [DOI] [PubMed] [Google Scholar]
- 33. Chen S, Zhen Y, Lin J, et al. Dynamin‐related protein 1 promotes mitochondrial fission and contributes to the hippocampal neuronal cell death following experimental status epilepticus. CNS Neurosci Ther. 2016;22:988‐999. [DOI] [PMC free article] [PubMed] [Google Scholar]
- 34. Chuang YC, Chen SD, Lin TK, et al. Upregulation of nitric oxide synthase II contributes to apoptotic cell death in the hippocampal CA3 subfield via a cytochrome c/caspase‐3 signaling cascade following induction of experimental temporal lobe status epilepticus in the rat. Neuropharmacology. 2007;52:1263‐1273. [DOI] [PubMed] [Google Scholar]
- 35. Pearson G, Robinson F, Beers GT, et al. Mitogen‐activated protein (MAP) kinase pathways: regulation and physiological functions. Endocr Rev. 2001;22:153‐183. [DOI] [PubMed] [Google Scholar]
- 36. Giraldo E, Lloret A, Fuchsberger T, Viña J. Aβ and tau toxicities in Alzheimer's are linked via oxidative stress‐induced p38 activation: protective role of vitamin E. Redox Biol. 2014;2:873‐877. [DOI] [PMC free article] [PubMed] [Google Scholar]
- 37. Guo X, Wu X, Ren L, Liu G, Li L. Epigenetic mechanisms of amyloid‐β production in anisomycin‐treated SH‐SY5Y cells. Neuroscience. 2011;194:272‐281. [DOI] [PubMed] [Google Scholar]