

Summary
Aim
Focal cortical dysplasia (FCD) represents a well‐known cause of medically intractable epilepsy. Studies found that transient receptor potential vanilloid receptor 4 (TRPV4) may participate in the occurrence of seizures. This study investigated the expression patterns of TRPV4 in FCD and the cascade that regulate functional state of TRPV4 in cortical neurons.
Methods
Thirty‐nine surgical specimens from FCD patients and 10 age‐matched control samples from autopsies were included in this study. Protein expression and distribution were detected by Western blot, immunohistochemistry, and immunofluorescence staining. Calcium imaging was used to detect the TRPV4‐mediated Ca2+ influx in cortical neurons.
Results
(1) The protein levels of TRPV4 and of an upstream factor, protein kinase C (PKC), were markedly elevated in FCD. (2) TRPV4 staining was stronger in the dysplastic cortices of FCD and mainly observed in neuronal microcolumns and malformed cells. (3) The activation of TRPV4 was central for [Ca2+]i elevation in cortical neurons, and this activity of TRPV4 in cortical neurons was regulated by the PKC, but not the PKA, pathway.
Conclusion
The overexpression and altered cellular distribution of TRPV4 in FCD suggest that TRPV4 may potentially contribute to the epileptogenesis of FCD.
Keywords: Calcium imaging, Focal cortical dysplasia, Protein kinase C, TRPV4
Introduction
Focal cortical dysplasia (FCD) is frequently associated with pharmacoresistant epilepsy 1. According to the classification system of the International League Against Epilepsy Task Force, isolated forms of FCD can be classified as FCD type I and FCD type II 2. A previous study suggests that cortical lesions in FCD are likely to be epileptogenic foci 3, 4, 5; however, the molecular mechanisms underlying the epileptogenesis and pathogenesis of FCD remain unclear.
The transient receptor potential (TRP) superfamily includes channels with a remarkable diversity of gating properties, selectivity, and specific activation mechanisms 6. One family member, TRPV4, is a capsaicin receptor that can be activated by a variety of stimuli, including warm temperatures, hypotonicity, and endogenous lipids 7. Previous studies have demonstrated that TRPV4 is widely expressed in the central nervous system 8, 9. Increasing evidence has shown that the TRPV4 has an important role in physiological and pathological processes, such as synaptic plasticity 10, 11. In addition, TRPV4 has been implicated in a variety of neurological disorders, including cerebral ischemia 12, neuropathic pain 13, 14, 15, and seizure 16.
Lipids downstream of arachidonic acid metabolism, which is an agonist of TRPV4, increase during seizure activity 10. More importantly, activation of TRPV4 may contribute to disrupt neural excitabilities 17. In addition, several reports have demonstrated that protein kinase C (PKC) and protein kinase A (PKA) are involved in the course of epilepsy 18, 19. Interestingly, TRPV4 can be directly phosphorylated by the PKC and PKA pathways 20. However, no reports have yet investigated the expression of TRPV4 in the cortical lesions of FCD; furthermore, the function of TRPV4 and the signaling pathways that regulate it in these cortical lesions remains unknown.
In this study, we determined the protein level of TRPV4 in resected FCD specimens and compared it with that of normal cortices (CTX). In addition, we detected the specific cellular distribution of TRPV4 in FCDs. Finally, we assessed the function of TRPV4 expression in cortical neurons and investigated the cascade that could regulate TRPV4‐mediated calcium influx.
Materials and Methods
Subjects
The specimens in this study were obtained from the Department of Neurosurgery at Xinqiao Hospital (Third Military Medical University, Chongqing, China). All procedures and experiments were conducted under the guidelines of the Ethics Committee of the Third Military Medical University. All brain tissues were obtained and used in a manner that is compliant with the Declaration of Helsinki. All cases were independently diagnosed by two neuropathologists and then classified following the current International League Against Epilepsy classification system. The clinical features of the patients with FCD are summarized in Table 1. The postoperative seizure outcome was assessed according to the criteria of Engel et al. 21. Detailed clinical data for each specimen of the patients with FCD are listed in Table 2. The mean length of the postoperative follow‐up was 3.6 years (range, 1–9 years).
Table 1.
Summary of focal cortical dysplasia patient clinical features
| FCDIa (n = 15) | FCDIIa (n = 12) | FCDIIb (n = 12) | |
|---|---|---|---|
| Male/Female | 8/7 | 7/5 | 6/6 |
| Age at surgery, mean (range), years | 12.7 (1.8–27.0) | 6.3 (1.5–12) | 4.9 (1.2–8.2) |
| Seizure type, % | PS (73) | PS (67) | PS (67) |
| GTCS (47) | GTCS (50) | GTCS (42) | |
| Tonic (33) | Tonic (25) | Tonic (25) | |
| IS (20) | IS (17) | IS (25) | |
| Cortical lesion location | Frontal:5 | Frontal:5 | Frontal:6 |
| Temporal:9 | Temporal:5 | Temporal:5 | |
| Parietal:2 | Parietal:3 | Parietal:5 | |
| Occipital:3 | Occipital:2 | Occipital:2 | |
| Duration of epilepsy, mean (range), years | 8.6 (1–20.5) | 4.2 (1.0–8.0) | 3.1 (1.0–6.0) |
| Seizure frequency, mean (range), per month | 33.2 (5–85) | 52.9 (8–189) | 61.1 (19–141) |
| Postoperative outcome: Engel class, % | I: 27 | I: 33 | I: 50 |
| II: 33 | II: 42 | II: 33 | |
| III: 20 | III: 8 | III: 9 | |
| IV: 20 | IV: 9 | IV: 8 |
FCD, focal cortical dysplasia; GTCS, generalized tonic–clonic seizure; IS, infantile spasm; PS, partial seizure.
Table 2.
Clinical and neuropathological characteristics of patients with FCDs
| Sex | Pathology | Age at surgery (yr) | Seizure type | Brain region | Epilepsy duration (yr) | Seizure frequency (/mon) | PO | Application in the current study | |
|---|---|---|---|---|---|---|---|---|---|
| 1 | F | FCDIa | 25 | PS; GTCS; | T;O | 20.5 | 85 | II | WB; IHC; |
| 2 | F | FCDIa | 9 | GTCS; Tonic | T; | 5 | 32 | I | WB; IHC; |
| 3 | M | FCDIa | 16.8 | PS; | F | 10 | 65 | II | WB; IHC |
| 4 | M | FCDIa | 12 | PS;IS | T | 5 | 9 | III | WB; IHC |
| 5 | M | FCDIa | 7.5 | PS | O | 5.5 | 34 | IV | WB; IHC |
| 6 | F | FCDIa | 1.8 | PS | F | 1 | 32 | II | IHC |
| 7 | M | FCDIa | 11.5 | PS; Tonic | F; O | 7 | 24 | I | WB; IHC |
| 8 | M | FCDIa | 15 | PS; GTCS | P; T | 10 | 21 | III | WB; IHC |
| 9 | M | FCDIa | 14 | PS | T | 9.5 | 15 | IV | IHC |
| 10 | F | FCDIa | 10 | GTCS; Tonic | T | 6.2 | 75 | I | WB; IHC |
| 11 | M | FCDIa | 27 | GTCS;Tonic;PS | F | 19 | 5 | II | WB; IHC |
| 12 | F | FCDIa | 4.6 | IS | T | 3 | 56 | I | WB;IHC |
| 13 | M | FCDIa | 2 | PS; GTCS | T;P | 1.8 | 21 | IV | WB; IHC |
| 14 | F | FCDIa | 12 | PS | T | 7 | 11 | II | IHC |
| 15 | F | FCDIa | 23 | GTCS;Tonic; IS | F | 18 | 13 | III | WB; IHC |
| 16 | M | FCDIIa | 2.5 | PS; GTCS;Tonic | P | 1.5 | 43 | II | WB; IHC |
| 17 | M | FCDIIa | 1.5 | PS | T | 1 | 37 | II | IHC |
| 18 | F | FCDIIa | 4 | GTCS;PS | F | 2.5 | 22 | I | WB; IHC |
| 19 | M | FCDIIa | 9 | PS | P | 5 | 97 | IV | WB;IHC |
| 20 | M | FCDIIa | 5.5 | PS;GTCS; | F;T | 3.5 | 23 | I | WB; IHC |
| 21 | F | FCDIIa | 7.5 | GTCS | F | 4 | 23 | II | WB; IHC |
| 22 | M | FCDIIa | 3 | PS; Tonic | F;O | 2 | 117 | I | IHC |
| 23 | F | FCDIIa | 4.5 | IS | P | 3 | 32 | II | WB; IHC |
| 24 | F | FCDIIa | 7 | PS; Tonic | T | 6.5 | 8 | III | WB; IHC |
| 25 | M | FCDIIa | 10.5 | GTCS | F;O | 7 | 32 | III | WB; IHC |
| 26 | M | FCDIIa | 8 | PS; GTCS | T | 6 | 189 | I | WB;IHC |
| 27 | F | FCDIIa | 12 | IS | T | 8 | 12 | II | WB; IHC |
| 28 | M | FCDIIb | 2 | PS; Tonic | F | 1 | 72 | II | WB; IHC |
| 29 | F | FCDIIb | 1.2 | IS | P | 1 | 23 | IV | WB;IHC |
| 30 | F | FCDIIb | 1.5 | IS | F;T | 1 | 141 | I | IHC; |
| 31 | M | FCDIIb | 2.5 | PS;GTCS | F;O | 1 | 27 | II | WB;IHC; |
| 32 | F | FCDIIb | 4.5 | GTCS;IS | T | 2 | 132 | I | WB; IHC; |
| 33 | M | FCDIIb | 5.5 | PS;GTCS | F;T | 4 | 35 | III | IHC |
| 34 | F | FCDIIb | 5 | PS; Tonic | F; P | 3 | 50 | I | WB;IHC |
| 35 | F | FCDIIb | 6 | GTCS | T | 3.5 | 75 | I | WB; IHC |
| 36 | M | FCDIIb | 7.2 | PS; Tonic | P | 5 | 19 | II | WB; IHC |
| 37 | M | FCDIIb | 8 | PS; | F;T | 5 | 45 | II | WB;IHC; |
| 38 | M | FCDIIb | 7.5 | PS | P;O | 4.5 | 47 | I | WB; IHC |
| 39 | F | FCDIIb | 8.2 | PS; GTCS | P | 6 | 67 | I | WB; IHC; |
FCD, focal cortical dysplasia; M, male; F, female; PO, postoperative outcome (Engel's class); PS, partial seizure; GTCS, generalized tonic–clonic seizure; IS, infantile spasm; F, frontal; P, parietal; O, occipital; T, temporal; WB, Western blot; IHC, immunohistochemistry (including immunofluorescence).
Control CTX tissues were obtained from the autopsies of 10 patients who did not have a history of seizures or of any other neurological diseases. All autopsies were performed within six hours of death to obtain high‐quality CTX samples. Two neuropathologists also reviewed the control cases, thereby confirming that no abnormalities existed grossly or microscopically. The clinical data and applications of the normal control tissue from patient are summarized in Table 3.
Table 3.
Clinical and Neuropathologic Features of Autopsy Control Patient Samples
| Case No. | Sex | Neuropathologic diagnosis | Age, years | Cause of death | PMI (h) | Cortical region sampled | Application in the study |
|---|---|---|---|---|---|---|---|
| 1 | M | Normal | 2.9 | Non‐neurological disease | 1.0 | Frontal | WB, IHC |
| 2 | M | Normal | 4.5 | Electric shock | 4.5 | Temporal; Occipital; | WB, IHC |
| 3 | F | Normal | 3.6 | Non‐neurological disease | 5.6 | Frontal; Temporal | WB, IHC |
| 4 | F | Normal | 3.7 | Motor vehicle accident | 2.5 | Occipital; Temporal | WB, IHC |
| 5 | M | Normal | 8.2 | Motor vehicle accident | 2.1 | Temporal; Parietal; Occipital | WB, IHC |
| 6 | F | Normal | 3.5 | Choking/Suffocation | 1.2 | Parietal | WB, IHC |
| 7 | M | Normal | 3.7 | Drowning | 1.5 | Frontal; Parietal | WB, IHC |
| 8 | M | Normal | 5.3 | Drowning | 0.5 | Temporal; Parietal | WB, IHC |
| 9 | F | Normal | 5.8 | Drowning | 1.5 | Frontal; Parietal | WB, IHC |
| 10 | F | Normal | 8.4 | Motor vehicle accident | 2.0 | Temporal; Parietal | WB, IHC |
F, female; M, male; IHC, immunohistochemistry (including immunofluorescence); PMI, postmortem interval, that is, interval between death of a patient and removal of the brain before freezing or fixation; WB, Western Blot; h, hour.
Tissue Preparation
All the tissues were immediately divided into two parts. One part was fixed in 10% buffered formalin and embedded in paraffin. The paraffin‐embedded tissue was sectioned at 6 μm for hematoxylin/eosin (H&E) staining and immunohistochemistry (IHC). The remaining part was snap‐frozen in liquid nitrogen and maintained at −80°C until they were analyzed by Western blotting.
Western Blotting
Western blotting analyses were conducted in homogenates from FCD and CTX samples. The frozen samples were lysed in RIPA buffer supplemented with 10% protease inhibitor cocktail (Sigma, St Louis, MO, USA). Protein concentration was estimated using the Bradford method (Bio‐Rad, Hercules, CA, USA). Equal amounts of protein (50 μg/lane) were separated using 8% sodium dodecyl sulfate‐polyacrylamide (SDS) gel electrophoresis and were then transferred onto polyvinylidene fluoride membranes (Millipore, Billerica, MA, USA) using a wet electroblotting system (Bio‐Rad). Then, the membranes were blocked in 5% nonfat dry milk for 2 h and incubated overnight at 4°C with one of the following primary antibodies: TRPV4 (rabbit polyclonal, 1:800; Alomone, Jerusalem, Israel), PKC (mouse monoclonal, 1:800; Boster, China), PKA (rabbit polyclonal, 1:1000; Proteintech, Wuhan, China), and GAPDH (rabbit monoclonal, 1:1000; Cell Signaling, Beverly, MA, USA). After washing and treating with horseradish peroxidase‐conjugated anti‐rabbit or anti‐mouse secondary antibody (1:1000; Zhongshan Goldenbridge Biotechnology, Beijing, China) for 1 h at room temperature, levels of glyceraldehyde 3 phosphate dehydrogenase (GAPDH) were evaluated as a loading control.
Immunohistochemistry
Single‐label IHC was performed using the avidin–biotin–peroxidase staining method. Briefly, the sections were incubated with the following antibodies: TRPV4 (1:50), PKC (1:100), or PKA (1:100) overnight at 4°C. The immunoreactions were visualized by using a SABC peroxidase system (Boster) with 3,3′‐diaminobenzidine tetrahydrochloride hydrate (DAB) (Boster) as the chromogen. Sections were then counterstained with hematoxylin, dehydrated, and coverslipped. No immunoreactive cells were detected in the negative control experiments, which included the use of secondary antibody alone, pre‐absorption with a 10‐fold excess of specific blocking antigen, or incubation with an isotype‐matched rabbit or mouse polyclonal antibody.
For the double immunofluorescence staining, sections were incubated overnight at 4°C with TRPV4 antibody combined with antibody against glial fibrillary acidic protein ([GFAP] mouse monoclonal, 1:500; Sigma), NF200 (mouse monoclonal, 1:100; Boster), NeuN (mouse monoclonal, 1:100; Millipore), glutamate (mouse monoclonal, 1:1500; Sigma), GABA (mouse monoclonal, 1:500; Sigma), or GAD67 (mouse monoclonal, 1:500; Sigma). After rinsing, the sections were incubated with a mixture of FITC (fluorescein isothiocyanate)‐conjugated goat anti‐rabbit IgG (1:300; Zhongshan Goldenbridge Biotechnology Co.) and Alexa Fluor 594 goat anti‐mouse IgG (1:500; Invitrogen, Carlsbad, CA, USA) for 1 h at 37°C. Then, 4′, 6‐diamidino‐2‐phenylindole ([DAPI], Beyotime, Nanjing, China) was used to counterstain the cell nuclei. Images of the fluorescent sections were acquired with a confocal laser‐scanning microscope (TCS‐TIV; Leica, Nussloch, Germany).
Evaluation of Immunostaining and Cell Counting
Two independent observers evaluated the specific immunostaining and performed cell counting. The overall concordance was >90%. All labeled tissue sections were examined as previously reported in a total microscopic area of 781.250 μm2 (200 high‐power nonoverlapping fields of 0.0625 × 0.0625‐mm width with a square grid inserted into the eyepiece) 22. The staining intensity of TRPV4 was evaluated using a semiquantitative, three‐point scale where the IR was defined as follows: 0, absent (−); 1, weak (+); 2, moderate (++); or 3, strong (+++) staining. These intensity scores represent the predominant staining intensity in each section and were calculated as an average of the selected fields. Next, we calculated the labeling index (LI) of TRPV4, PKC, and PKA positive cells in the FCD tissue like previously reported 23. The LI was defined as the ratio of immunolabeled malformed cells relative to the entire cell population of interest.
Primary Cortical Neuron Culture
Primary cortical neurons were obtained from 1 day postnatal Sprague Dawley rats. According to the previous reference 24, cells were suspended in Neurobasal medium (Invitrogen) containing 2% B27 (Invitrogen) and 1% glutamine (Invitrogen). Neurons grown in poly‐L‐lysine precoated 35‐mm dishes at a density of 1 × 10⁵ cells/mL at 37°C in humidified atmosphere containing 5% CO2. To prevent the replication of non‐neuronal cells, half of the medium was replaced with fresh medium containing 4 μM arabinoside cytosine (Sigma) every 48–72 h. The cultured cortical neurons were used in experiments after 6–8 days in vitro.
Calcium Imaging
The intracellular calcium concentration was monitored by Fluo‐3/AM (5 mM, Beyotime). Briefly, neurons were loaded with 4 μM Fluo‐3/AM at 37°C for 30 min. After washing, the cortical neurons were incubated at 37°C for another 30 min to complete the deesterification of Fluo‐3/AM. The intensity of fluorescence was recorded every 3 s for approximately 20 min by laser‐scanning confocal microscope (TCS‐TIV; Leica Microsystems, Nussloch, Germany) using an excitation wavelength at 485 nm and an emission wavelength at 525 nm. The intracellular free Ca2+ concentration under resting conditions was recorded for about 3 min to determine the basal level. Next, 4α‐phorbol 12, 13‐didecanoate (4αPDD; Sigma) was applied. An activator or an inhibitor of the PKA and PKC cascade was administered 10 min before each observation. The changes in intracellular Ca2+ concentration, monitored as fluo‐3 AM fluorescence, were expressed relative to the basal level (fluo‐3 AM F/F0) as a percentage. The results are presented as the mean ± SEM from five independent experiments.
Data Analysis and Statistics
The data are expressed as the mean ± SEM. SPSS for Windows (SPSS, Inc., Chicago, IL, USA) was used for the statistical analysis. The differences between groups were analyzed using a one‐way analysis of variance (ANOVA); P < 0.05 was considered to be significant.
Results
Neuropathology
Normal‐appearing cortical samples exhibited organized layers with a unipolar orientation of apical dendrites toward the pial surface, well‐preserved laminations, and normal definition of the gray–white matter junction. All FCD cases included in this study were not associated with primary lesions (i.e., hippocampal sclerosis or a tumor) and fulfilled the histopathological criteria of FCDIa, FCDIIa, and FCDIIb 2. The FCDIa cases displayed abundant microcolumns and cortical dyslamination. The FCDIIa cases displayed cortical delamination and disorientated dysmorphic neurons (DNs) that had enlarged cell bodies and nuclei. These DNs were distributed throughout the cortex or white matter. The FCDIIb cases displayed all the previously noted features of FCDIIa. In addition, balloon cells (BCs) with large cell bodies, eccentric nuclei, and opalescent glassy eosinophilic cytoplasm were observed by H&E staining (see Figure S1).
Western Blotting and Immunohistochemistry Analysis of TRPV4
Western blot analysis showed that the TRPV4 protein expression was significantly increased in the cortical specimens of patients with FCD. Moreover, the protein level of TRPV4 was significantly higher in the FCDII samples compared to that of the FCDI samples, but no significant difference was observed between the FCDIIa and FCDIIb samples (Figure 1).
Figure 1.
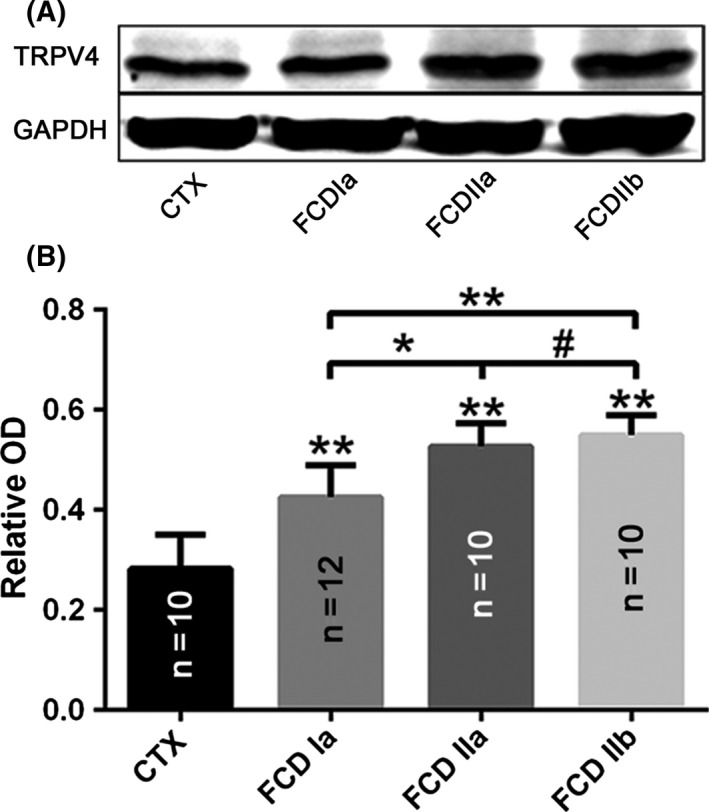
Alteration in TRPV4 expression in focal cortical dysplasia (FCD).(A, B) Representative immunoblot bands (A) and densitometricanalyses (B) of total homogenates from FCD types Ia(FCDIa), IIa (FCDIIa) and IIb (FCDIIb) lesions and normal control cortex (CTX) tissue samples. *P < 0.05, **P < 0.01, # P > 0.05, ANOVA. OD = optical densities. Number of samples is indicated in columns for each condition.
In the control specimens, weak‐to‐moderate TRPV4 immunoreactivity (IR) was observed in neurons and glial cells throughout all of the cortical layers (Figure 2A–C), and weak staining was detected in vascular endothelial cells (Figure 2C).
Figure 2.
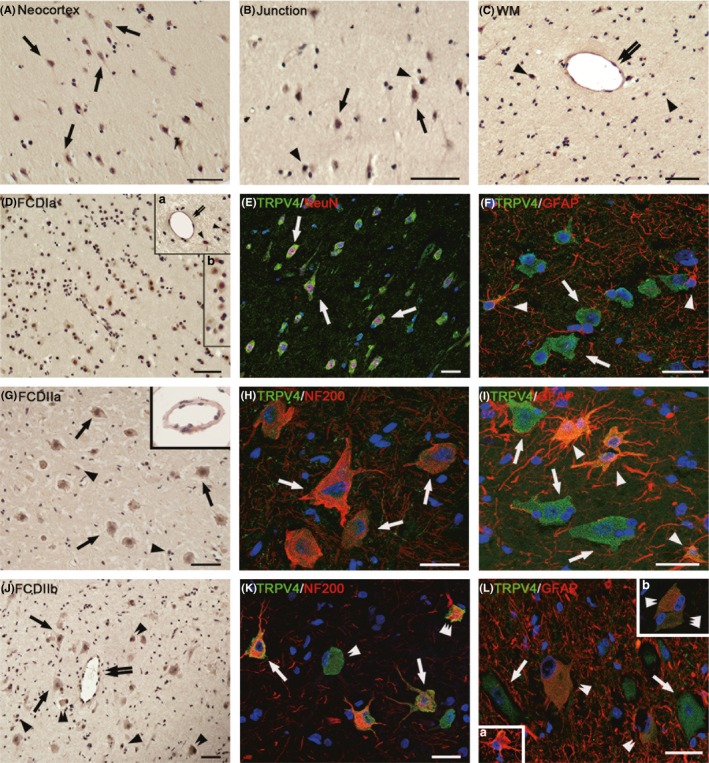
Immunoreactivity (IR) of TRPV4 in focal cortical dysplasia (FCD) types Ia (FCDIa), IIa (FCDIIa), and IIb(FCDIIb). (A–C) TRPV4 IR in normal control cortex (CTX). Weak‐to‐moderate TRPV4 in neurons (arrows in [A] and [B]), glial cells (arrowheads in [B] and [C]) and weak TRPV4 in endothelial cells (double arrows in [C]) in neocortex, white matter(WM), and junction. (D–F) TRPV4 IR in FCDIa. Moderate‐to‐strong TRPV4 in neurons, including in microcolumns ([D], inset b in [D]) and in endothelial cells (double arrows in inset a in [D]), and moderate TRPV4 IR in glial cells (arrowheads in insert a in [D]). (E, F) Merged images show the colocalization of TRPV4 (green) with NeuN (red) in neurons (arrows in [E]) and the colocalization of TRPV4 (green) with glial fibrillary acidic protein ([GFAP] red) in glial cells (arrowheads) but not in neurons (arrows in [F]). (G–I) TRPV4 IR in FCDIIa. Moderate‐to‐strong TRPV4 IR in dysmorphic neurons(DNs) (arrows in [G]) and in endothelial cells ([G] inset); strong TRPV4 IR in glial cells (arrowheads in [G]). The merged images show the colocalization of TRPV4 (green) with NF200 (red) in DNs(arrows in H). (I) TRPV4 (green) colocalized with GFAP(red) in glial cells (arrowheads in [I]) but not in DNs (arrows in [I]). (J‐L) TRPV4 IR in FCDIIb. Moderate‐to‐strong TRPV4 IR in endothelial cells (double arrows in [J]), DNs (arrows in [J]), and ballon cells ([BCs], double arrowheads in [J]) with different sizes and shape. There is strong TRPV4 IR in glial cells (arrowheads in [J] and [R]). (K) Confocal image indicated that TRPV4‐positive DNs (arrows) and BCs (triple arrowheads) colocalize with NF200 (red); other BCs (double arrowheads) do not colocalize with NF200 (red). (L) Merged image shows that TRPV4‐positive glial cells (inset a in [L], green) and TRPV4‐positive BCs (double arrowheads in [L] and inset b, green) colocalize with GFAP (red); other BCs (triple arrowheads, inset b in [L]) do not colocalize with GFAP. Sections are counterstained with hematoxylin (A–D, G, J) or DAPI ([E], [F], [H], [I], [K], [L], inset in [L]). Scale bars = (A–D, G, J) 50 μm; (E, F, H, I, K, L) 30 μm.
In the FCDIa specimens, we observed moderate‐to‐strong staining for TRPV4 in the neurons of the microcolumns (Figure 2D, inset b). In addition, moderate IR was detected in the glial cells (Figure 2D, inset a). Additionally, there was moderate‐to‐strong staining in vascular endothelial cells (Figure 2D, inset a). The intensity scores indicated higher expression of TRPV4 in the FCDIa than in the CTX (Table 4). Double‐labeling experiments confirmed the co‐localization of TRPV4 immunostaining with the neuronal marker NeuN in microcolumn and glial marker GFAP in astrocyte (Figure 2E,F).
Table 4.
Staining Scores of TRPV4‐, PKC‐, PKA‐Immunopositive Cells in FCD and Control Specimens
| CTX (n = 10) | FCDIa (n = 15) | FCDIIa (n = 12) | FCDIIb (n = 12) | |
|---|---|---|---|---|
| TRPV4 | 1.15 ± 0.18 | 1.90 ± 0.14* | 2.45 ± 0.25* | 2.65 ± 0.33* |
| PKC | 1.07 ± 0.12 | 1.36 ± 0.27* | 2.21 ± 0.18* | 2.57 ± 0.22* |
| PKA | 1.51 ± 0.31 | 1.55 ± 0.37# | 1.52 ± 0.29# | 1.54 ± 0.24# |
CTX, normal control cerebral cortex; FCD, focal cortical dysplasia; TRPV4, transient receptor potential vanilloid 4; PKC, protein kinase C; PKA, protein kinase A.
Data are expressed as mean ± SEM where immunoreactivity was scored as: 0, absent; 1, weak; 2, moderate; or 3, strong.
*P < 0.01, # P > 0.05, FCDIa, FCDIIa, FCDIIb versus CTX, ANOVA.
In the FCDIIa specimens, there was moderate‐to‐strong TRPV4 IR in 72 ± 2.9% of the DNs (n = 766) (Figure 2G). We also observed strong staining in glial cells (Figure 2G). In addition, there was moderate‐to‐strong TRPV4 IR in vascular endothelial cells (Figure 2G, inset). The intensity scores indicated the significant upregulation of TRPV4 expression in FCDIIa compared to that of the CTX (Table 4). Double‐labeling experiments indicated that TRPV4 were colocalized with another neuronal marker NF200, which stains neuron specific neurofilaments, in DNs (Figure 2H). TRPV4 and GFAP were co‐localized in most glial cells in the FCDIIa specimens (Figure 2I).
In the FCDIIb cases, there was moderate‐to‐strong TRPV4 IR in 68 ± 3.1% of the DNs (n = 728) and in 63 ± 4.8% of the BCs (n = 459) (Figure 2J). Additionally, there was strong TRPV4 IR in the glial cells (Figure 2J). Endothelial cells in FCDIIb specimens also expressed high levels of TRPV4 (Figure 2J). The intensity scores of TRPV4 IR in the FCDIIb specimens were significantly higher than those in the CTX samples (Table 4). Double‐labeling experiments confirmed that NF200‐positive DNs and BCs both expressed TRPV4 (Figure 2K). Moreover, TRPV4 was also expressed in GFAP‐positive BCs (Figure 2L).
Our double‐labeling experiments also confirmed the co‐localization of TRPV4 immunostaining with glutamate in microcolumns and malformed cells (see Figure S2A–C). However, TRPV4 was also co‐expressed with GABA and GAD67 in FCDIa and FCD type II (see Figure S2D–I).
PKC and PKA Expression
Western blot analysis revealed that PKC expression was significantly increased in the FCD specimens compared with that of CTX tissues. The PKC protein level was higher in the FCDII specimens compared with FCDI samples; however, no significant differences were detected between FCDIIa and FCDIIb (Figure 3). With immunohistochemistry analysis, weak‐to‐moderate PKC IR was detected in neurons and glial cells in the CTX samples (Figure 4A). In the FCDIa, there was moderate staining of PKC in the neurons, including in the microcolumns and glial cells (Figure 4B). In the FCDIIa, moderate‐to‐strong staining of PKC IR was detected in 78 ± 7.5% of the DNs (n = 813) and glial cells (Figure 4C). In the FCDIIb, there was strong PKC IR in 83 ± 3.1% of the DNs (n = 762), 76 ± 2.7% of the BCs (n = 488), and glial cells (Figure 4D). The intensity scores of PKC IR in the FCD samples were significantly higher than those in the CTX samples (Table 4).
Figure 3.
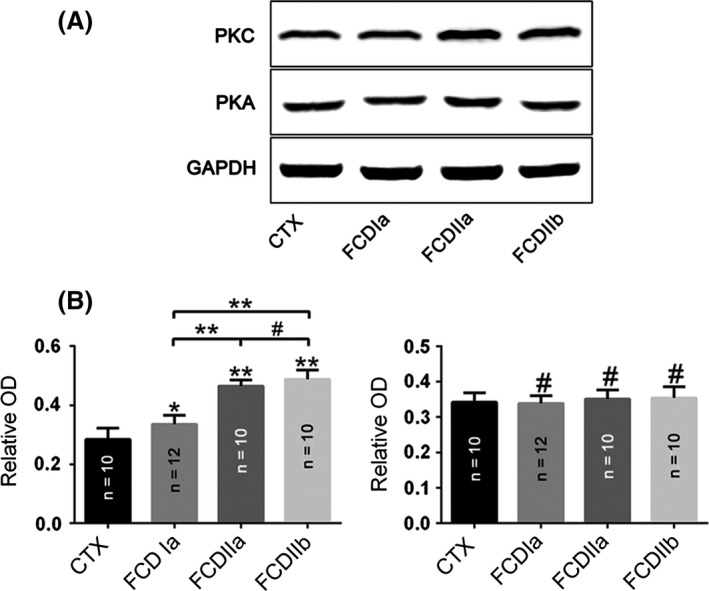
Changes in protein kinase C (PKC) and protein kinase A (PKA) expression in focal cortical dysplasia (FCD) and control cortex (CTX). (A) Representative immunoblot bands and (B) densitometric analyses of total homogenates from FCD (FCDIa, FCDIIa, and FCDIIb) lesions and CTX tissue samples. *P < 0.05, **P < 0.01, # P > 0.05, ANOVA. OD = optical densities. Number of samples is indicated in columns for each condition.
Figure 4.
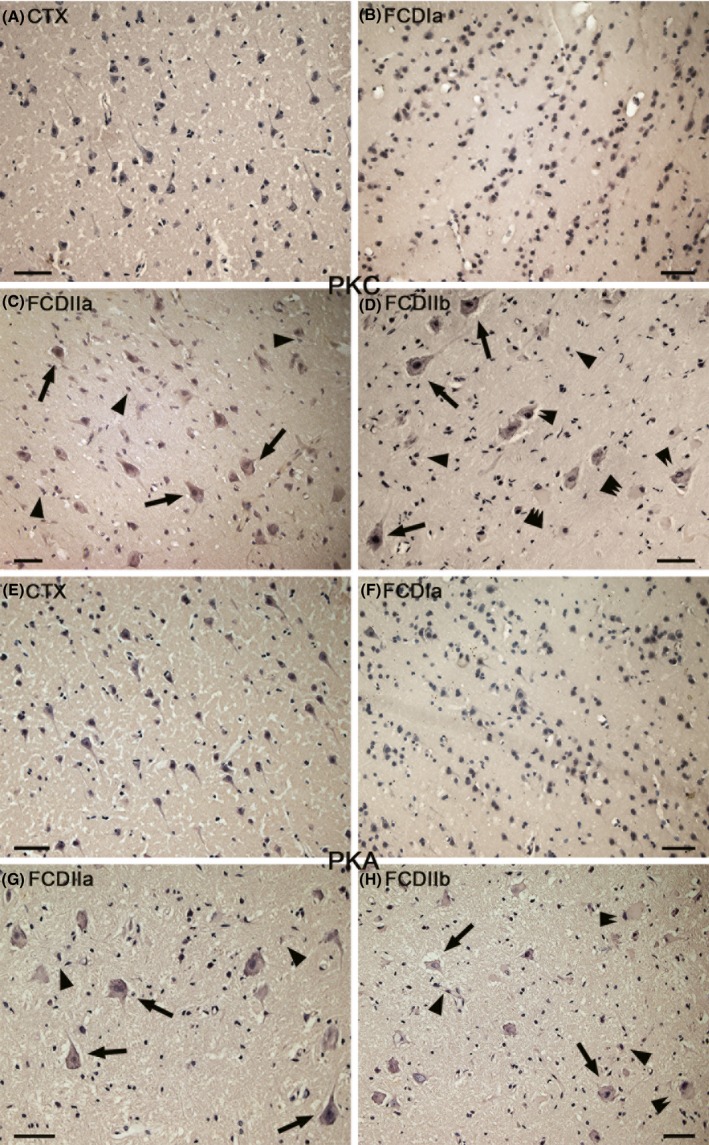
Immunoreactivity (IR) of protein kinase C (PKC) and protein kinase A (PKA) in focal cortical dysplasia (FCD) and control cortex (CTX). (A) PKC in CTX. There is weak‐to‐moderate PKC IR in neurons and glial cells. (B) PKC in FCDIa. There is moderate PKC IR in some neurons, including in microcolumns and some glial cells. (C) PKC in FCDIIa. Moderate‐to‐strong PKC IR in dysmorphic neurons (DNs) (arrows), glial cells (arrowheads). (D) PKC in FCDIIb. Strong PKC IR in DNs (arrows), balloon cells(BCs) (double arrows), and glial cells(arrowheads). Weak PKC IR BCs are indicated by triple arrowheads (E) PKA in CTX. Moderate‐to‐strong PKA IR in some neurons and glial cells. (F) PKA in FCDIa. There is moderate‐to‐strong PKA IR in some neurons, including in microcolumns, and some glial cells. (G) PKA in FCDIIa. There is moderate‐to‐strong PKA IR in DNs (arrows) and glial cells. (H) PKA IR in FCDIIb. Moderate‐to‐strong PKA IR in DNs (arrows), BCs (double arrows), and glial cells (arrowheads). Scale bars: 50 μm.
However, there was no significant difference between the expression of PKA protein in CTX and FCD (Figure 3). Immunohistochemistry analysis revealed that there was moderate‐to‐strong PKA IR in neurons and glial cells in the CTX and in the FCD lesions (Figure 4E–H). In FCDIIa, PKA expression was detected in 86 ± 5.3% of the DNs (n = 747). We also detected strong PKA staining in 73 ± 3.1% of the DNs (n = 753) and 59 ± 4.7% of the BCs (n = 427) in FCDIIb specimens. The intensity scores displayed similar results (Table 4).
Functional Assessment of TRPV4 Expression
To provide a functional assessment of TRPV4 in the cortex, rat‐derived cortical neurons were used in a calcium imaging system (Figure 5A–F). We took advantage of the TRPV4 agonist, 4αPDD, to demonstrate the specific activation of TRPV4. In cortical neurons, Ca2+ influx was stimulated by 4αPDD in a dose‐dependent manner (Figure 5G). The relationship between 4αPDD and Ca2+ influx could be calculated by using a sigmoidal dose–response function, which yielded an EC50 of 9.92 μM for 4αPDD. 4αPDD at 30 μM displayed a near maximal stimulation; therefore, we elected to use this concentration to activate TRPV4 channels in subsequent experiments.
Figure 5.
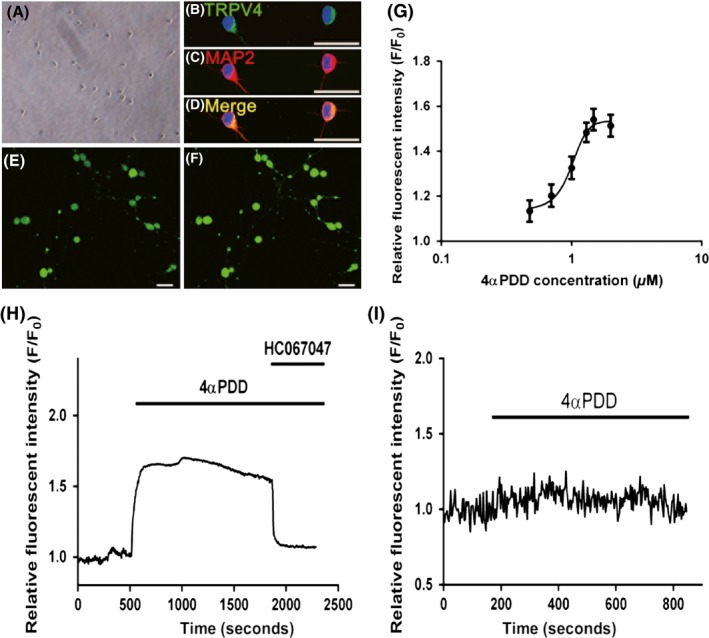
Function assessment of TRPV4 expression in primary cortical neurons. (A) Representative phase contrast images show cultured rat cortical neurons. (B–D) Merged images show the colocalization of TRPV4 (green) with MAP2 (red) in cultured cortical neurons. The nuclei are stained with 4′, 6‐diamidino‐2‐phenylindole (DAPI) and are shown in blue. (E–F) Confocal images show primary cultured cortical neurons labeled with Fluo‐3 before ([E]) and after ([F]) 4α PDD treatment. (G) Dose–response curve indicated that dose‐dependent activation of Ca2 + influx under 4α PDD stimulation. Cultured cortical neurons were stimulated with 4α PDD at 3, 5, 10, 20, 30, and 100 μM. The dose–response curve was fitted by a sigmoidal dose–response function using GraphPad Prism 6.0. (H) Representative example showing the effect of TRPV4 agonist and antagonist, 4α PDD and HC067047, on [Ca2+]i in cultured cortical neurons. (I) Representative example showing removal of extracellular Ca2+ abolishing the 4α PDD response. The changes of intracellular calcium concentration in all experiments measured as fluo‐3 AM fluorescence were expressed relative to the basal level (F/F0). Scale bars: 30 μm.
As shown in Figure 6H, the 30 μM 4αPDD‐induced increase in intracellular Ca2+ was almost abolished immediately upon treatment with HC067047, which is a highly selective antagonist of TRPV4. This result further confirmed that the increase in intracellular Ca2+ in our study occurred in a TRPV4‐dependent manner. Finally, to provide further insight into the actions of TRPV4, we added 4αPDD when extracellular Ca2+ was removed. Indeed, in the absence of extracellular Ca2+, the 4αPDD addition did not result in an increase in intracellular Ca2+, which demonstrated that 4αPDD addition leads to the activation of calcium influx rather than facilitating its release from intracellular calcium stores (Figure 5I). Overall, these results demonstrated that TRPV4 serves as a route of Ca2+ influx into the cortical neurons in response to pharmacological stimuli.
Figure 6.
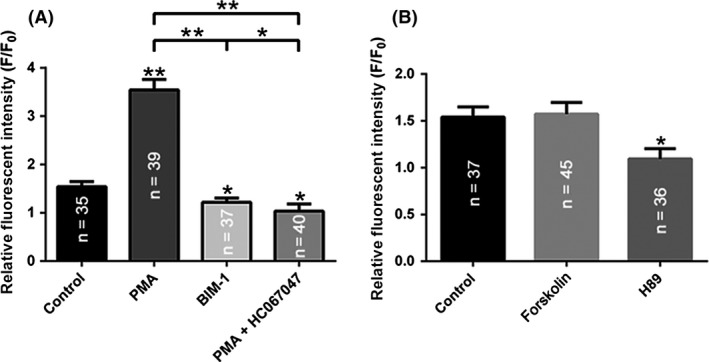
PKC but not PKA‐dependent pathway modulates [Ca2+]i elevations in the primary cortical neurons. (A) Summary graph of the amplitude of [Ca2+]i response to 4α PDD in the control and after 10 min treatment with PMA, PMA+HC067047 or BIM‐1. (B) Summary graph of the 4α PDD‐induced changes in [Ca2+]i levels in the control and after 10 min treatment with forskolin or H89. **P < 0.01, *P < 0.05. Number of neurons is indicated in columns for each condition.
PKC, but not PKA, Cascades Acutely Regulate [Ca2+]i in Cortical Neurons
PKC and PKA signaling cascades can directly phosphorylate TRPV4 20. Here, we determined whether these signaling cascades are involved in the control of [Ca2+]i elevation by affecting TRPV4 activity in cortical neurons. Stimulation of PKC with 200 nM Phorbol‐12‐Myristate‐13‐Acetate (PMA) greatly potentiated 4αPDD‐mediated elevations in [Ca2+]i. Here, the response to 4αPDD increased from 1.54 ± 0.05 to 3.54 ± 0.10‐fold. However, the administration of a highly selective, cell‐permeable PKC inhibitor, bisindolylmaleimide I (BIM‐I, 200 nM), moderately decreased the amplitude of the 4αPDD‐mediated [Ca2+]i response from 1.54 ± 0.05 to 1.22 ± 0.04‐fold. Moreover, we repeated the treatment with PMA in the presence of the TRPV4 inhibitor HC067047. The amplitudes of the 4αPDD‐mediated [Ca2+]i responses were significantly decreased from 3.54 ± 0.10 to 1.03 ± 0.07‐fold. Overall, we conclude that the [Ca2+]i response to pharmacological stimuli may be regulated by the stimulation of a PKC signaling cascade and that this regulation occurs in a TRPV4‐dependent manner (Figure 6A).
We next examined the role of the PKA cascade in the regulation of TRPV4‐mediated Ca2+ responses in cortical neurons. As shown in Figure 6B, following treatment with 20 μM forskolin, which elevates intracellular cAMP levels, the [Ca2+]i response to 4αPDD ranged from 1.54 ± 0.05 to 1.57 ± 0.06‐fold. These results indicate that this increase in cAMP failed to affect 4αPDD‐mediated [Ca2+]I responses; however, the [Ca2+]i response to 4αPDD was significantly decreased from 1.54 ± 0.05 to 1.09 ± 0.05‐fold by using 20 μM H89, which is specific antagonist of PKA signal pathway. These results suggest that the PKA signaling cascade has no appreciable role in regulation of TRPV4‐mediated [Ca2+]i increases in the cortical neurons.
Discussion
In the present study, we demonstrated that the expression of TRPV4 protein was upregulated in the tissues of patients with FCD compared with that in the CTX. Moreover, the IHC results demonstrated that TRPV4 IR was mainly localized within neuronal microcolumns and malformed cells. In addition, our calcium imaging experiments indicated that TRPV4 served as a route of Ca2+ influx into the cortical neurons in response to pharmacological activation. Furthermore, the level of protein expression of PKC, but not PKA, was significantly increased in FCD specimens compared to CTX. Intriguingly, we observed that the PKC‐dependent signaling pathway is responsible for augmented TRPV4 activation in cortical neurons. These results might expand our understanding of the role of TRPV4 in the FCD.
Enhanced Expression of TRPV4 in FCD
In the central nervous system, the activation of TRPV4 could result in excitatory neurotransmitters released and influence neural excitabilities 17, 25. Li and colleagues indicated that TRPV4 is involved in the enhancement of hippocampal synaptic transmission by increasing presynaptic glutamate release and promoting postsynaptic AMPA receptor function 26. In the present study, we detected greater TRPV4 protein levels in FCD compared to CTX samples. Moreover, both glutamatergic and GABAergic neurons were co‐expressed with TRPV4 in FCDs. Therefore, we speculate that the enhanced expression of TRPV4 may result in the disruption of the excitatory/inhibitory balance of neural circuits in the brain, thereby promoting seizure activity in patients with FCD lesions. Indeed, TRPV4 has been shown to have an important role in hyperthermia‐induced seizures 27. Nevertheless, further electrophysiological investigations in patients with FCD are required to support our hypothesis.
Cellular Distribution of TRPV4 in FCD
Our experiments showed that TRPV4‐positive malformed cells and microcolumns were of neuronal lineages, as they coexpressed NF200 or NeuN. Consistent with a previous study 28, we found that TRPV4‐positive BCs were partially colabeled with the glial marker GFAP, thereby indicating that they could be both glial lineages and neuronal lineage.
DNs are characterized by large somata, abnormal initial portion of apical dendrite and axon 29, 30. Recent studies have demonstrated that there is a strong correlation between the presence of DNs and hyperexcitable intrinsic membrane properties 31, 32. Some reports indicated that larger amplitude of Ca2+ influx in this type of cells lead to hyperexcitability 29, 33. Whether the persistent neuronal upregulation of TRPV4 in FCD is intrinsic to the central nervous system developmental lesion per se or is induced by seizures, or both, is unknown. In addition, single cell patch clamp studies using BCs have demonstrated that they are electrically silent 34. The role of BCs in the epileptogenesis of FCD remains obscure. Several studies indicated that BCs could decrease the spread of epileptogenic activity by increasing in clearance of glutamate 35.However, BCs expressed high level of gap junction‐forming connexin 43 would alter gap junctional coupling and therefore may contribute to epileptogenesis 36, 37.
It has been recognized that the activated astrocytes in FCD are involved in the generation of seizures 38, 39; however, the activation of TRPV4 in glial cells would initiate excitatory gliotransmitter release and efficiently increase neuronal excitation 40. Furthermore, high protein levels of TRPV4 in astrocytes could result in oxidative stress‐induced cell damage 41. Our IHC results indicated that astrocytes in FCD expressed high levels of TRPV4, suggesting a possible role of glial dysfunction in modifying hyperexcitability. Changes in the permeability of the BBB may result in chronic neuronal hyperexcitability 42. Emerging evidence demonstrates that activation of TRPV4 results in the upregulation of matrix metalloproteinase 9 (MMP9) 43, which can destroy the BBB by digesting the endothelial basal lamina 44. Interestingly, we have reported the overexpression of MMP9 in FCDIIb lesions 45. Moreover, our immunohistochemistry results revealed that endothelial cells in FCDs expressed a high level of TRPV4. Therefore, we speculate that TRPV4 may exacerbate seizure activity in FCD by disrupting the BBB through the upregulation of MMP9 in endothelial cells.
TRPV4‐mediated Ca2+ influx in Epileptogenesis
Calcium plays an important role in supporting neuronal survival. The accumulation of intracellular Ca2+ affects mitochondrial depolarization activity 46, 47, which is essential for ATP synthesis and subsequently controls neuronal survival 48, 49. In addition, Ghazizadeh and colleagues reported that epilepsy is involved in Ca2+ entry and oxidative stress‐induced neuronal death 50. Our calcium imaging studies confirm that TRPV4 is capable of increasing Ca2+ in cortical neurons. Based on these results, we hypothesize that TRPV4 activation induces neuronal death via excess calcium accumulation, thereby contributing to the pathogenesis of FCD. However, we have only performed our calcium imaging experiments in normal primary cortical neurons of rats. Because no suitable cell model of FCD could be selected for our experiments, the detailed mechanism of the function of TRPV4 in FCD could not be elucidated in detail. Accordingly, further investigations in vivo and in vitro are needed to support our hypothesis.
The Role of PKC and PKA in FCD
The PKC‐ and PKA‐mediated phosphorylation of sodium channels can alter neuronal excitability 51, which is most likely involved in the genesis of epilepsy 52. Moreover, PKC and PKA could directly phosphorylate TRPV4 in expression systems 20. In the present study, we observed a pronounced increase in PKC, but not PKA, expression in FCD specimens compared to that of CTX tissues. Moreover, we showed that 4αPDD‐induced [Ca2+]i elevations are under regulation of the PKC pathway and this regulation occurred in a TRPV4‐dependent manner. Overall, we speculated that the increased expression of PKC may be involved in epileptogenesis of FCD by modulating the functional state of TRPV4. While PKC could directly phosphorylate multiple S/T residues within the N‐terminus of over‐expressed TRPV4 in HEK293 cells 20, it is unknown whether the PKC‐mediated regulation of TRPV4 function in cortical neurons is directly involved in channel phosphorylation. In addition, it has been reported that the translocation of TRPV4 in nephrons is regulated by the PKA‐dependent pathway 53. Further in vivo experiments are required to determine whether a similar regulatory mechanism of PKA exists in cortical neurons.
In conclusion, our findings demonstrate an association between the overexpression and altered distribution of TRPV4 and FCDs, which suggests that TRPV4 may be involved in the epileptogenic properties of FCD. Calcium imaging experiments indicated that TRPV4 could serve as a calcium route into cortical neurons and this functional state occurs in a PKC‐dependent manner. Thus, TRPV4 regulation by the PKC signaling pathway may represent a potential target for antiepileptic therapy in FCD.
Conflict of Interest
The authors declare no conflict of interest.
Supporting information
Figure S1. Representative hematoxylin and eosin (H&E) staining photomicrographs of FCDs.
Figure S2. Confocal images show TRPV4‐positive cells in the Focal Cortical Dysplasia (FCD).
Acknowledgment
The investigators would like to thank the technicians Qian Chen, Jin Peng, and Wen‐Qiang Cai (Central Laboratory of Xiaoqiao Hospital, Third Military Medical University, Chongqing, People's Republic of China), for their excellent assistance with the laser‐scanning confocal microscopy. This study was supported by National Natural Science Foundation of China (No. 81271436, No. 81370028, and No. 81301115).
Reference
- 1. Tassi L, Colombo N, Garbelli R, et al. Focal cortical dysplasia: neuropathological subtypes, eeg, neuroimaging and surgical outcome. Brain 2002;125:1719–1732. [DOI] [PubMed] [Google Scholar]
- 2. Blumcke I, Thom M, Aronica E, et al. The clinicopathologic spectrum of focal cortical dysplasias: a consensus classification proposed by an ad hoc task force of the ilae diagnostic methods commission. Epilepsia 2011;52:158–174. [DOI] [PMC free article] [PubMed] [Google Scholar]
- 3. Guerrini R, Duchowny M, Jayakar P, et al. Diagnostic methods and treatment options for focal cortical dysplasia. Epilepsia 2015;56:1669–1686. [DOI] [PubMed] [Google Scholar]
- 4. Najm IM, Tassi L, Sarnat HB, Holthausen H, Russo GL. Epilepsies associated with focal cortical dysplasias (fcds). Acta Neuropathol 2014;128:5–19. [DOI] [PubMed] [Google Scholar]
- 5. Wong M. Mechanisms of epileptogenesis in tuberous sclerosis complex and related malformations of cortical development with abnormal glioneuronal proliferation. Epilepsia 2008;49:8–21. [DOI] [PMC free article] [PubMed] [Google Scholar]
- 6. Venkatachalam K, Montell C. Trp channels. Annu Rev Biochem 2007;76:387–417. [DOI] [PMC free article] [PubMed] [Google Scholar]
- 7. Vincent F, Duncton MA. Trpv4 agonists and antagonists. Curr Top Med Chem 2011;11:2216–2226. [DOI] [PubMed] [Google Scholar]
- 8. Nilius B, Szallasi A. Transient receptor potential channels as drug targets: from the science of basic research to the art of medicine. Pharmacol Rev 2014;66:676–814. [DOI] [PubMed] [Google Scholar]
- 9. Nilius B, Voets T. The puzzle of trpv4 channelopathies. EMBO Rep 2013;14:152–163. [DOI] [PMC free article] [PubMed] [Google Scholar]
- 10. Everaerts W, Nilius B, Owsianik G. The vanilloid transient receptor potential channel trpv4: from structure to disease. Prog Biophys Mol Biol 2010;103:2–17. [DOI] [PubMed] [Google Scholar]
- 11. Moran MM, McAlexander MA, Biro T, Szallasi A. Transient receptor potential channels as therapeutic targets. Nat Rev Drug Discov 2011;10:601–620. [DOI] [PubMed] [Google Scholar]
- 12. Jie P, Lu Z, Hong Z, et al. Activation of transient receptor potential vanilloid 4 is involved in neuronal injury in middle cerebral artery occlusion in mice. Mol Neurobiol 2016;53:8–17. [DOI] [PubMed] [Google Scholar]
- 13. Wang J, Wang XW, Zhang Y, Yin CP, Yue SW. Ca(2 + ) influx mediates the trpv4‐no pathway in neuropathic hyperalgesia following chronic compression of the dorsal root ganglion. Neurosci Lett 2015;588:159–165. [DOI] [PubMed] [Google Scholar]
- 14. Levine JD, Alessandri‐Haber N. Trp channels: targets for the relief of pain. Biochim Biophys Acta 2007;1772:989–1003. [DOI] [PubMed] [Google Scholar]
- 15. Alessandri‐Haber N, Joseph E, Dina OA, Liedtke W, Levine JD. Trpv4 mediates pain‐related behavior induced by mild hypertonic stimuli in the presence of inflammatory mediator. Pain 2005;118:70–79. [DOI] [PubMed] [Google Scholar]
- 16. Kauer JA, Gibson HE. Hot flash: Trpv channels in the brain. Trends Neurosci 2009;32:215–224. [DOI] [PubMed] [Google Scholar]
- 17. Ryley Parrish R, Albertson AJ, Buckingham SC, et al. Status epilepticus triggers early and late alterations in brain‐derived neurotrophic factor and nmda glutamate receptor grin2b DNA methylation levels in the hippocampus. Neuroscience 2013;248:602–619. [DOI] [PMC free article] [PubMed] [Google Scholar]
- 18. Jiang L, Kang D, Kang J. Potentiation of tonic gabaergic inhibition by activation of postsynaptic kainate receptors. Neuroscience 2015;298:448–454. [DOI] [PubMed] [Google Scholar]
- 19. Lopes MW, Lopes SC, Costa AP, et al. Region‐specific alterations of ampa receptor phosphorylation and signaling pathways in the pilocarpine model of epilepsy. Neurochem Int 2015;87:22–33. [DOI] [PubMed] [Google Scholar]
- 20. Fan HC, Zhang X, McNaughton PA. Activation of the trpv4 ion channel is enhanced by phosphorylation. J Biol Chem 2009;284:27884–27891. [DOI] [PMC free article] [PubMed] [Google Scholar]
- 21. Engel J. Surgical treatment of the epilepsies. New York: Raven Press, 1987. [Google Scholar]
- 22. Zurolo E, Iyer A, Maroso M, et al. Activation of toll‐like receptor, rage and hmgb1 signalling in malformations of cortical development. Brain 2011;134:1015–1032. [DOI] [PubMed] [Google Scholar]
- 23. Schick V, Majores M, Engels G, et al. Differential pi3k‐pathway activation in cortical tubers and focal cortical dysplasias with balloon cells. Brain Pathol 2007;17:165–173. [DOI] [PMC free article] [PubMed] [Google Scholar]
- 24. Zhang C, Atasoy D, Arac D, et al. Neurexins physically and functionally interact with gaba(a) receptors. Neuron 2010;66:403–416. [DOI] [PMC free article] [PubMed] [Google Scholar]
- 25. Shibasaki K, Suzuki M, Mizuno A, Tominaga M. Effects of body temperature on neural activity in the hippocampus: regulation of resting membrane potentials by transient receptor potential vanilloid 4. J Neurosci 2007;27:1566–1575. [DOI] [PMC free article] [PubMed] [Google Scholar]
- 26. Li L, Yin J, Jie PH, Lu ZH, Zhou LB, Chen L. Transient receptor potential vanilloid 4 mediates hypotonicity‐induced enhancement of synaptic transmission in hippocampal slices. CNS Neurosci Ther 2013;19:854–862. [DOI] [PMC free article] [PubMed] [Google Scholar]
- 27. Hunt RF, Hortopan GA, Gillespie A, Baraban SC. A novel zebrafish model of hyperthermia‐induced seizures reveals a role for trpv4 channels and nmda‐type glutamate receptors. Exp Neurol 2012;237:199–206. [DOI] [PMC free article] [PubMed] [Google Scholar]
- 28. Oh HS, Lee MC, Kim HS, et al. Pathophysiologic characteristics of balloon cells in cortical dysplasia. Childs Nerv Syst 2008;24:175–183. [DOI] [PubMed] [Google Scholar]
- 29. Cepeda C, Hurst RS, Flores‐Hernandez J, et al. Morphological and electrophysiological characterization of abnormal cell types in pediatric cortical dysplasia. J Neurosci Res 2003;72:472–486. [DOI] [PubMed] [Google Scholar]
- 30. Abdijadid S, Mathern GW, Levine MS, Cepeda C. Basic mechanisms of epileptogenesis in pediatric cortical dysplasia. CNS Neurosci Ther 2015;21:92–103. [DOI] [PMC free article] [PubMed] [Google Scholar]
- 31. Andre VM, Wu N, Yamazaki I, et al. Cytomegalic interneurons: a new abnormal cell type in severe pediatric cortical dysplasia. J Neuropathol Exp Neurol 2007;66:491–504. [DOI] [PubMed] [Google Scholar]
- 32. Cepeda C, Andre VM, Levine MS, et al. Epileptogenesis in pediatric cortical dysplasia: the dysmature cerebral developmental hypothesis. Epilepsy Behav 2006;9:219–235. [DOI] [PubMed] [Google Scholar]
- 33. Cepeda C, Andre VM, Hauptman JS, et al. Enhanced gabaergic network and receptor function in pediatric cortical dysplasia type iib compared with tuberous sclerosis complex. Neurobiol Dis 2012;45:310–321. [DOI] [PMC free article] [PubMed] [Google Scholar]
- 34. Cepeda C, Andre VM, Vinters HV, Levine MS, Mathern GW. Are cytomegalic neurons and balloon cells generators of epileptic activity in pediatric cortical dysplasia? Epilepsia 2005;46(Suppl 5):82–88. [DOI] [PubMed] [Google Scholar]
- 35. Gonzalez‐Martinez JA, Ying Z, Prayson R, Bingaman W, Najm I. Glutamate clearance mechanisms in resected cortical dysplasia. J Neurosurg 2011;114:1195–1202. [DOI] [PubMed] [Google Scholar]
- 36. Garbelli R, Frassoni C, Condorelli DF, et al. Expression of connexin 43 in the human epileptic and drug‐resistant cerebral cortex. Neurology 2011;76:895–902. [DOI] [PubMed] [Google Scholar]
- 37. Traub RD, Whittington MA, Buhl EH, et al. A possible role for gap junctions in generation of very fast eeg oscillations preceding the onset of, and perhaps initiating, seizures. Epilepsia 2001;42:153–170. [DOI] [PubMed] [Google Scholar]
- 38. Aronica E, Ravizza T, Zurolo E, Vezzani A. Astrocyte immune responses in epilepsy. Glia 2012;60:1258–1268. [DOI] [PubMed] [Google Scholar]
- 39. Ravizza T, Boer K, Redeker S, et al. The il‐1beta system in epilepsy‐associated malformations of cortical development. Neurobiol Dis 2006;24:128–143. [DOI] [PubMed] [Google Scholar]
- 40. Shibasaki K, Ikenaka K, Tamalu F, Tominaga M, Ishizaki Y. A novel subtype of astrocytes expressing trpv4 (transient receptor potential vanilloid 4) regulates neuronal excitability via release of gliotransmitters. J Biol Chem 2014;289:14470–14480. [DOI] [PMC free article] [PubMed] [Google Scholar]
- 41. Bai JZ, Lipski J. Differential expression of trpm2 and trpv4 channels and their potential role in oxidative stress‐induced cell death in organotypic hippocampal culture. Neurotoxicology 2010;31:204–214. [DOI] [PubMed] [Google Scholar]
- 42. Oby E, Janigro D. The blood‐brain barrier and epilepsy. Epilepsia 2006;47:1761–1774. [DOI] [PubMed] [Google Scholar]
- 43. Jie P, Tian Y, Hong Z, Li L, Zhou L, Chen L. Blockage of transient receptor potential vanilloid 4 inhibits brain edema in middle cerebral artery occlusion mice. Front Cell Neurosci 2015;9:141. [DOI] [PMC free article] [PubMed] [Google Scholar]
- 44. Lenglet S, Montecucco F, Mach F, Schaller K, Gasche Y, Copin JC. Analysis of the expression of nine secreted matrix metalloproteinases and their endogenous inhibitors in the brain of mice subjected to ischaemic stroke. Thromb Haemost 2014;112:363–378. [DOI] [PubMed] [Google Scholar]
- 45. Li S, Yu S, Zhang C, et al. Increased expression of matrix metalloproteinase 9 in cortical lesions from patients with focal cortical dysplasia type iib and tuberous sclerosis complex. Brain Res 2012;1453:46–55. [DOI] [PubMed] [Google Scholar]
- 46. Tok L, Naziroglu M, Uguz AC, Tok O. Elevated hydrostatic pressures induce apoptosis and oxidative stress through mitochondrial membrane depolarization in pc12 neuronal cells: a cell culture model of glaucoma. J Recept Signal Transduct Res 2014;34:410–416. [DOI] [PubMed] [Google Scholar]
- 47. Argun M, Tok L, Uguz AC, Celik O, Tok OY, Naziroglu M. Melatonin and amfenac modulate calcium entry, apoptosis, and oxidative stress in arpe‐19 cell culture exposed to blue light irradiation (405 nm). Eye (Lond) 2014;28:752–760. [DOI] [PMC free article] [PubMed] [Google Scholar]
- 48. Espino J, Bejarano I, Paredes SD, Barriga C, Rodriguez AB, Pariente JA. Protective effect of melatonin against human leukocyte apoptosis induced by intracellular calcium overload: relation with its antioxidant actions. J Pineal Res 2011;51:195–206. [DOI] [PubMed] [Google Scholar]
- 49. Bejarano I, Redondo PC, Espino J, et al. Melatonin induces mitochondrial‐mediated apoptosis in human myeloid hl‐60 cells. J Pineal Res 2009;46:392–400. [DOI] [PubMed] [Google Scholar]
- 50. Ghazizadeh V, Naziroglu M. Electromagnetic radiation (wi‐fi) and epilepsy induce calcium entry and apoptosis through activation of trpv1 channel in hippocampus and dorsal root ganglion of rats. Metab Brain Dis 2014;29:787–799. [DOI] [PubMed] [Google Scholar]
- 51. Chen Y, Yu FH, Surmeier DJ, Scheuer T, Catterall WA. Neuromodulation of na+ channel slow inactivation via camp‐dependent protein kinase and protein kinase c. Neuron 2006;49:409–420. [DOI] [PubMed] [Google Scholar]
- 52. Liu S, Zheng P. Altered pka modulation in the na(v)1.1 epilepsy variant i1656 m. J Neurophysiol 2013;110:2090–2098. [DOI] [PubMed] [Google Scholar]
- 53. Mamenko M, Zaika OL, Boukelmoune N, Berrout J, O'Neil RG, Pochynyuk O. Discrete control of trpv4 channel function in the distal nephron by protein kinases a and c. J Biol Chem 2013;288:20306–20314. [DOI] [PMC free article] [PubMed] [Google Scholar]
Associated Data
This section collects any data citations, data availability statements, or supplementary materials included in this article.
Supplementary Materials
Figure S1. Representative hematoxylin and eosin (H&E) staining photomicrographs of FCDs.
Figure S2. Confocal images show TRPV4‐positive cells in the Focal Cortical Dysplasia (FCD).