

Summary
Aims
MicroRNAs play an important role in the pathogenesis of ischemic brain injury and in the repair process during postischemic condition. However, the key miRNAs and their function in these processes remain unclear.
Methods
Circulating blood MicroRNAs profiles were examined in the ischemic stroke patients. The predicted network of difference was analyzed by ingenuity pathway analysis. The key MicroRNAs were selected, and the function was further studied in a mouse ischemia model. The predicted downstream target was confirmed.
Results
We found that 24 MicroRNAs were differently expressed in stroke patients compared to the control (P < 0.05). Bioinformatic analysis showed a MicroRNAs regulated network with the highest score in the stroke cascade, which was consisted of 10 MicroRNAs including key hypoxia‐related miR‐210 and its predicted downstream target brain derived neurotrophic factor (BDNF). Lentivirus‐mediated miR‐210 overexpression enhanced the microvessel density and the number of neural progenitor cells in the ischemic mouse brain (P < 0.05) and improved neurobehavioral outcomes in the ischemic mouse (P < 0.05). MiR‐210 upregulation increased mBDNF/proBDNF protein expression in the normal and ischemic mouse brain. The dual‐luciferase reporter assay identified that BDNF was the direct target of miR‐210.
Conclusion
MiR‐210 is a crucial ischemic stroke‐associated MicroRNAs and a potential target for the stroke therapy.
Keywords: Angiogenesis, Brain derived neurotrophic factor, MicroRNA, Neurogenesis, Stroke
Introduction
Ischemic stroke is one of the major diseases affecting the global population with high incidence, mortality, and disability. Clinical effective therapy for the stroke is still lack. Tissue plasminogen activator (tPA) is the only FDA approved drug for the acute ischemic stroke treatment. However, “4.5 h” narrow time window and a hemorrhage risk limited tPA broadly application 1. Exploration of alternative targets to reduce ischemic brain injury and improve neuronal repairing and remodeling is crucial and timely. Currently, a group of miRNAs are identified, which are related to many disease processes. miRNAs are stranded noncoding RNA molecules of ~22 nucleotides in length, which function as a regulator of gene expression by binding to the 3′ UTR region of the messenger RNA (mRNA) molecules and then regulate downstream protein by inhibiting mRNA transcription or degrading mRNA in many disease processes 2, 3. MiRNAs have several special characteristics including small size, multiple downstream targets, and detectable in the peripheral blood, which show a great potential for the stroke therapy in the future 4, 5.
Studies demonstrated that a group of miRNAs were associated with the pathogenesis of ischemic brain injury and postischemic remodeling process. The effects of specific miRNAs on neuronal differentiation, neurogenesis, neuronal cell specification, and the neurodevelopmental function have been studied 6, 7. MiRNAs showed distinct expression patterns that modulate pathogenic processes including atherosclerosis (miR‐21, miR‐126), hyperlipidemia (miR‐33, miR‐125a‐5p), hypertension (miR‐155), and plaque rupture (miR‐222, miR‐210) 8. In a miRNA screening experiment, investigators identified 114 miRNAs that exhibit hypo‐ or hyperexpression in brain samples following middle cerebral artery occlusion (MCAO) and 24 or 48 h reperfusion 9. Increase of anti‐miR‐320a reduced infarct volume during brain ischemia with a concomitant increase in aquaporin 1 and 4 mRNA and protein expression, indicating that the increased miR‐320a expression facilitated edema clearance or functional recovery 10. A study focusing on miRNAs profile in the chronic stage (6 months) of young ischemic stroke patients found that 157 miRNAs differentially regulated among the 836 miRNAs across stroke samples, and the subtypes include large artery stroke, small artery stroke, embolic stroke, and undetermined cause stroke 11. These studies suggested that miRNAs played critical roles in the ischemic pathology 12, 13. Most miRNA levels in the circulating blood paralleled their expression in the ischemic brain tissue. It provided a unique therapeutic approach for the brain ischemia 14. However, in acute ischemic stroke patients, the key miRNA and its function were unknown.
In this study, we explored the miRNA profile in ischemic stroke patients and demonstrated the differently expressed ischemia‐associated miRNAs during acute (<2 days) and subacute stages (10th day). Based on miRNA profile and ingenuity pathway analysis (IPA) results, we further investigated whether miR‐210 overexpression could reduce ischemic brain injury and improve neurobehavioral outcomes in a mouse model of MCAO. Finally, the relationship between miR‐210 expression and downstream protein BDNF expression was further identified.
Materials and Methods
Study Subjects and Blood Sample Collection
Ischemic stroke patients enrolled were approved by the Institutional Review Board (IRB) of the Ruijin Hospital, Shanghai Jiao Tong University, Shanghai, China. Written consents were obtained from enrolled patients according to the Declaration of Helsinki. The diagnosis of the ischemic stroke was confirmed by two neurologists based on clinical symptoms, neurological deficits, and the brain MRI changes. The criteria of enrollment included age, the first stroke occurrence, and the time of ischemic stroke attacking <48 h. Patients suffered serious complications such as infection, tumor, hepatic and renal failure, blood disease, and recurrent stroke were excluded. Age, sex, risk factor‐matched healthy controls were recruited from the outpatient department of the same hospital. Circulating blood (2.5 mL) was collected into a PAXgene blood RNA tube (Becton, Dickinson and Company, Franklin Lakes, NJ, USA) within 48 h and the 10th day following acute cerebral ischemia, and stored at −80°C.
RNA Extraction, Reverse Transcriptions, and Real‐time PCR Amplification
The extraction of total RNA was performed from human whole blood collected into a PAXgene blood RNA tube (Becton, Dickinson and Company) according the manufacture's protocol. RT‐PCR amplification was performed according to the manufacture's protocol of miRCURY LNA™ Universal RT microRNA PCR kit (Exiqon, Vedbaek, Denmark). The RT reaction was performed using a universal primer in a 20 μL system, which included 4 μL, 5 × reaction buffer, 2 μL enzyme mix, 10 μL nuclease free water, and 4 μL template total RNA, following the thermal cycle program of 42°C for 60 min and 95°C for 5 min. The quantitative RT‐PCR amplification was performed by a fast real‐time PCR system (7900HT, ABI, Foster City, CA, USA) with LNA™ enhanced primers using a SYBR® Green and miRNA predefined Ready‐to‐Use PCR panels (Exiqon). Total 8970 μL volume was added to a 384‐well PCR plate with 10 μL per well. A PCR plate I and a plate II were assayed according to the protocol as 95 for 10 min, followed by 40 cycles of 95 for 10 seconds and 60 seconds for 1 min. The melting curve analysis of the PCR product was performed to verify their specificity and identity.
A Blood miRNA Profile Analysis and Hierarchical Clustering in Acute Ischemic Stroke Patients
Data of miRCURY LNA™ Universal RT miRNA Ready‐to‐Use PCR panels were analyzed using Exiqon GenEx software (www.exiqon.com/mirna-pcr-anaysis). Firstly, data were imported and emerged into the GenEx. For full panels, the UniSp3 was used to calibrate between the plates as interplate calibration. A cutoff value was defined as 38. The value >38 was considered as a background. RNA spike‐in was used to normalize for potential difference in sample inhibition. The best reference gene was selected among SNORD49A, SNORD49B, U6, hsa‐miR‐423‐5p, hsa‐miR‐103, and hsa‐miR‐191 by geNorm (https://genorm.cmgg.be) and NormFinder software (http://moma.dk/normfinder-software). Then, the data were calculated the relative quantity compared to the best selected reference gene. We used the 1.5‐fold as a standard for the determination ofmiRNA expression changes according to several previous articles published 9, 14. The statistical analysis was also performed by GenEx.
MicroRNA Ingenuity Pathway Analysis
All miRNAs differentially expressed in the circulating blood following brain ischemia were imported into the ingenuity pathway analysis software (IPA, Ingenuity Pathway Analysis, http://www.ingenuity.com). The output parameters were defined as “all species”, “confirmed” and “high predicted and moderate predicted targets”. The canonical pathway and functional analysis were carried out using an IPA software. In the IPA, several predicted regulated networks were presented after enter all 24 differently expressed miRNAs. Every predicted regulated network had an evaluated score.
Experimental Animal Groups
Animal studies were reported in accordance with ARRIVE guidelines. Procedure for the use of laboratory animals was approved by the Institutional Animal Care and Use Committee of Shanghai Jiao Tong University, Shanghai, China. Guidelines of the regulation for the administration of affairs concerning experimental animals of China enacted in 1988 were followed during the animal studies. Adult male C57BL/6 mice (n = 124) weighting 25–30 g were divided into four groups: sham surgery group, transient MCAO (tMCAO) group, tMCAO+LV‐GFP group (LV‐GFP group), and tMCAO+LV‐miR‐210 group (LV‐miR‐210 group), respectively. Animals underwent 90 min MCAO after 14 days of lentiviral vector‐mediated miRNA‐210 gene transfer. Animals underwent scramble‐miR‐210 were served as the control.
Lentiviral Vector Construction and Transduction into the Mouse Brain
The pre‐miR‐210 hairpin structure and scramble control hairpin were inserted in lentiviral vector pCDH‐CMV‐MCS‐EF1‐copGFP (SBI) downstream of the cytomegalovirus promoter. Packaging of the pCDH expression constructs into pseudo‐viral particles was performed with the pPACKH1™ Packaging Plasmid mix (SBI) using lipofectamine 2000 (Invitrogen, Carlsbad, CA, USA) in a pseudo‐viral particle producer cell line (293TN cells). The supernatant was harvested, and viral particles were concentrated. Mice were anesthetized by ketamine (100 mg/kg; Sigma, San Louis, MO, USA) and xylazine (10 mg/kg; Sigma) and placed in a stereotaxic apparatus. A burr hole was drilled 2.0 mm left lateral to the sagittal suture and 0.5 mm posterior to the coronal suture. A Hamilton syringe was stereotactic inserted into the striatum (3.0 mm under the cortex). LV‐miR‐210 or LV‐GFP solution (2.2 μL) containing 2 × 10⁹ TU/mL was injected into the caudate putamen with a rate of 0.2 μL/min, respectively. The needle was withdrawn after 15 min of injection. The hole was sealed by bone wax.
Transient Middle Cerebral Artery Occlusion in Mice
Two weeks after viral transduction, mice were underwent tMCAO model which was described previously 15. Briefly, virus‐transduced mice (25–30 g) were anesthetized with ketamine (100 mg/Kg; Sigma) and xylazine (10 mg/kg; Sigma). After the common carotid artery, the external carotid artery and the internal carotid artery were isolated; a 6‐0 monofilament nylon suture (Covidien, Mansfield, MA, USA) coated with silicon was inserted and stopped at the opening of the middle cerebral artery. The distance from the bifurcation of the external/internal to the opening of the middle cerebral artery was 9.5 ± 0.5 mm. Reperfusion was achieved after 90 min of MCAO with suture withdrawal. To confirm the success of occlusion and reperfusion, surface cerebral blood flow (sCBF) was examined using a laser Doppler flowmetry (Moor Instruments, Devon, UK). The successful occlusion presents a > 80% decline in sCBF compared to the preoperative baseline CBF. Successful reperfusion showed sCBF back to the baseline level. The sham mice were subjected to the same procedure except for suture insertion. The data of sCBF are shown in Table S1.
Infarct Volume Determination by a Cresyl Violet Staining of the Brain Sections
Cresyl violet staining of the brain sections was performed every 9 pieces from anterior commissure to hippocampus. The ischemic area in white color and the infarct volume were calculated by the formula (h = the thickness of the slices; s = the area of the slice), as reported by our previous study 16.
Neurobehavioral Tests
Mice were assessed by the neurobehavioral test one day before and after lentiviral vector injection, one day before tMCAO, and up to 28 days after tMCAO. The neurobehavioral tests included neurological function impairment, rotarod test, and corner test. Each test was assessed three times, and average value was collected and calculated.
Modified neurological severity scores (mNSS). The tests focused on the sensibility, motor, and ataxia. Following 1–28 days of tMCAO, mNSS testing was performed to assess the neurological status of the animals, which included motor, sensory, balance, and reflex tests (normal score, 0; maximal deficit score, 14). For the test of motor function, animals were raised by the tail and the flexion of forelimb was observed (0–3), and their gait was observed after being placed on the floor (0–3). Beam balance tests were performed to look into the animals’ posture on a beam (0–6). The reflexes absent test (0–2) included the pinna reflex and the corneal reflex.
Rotarod test. Mice were trained three consecutive days before the assessment one time every morning and afternoon. Mice were maintained on the rode, and the speed was accelerated from 0 to 40/min in 2 min. Mice walked on the rode until the fallen. The test began after the stable of the training. The time was calculated from the beginning of walk to the fallen. If mice hanged on the rode 2 round or touched the wall, the test was finished.
Corner turn test. The equipment was constituted by two cardboard with 30 degree angle open and 30 × 30 cm2 surfaces. Mice were placed in the equipment and faced on the corner 1/2. Mice walked straight to the corner and let the whiskers touched the two sides. Mice stood up and turned back toward the exit. The counts of records were made toward left or right. The test was repeated 10 times, and the percentage of turns was calculated.
RNA Extraction and RT‐PCR Determination
Mice were sacrificed at 7, 14, and 28 days after tMCAO. The brain tissue of left basal ganglia was examined using the same method, which was performed on humans. Reverse transcription and real‐time PCR were performed according to the manufacture's protocol of the TaqMan miRNA assay Kit (Applied Biosystems, Waltham, MA, USA) by a fast real‐time PCR system (7900HT, ABI). The relative miR‐210 level was normalized to the endogenous control U6 in triplicate and calculated.
Immunohistochemistry
Mice were perfused transcardially with 0.9% normal saline and 4% paraformaldehyde after sacrificing. The brain was immersed in 4% paraformaldehyde. The brain was embedded by Tissue‐Tek OCT (Sakura Finetek USA, Inc., Torrance, CA, USA) and cut coronal brain sections using a cryostat. For immunofluorescence staining, free‐floating sections were incubated in 0.5% Phosphate Buffered Saline with Tween‐20 (PBST) for 10 min, blocked in 10% Bovine Serum Albumin (BSA) for an hour, and finally incubated at 4°C with the primary antibody at the following dilution: anti‐CD31 (1:200, R&D systems, Tustin, CA, USA), anti‐NeuN (1:100, Millipore, Billerica, MA, USA), anti‐DCX (1:200, Santa Cruz Biotechnology, Santa Cruz, CA, USA). The sections were washed and incubated with Alexa Fluor 594‐ or Alexa Fluor 488‐conjugated secondary antibodies (1:500, Invitrogen) for an hour. Each experiment had appropriate positive and negative controls. The imaging was evaluated using a fluorescence microscope (Leica, Solms, Germany).
Western Blot Analysis
The brain tissue of left basic ganglion was dissected. It was mixed with RIPA (Millipore), PMSF (Thermo Scientific, Waltham, MA, USA), haltTM protease inhibitor cocktail (Thermo Scientific) and centrifuged 12000 g for 30 min at 4°C. The protein concentration was calculated by BCA Protein Assay Kit (Thermo Pierce, Rockford, IL, USA). The SDS‐PAGE was performed and transferred to a nitrocellulose membrane (Whatman Inc., Florham Park, NJ, USA). The membrane was incubated with BDNF primary antibody (1:200, Santa Cruz Lab) overnight at 4°C and then with a secondary antibody for an hour at room temperature. The enhanced Electro‐Chemi‐Luminescence (ECL) substrate (Pierce) was used to visualize the band, and the picture was captured by an imaging system (Bio‐Rad, Hercules, CA, USA). Finally, the quantification analysis was performed by Quantity‐one software.
Vascular Density Counting
Three brain coronal sections 1.0 mm anterior, posterior, and the section of the needle track were chosen. Three areas of the left, right, and bottom of the needle track of every section were photographed using a 20X objective. The microvessel density was quantified by Image analysis software (NIH Image J, Bethesda, MD, USA). The mean of these vascular counting was considered as vascular density.
Dual‐luciferase Reporter Assay
A 300‐bp fragment of BDNF 3′‐UTR from the mice was amplified by PCR using the primers. The fragment, which contained a broadly conserved motif in the vertebrates for miR‐210 (www.targetscan.org), was cloned downstream of the luciferase gene in the psiCHECH™‐2 dual‐luciferase miRNA Target expression vector (Promega, Madison, WI, USA). The site‐specific mutagenesis of the miR‐210 target binding site was performed by quick change kit (Stratagene, Agilent Technologies Inc., Palo Alto, CA, USA) a mutant vector. 293T cells were cultured in 96‐well plates and each transfected with either psiCHECH‐BDNF or psiCHECH‐BDNF mutant with miR‐210 mimic or the negative control. Transfection was performed using Lipofectamine 2000 and Opti‐MEM reduced serum medium (Invitrogen). Forty‐eight hours after transfection, luciferase activity was measured using Dual luciferase assay kit (Promega) with plate reader. The results were presented as relative activity. Each transfection was repeated fourth times in triplicate.
Statistical Analysis
Data between two groups were compared using Student's t‐test, multigroups used by one‐way ANOVA with Bonferroni correction. Data are presented as mean ± SD. P < 0.05 was considered as statistical significance.
Results
Clinical Data of Patients
Five acute ischemic stroke patients and five healthy controls were enrolled in the study (Table S2). The mean age of 2 groups was 65 ± 9 years for the stroke group and 64 ± 10 years for the control group, respectively. There were no significant difference in 2 groups among sex, age, race, hypertension, hyperlipidemia, diabetes, and cardiac disease.
The Differentially Expressed miRNAs Profile and Regulated Network
To determine the miRNA expression profile following ischemic stroke, we first performed circulating miRNAs in ischemic stroke patients. We demonstrated that 24 miRNAs were significantly upregulated or downregulated >1.5‐fold within 48 h and 10 days in ischemic stroke patients compared to the healthy control (P < 0.05), which included hsa‐let‐7a*, let‐7f‐2*, miR‐1254, miR‐1468, miR‐15a*, miR‐192*, miR‐224*, miR‐29a*, miR‐223, miR‐324‐5p, miR‐891b, miR‐142‐3p, miR‐143, miR‐144, miR‐190, miR‐192, miR‐19b, miR‐210, miR‐215, miR‐29b, miR‐342‐3p, miR‐574‐3p, miR‐589, miR‐720 (Figure 1A), suggesting miRNAs involved in ischemic brain injury. IPA analysis showed that miRNAs in a predicted regulated network after ischemic stroke with the highest score were consisted by miR‐210,miR‐589,miR‐891,miR‐223,miR‐15,miR‐143,miR‐574,miR‐192*,miR‐1254, and let‐7* (Figure 1B). IPA analysis also indicated that several downstream proteins, including BDNF, were closely associated with miRNAs, suggesting these miRNAs should be further studied as potential targets.
Figure 1.
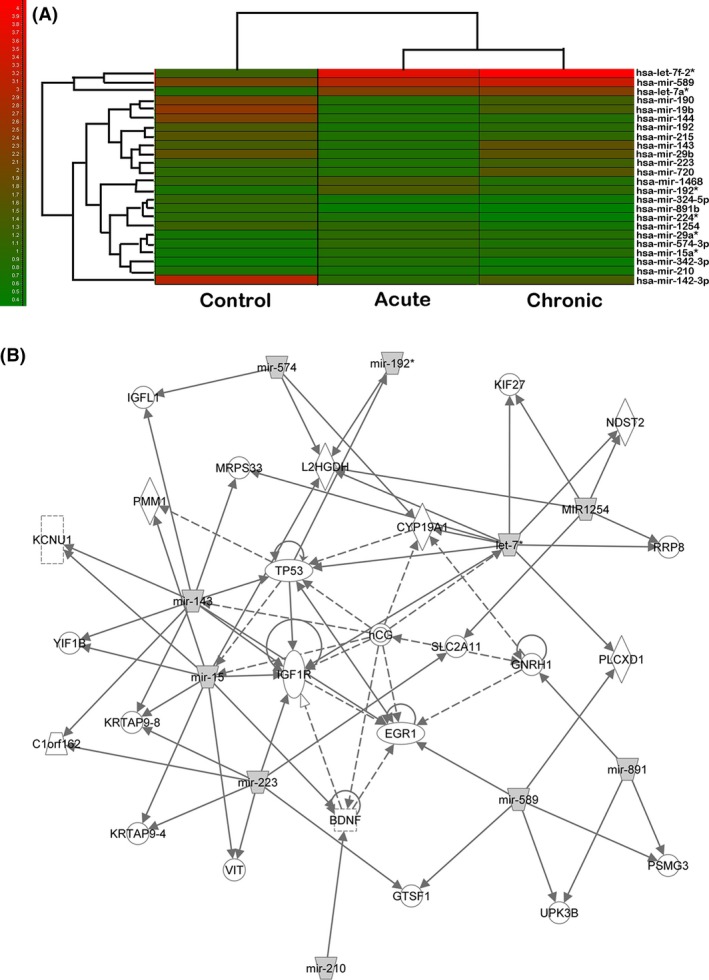
MiRNA expression profile in patients following acute ischemic stroke. (A) Heat map shows the cluster analysis result that 24 miRNAs were significantly upregulated or downregulated more than 1.5‐fold in acute ischemic stroke patients <48 h and in day 10th after ischemic stroke attacked compared to the controls (P < 0.05). (B) Diagram shows the ingenuity pathway analysis of miRNA expression profile settled up, which predicted a miRNA regulated network after ischemic stroke with the highest score. Gray color box indicates 10 miRNAs, which were detected in our patient investigation. The predicted or confirmed downstream target genes were also included.
miR‐210 Gene Transfer Improved Neurological Outcomes and Focal Angiogenesis and Neurogenesis in Mice Following tMCAO
The protocol of animal experiments is shown in Figure 2. Compared to the sham surgery group, tMCAO groups exhibited lower mNSS score, left preference in the corner test, shorter latency on the rod, and increased numbers of CD31+ cells in the basal ganglion and DCX+ cells in the subventricular zone (SVZ) and hippocampus of the ischemic brain following cerebral ischemia (Figure 3, 4, 5, P < 0.05). These tMCAO animals were then randomly assigned into the tMCAO group, LV‐GFP group, and LV‐210 group. The results showed that mNSS score, latency on the rod, and left preference greatly improved in the LV‐miR‐210‐treated mice compared to the sham surgery group, the tMCAO group, and the LV‐GFP group, especially at day 28 after tMCAO (Figure 3, P < 0.05). Compared to the LV‐GFP group, the number of CD31+ cells was significantly increased following miR‐210 gene transfer in the basal ganglion after tMCAO (Figure 4, P < 0.05). Similarly, compared to the LV‐GFP group, the number of DCX+ cells was significantly increased following miR‐210 gene transfer after tMCAO (Figure 5, P < 0.05). These DCX+ cells were located not only in the SVZ and the striatum region, but also in the hippocampus of the ischemic brain (Figure 5, P < 0.05).
Figure 2.
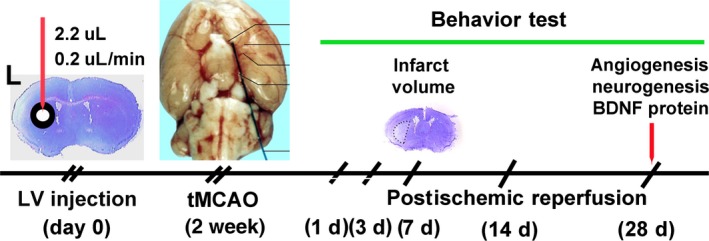
The experimental design of the ischemic brain model study. The illustration showed the experimental process. Mice underwent lentivirus‐miR‐210 gene transfer in the left striatum. Two weeks later, these mice underwent 90 min of transient middle cerebral artery occlusion (tMCAO) to induce focal ischemia. Neurobehavioral tests were examined following 1, 3, 7, 14, and 28 days of MCAO. The infarct volume was evaluated following 7 day of tMCAO. Focal angiogenesis, neurogenesis, and brain derived neurotrophic factor expression were further determined following 28 days of tMCAO.
Figure 3.
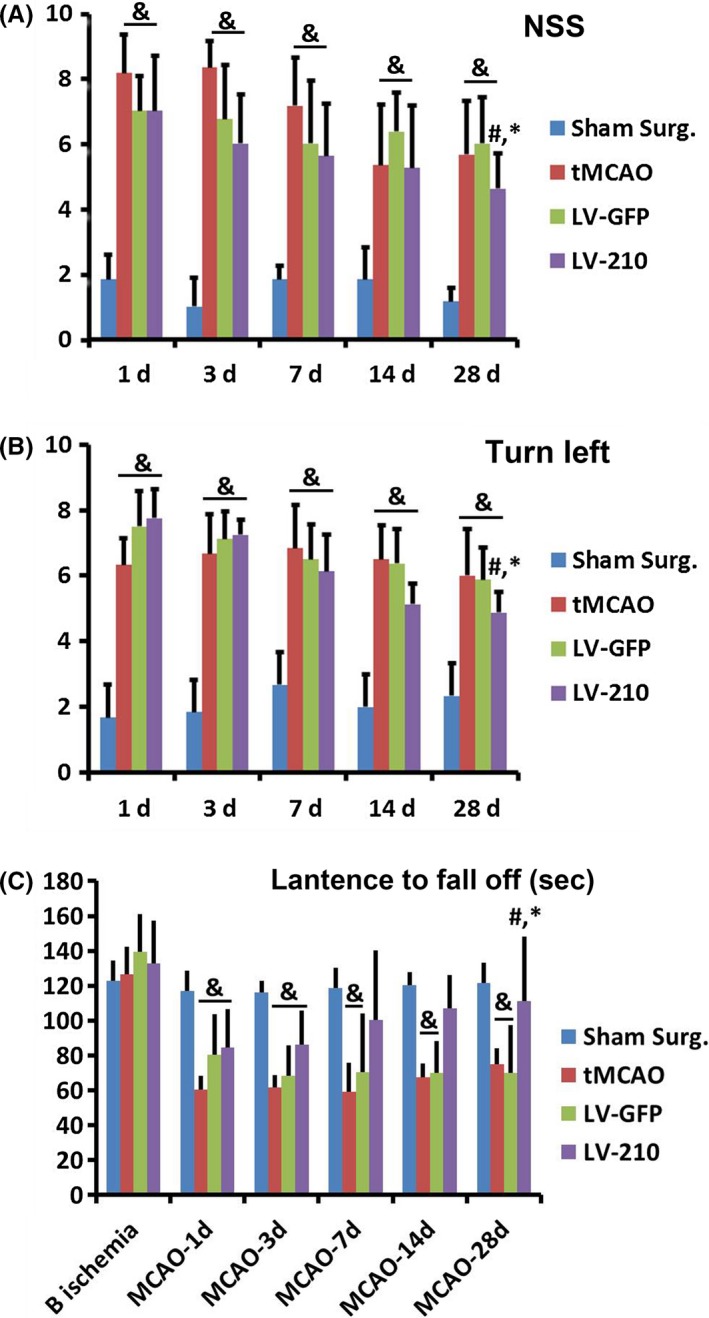
MiR‐210 overexpression improved the long‐term outcome of transient middle cerebral artery occlusion (tMCAO) mice. Line charts show the neurological scores (A), the corner test (B), and rotarod test (C) in LV‐miR‐210‐treated mice compared to the sham surgery group, tMCAO group, and LV‐GFP group following up to 28 days of tMCAO. N = 9 in each group. & P < 0.05, versus the sham surgery group, # P < 0.05, versus the tMCAO group, *P < 0.05, versus LV‐GFP‐treated mice.
Figure 4.
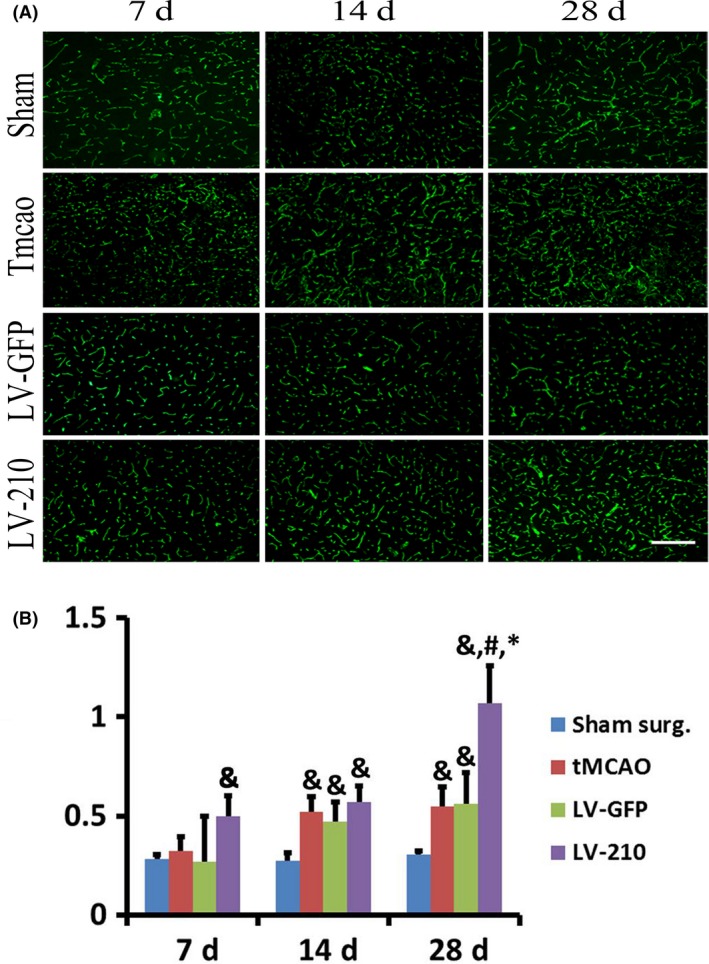
MiR‐210 overexpression promoted angiogenesis in the ischemic brain of transient middle cerebral artery occlusion (tMCAO) mice. (A) Photomicrographs show the CD31+ microvessel staining at 7, 14, and 28 days in the striatum in the perifocal region of ipsilateral hemisphere following 7, 14, and 28 days of tMCAO in sham surgery group, tMCAO group, LV‐GFP group, and LV‐miR‐210‐treated mice. Bar=100 μm. (B) Bar graph shows the semi‐quantified microvessel density in the perifocal region of ipsilateral hemisphere. Data were mean ± SD. N = 6 in each group. & P < 0.05, versus the sham surgery group, # P < 0.05, versus the tMCAO group, *P < 0.05, versus LV‐GFP‐treated mice.
Figure 5.
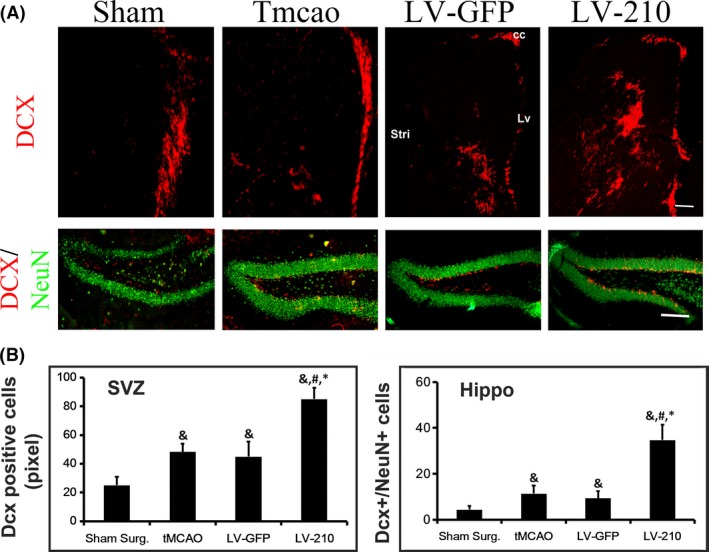
MiR‐210 overexpression promoted neurogenesis in the ischemic brain of transient middle cerebral artery occlusion (tMCAO) mice. (A) Photomicrograph shows the DCX+ staining (red) in the SVZ of ipsilateral hemisphere following 28 day of tMCAO in the sham surgery group, tMCAO group, LV‐GFP group, and LV‐miR‐210 group (upper layer). Bar=200 μm. Photomicrographs show that NeuN+ (Green) and DCX+ (Red) double staining in the hippocampus of ipsilateral hemisphere following 28 day of tMCAO in the sham surgery group, tMCAO group, LV‐GFP group, and LV‐miR‐210 group (under layer). Bar= 100 μm. (B) Bar graph shows the semi‐quantified DCX+ neurons in the SVZ (left) and NeuN+/ DCX+ cells in the hippocampus (right) of ipsilateral hemisphere of the ischemia brain. Data were mean ± SD. N = 6 in each group. & P < 0.05 versus the sham surgery group, # P < 0.05, versus the tMCAO group, *P < 0.05, versus LV‐GFP‐treated mice.
MiR‐210 Regulated Directly the Target Gene BDNF
Brain derived neurotrophic factor was the predicted direct target of miR‐210 according to the result of our IPA analysis and in the data bank (www.targetscan.org, Figure 6A). The dual‐luciferase reporter assay system showed a significantly decrease Renilla/firefly luciferase ratio in the wide‐type group, compared to the mutant type group (Figure 6B). MiR‐210 overexpression could increase mBDNF/proBDNF protein expression ratio in the normal mouse brain and the ischemic mouse brain (Figure 6D). All data demonstrated that BDNF was one of the direct targets of miR‐210.
Figure 6.
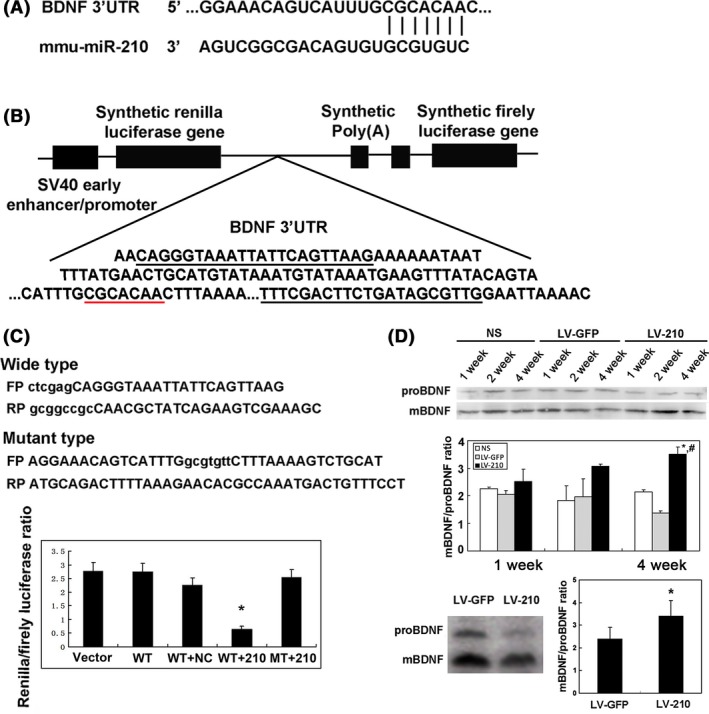
Brain derived neurotrophic factor (BDNF) was the direct target of miR‐210. (A) 5′ of the miR‐210 (CGCACAA) was complementally with 3′ UTR of BDNF (GCGUGUC) in the structure. (B) The 300 bases containing 3′ UTR of BDNF were inserted into psiCHECK‐2 vector. (C) Les primers show the psiCHECH‐BDNF wide type or psiCHECH‐BDNF mutant type. Bar graph shows the quantification of Renilla/firefly luciferase ratio in the psiCHECH vector group, wide type alone, wide type plus normal saline, wide type plus miR‐210, mutant type plus miR‐210. N = 4 in each group. *P < 0.05, mutant type plus miR‐210 versus other group. (D) Western blot showed that mature BDNF and pro‐BDNF expression in the LV‐miR‐210‐, LV‐GFP‐, or NS‐treated mice following 7, 14, and 28 day of lentiviral vector injection in the normal mice brain; and mature BDNF and pro‐BDNF in the ipsilateral hemisphere of mice following 28 days of tMCAO. Bar graph shows semi‐quantified BDNF protein expression in the ipsilateral hemisphere in mice. Data were mean ± SD. N = 4 in each group. *P < 0.05, LV‐miR‐210‐treated versus LV‐GFP‐treated mice; # P < 0.05, LV‐miR‐210‐treated versus saline‐treated mice.
Discussion
In the present study, the miRNA profile showed that twenty‐four miRNAs were differently expressed in the circulating blood in stroke patients compared to the normal control. Bioinformatic analysis showed a predicted miRNA regulated network with the highest score after cerebral ischemia, which was consisted of 10 miRNAs included miR‐210 and the related predicted targets. MiR‐210 overexpression could regulate its direct target gene BDNF, promoted angiogenesis and neurogenesis in the ischemic brain, and improved long‐term outcomes in ischemic mice. It suggested that miR‐210 was a key stroke‐associated miRNA and a potential therapeutic target for the stroke therapy.
In the past years, the targets for stroke therapy focused on the changes of protein. However, clinical practice was limited because many proteins related to disease changed; blocking one protein was not insufficient to stop pathological process. In addition, large molecular weight and short half‐life of protein confined protein application. Currently, a novel class of small molecule “miRNAs” in the RNA level has been taken attention. One miRNA could regulate multiple downstream proteins and small molecules. Hence, miRNAs were adapted to the ischemic injury cascade and provided a potential approach for stroke diagnosis and therapy. The exploration of miRNA functional network has aided to understand ischemic pathology and find potential therapeutic target.
We showed 24 miRNAs were differently expressed in the circulating blood of stroke patients. It provided evidence that multiple miRNAs functioned together and participated in ischemic brain injury and repairing. Our miRNAs profile was somewhat different to previous reports. Most reported miRNAs profiles were studied in animal model, which was not well represented in clinical situation. Jessalen studied miRNAs profiles in stroke patients in the chronic stages at “6 months” and in younger people “18–49 years”. We showed miRNAs profiles in the acute stage of elder stroke patients. We chose elder “50–80 years” patients as this age was at higher stroke risk. Besides, we focused on the acute stage “within 48 h” and subacute stage “the 10th day”. Brain injury and stroke damage cascade activated within 2–3 days following cerebral ischemia. Ischemic brain repairing and remodeling initiated one week later, which included focal angiogenesis and neurogenesis. It was believed that long‐term prognosis of stroke patients was depending on these two key phases. In our study, we controlled the condition of enrolled objects as miRNAs expression could be various by enrolled objects, time course, etc. Among the 24 miRNAs we detected, partial miRNAs were paid attention already in the previous study, for example, let‐7 family in development and cardiovascular disease 17, 18, miR‐19b 19, and miR‐210 20 in the angiogenesis, miR‐29 21, miR‐15, miR‐144, miR‐224 in apoptosis, and miR‐223 in inflammation. Partial miRNAs are never reported, for example, miR‐1254, miR‐1468, and miR‐573‐3p.
To further explore the key miRNAs, we conducted IPA analysis to perform the bioinformatics. Based on the miRNAs profile in circulating blood of human subjects, we analyzed a miRNA network with the highest score. The miRNAs network was consisted by 10 miRNAs (miR‐210, miR‐589, miR‐891, miR‐223, miR‐15, miR‐143, miR‐574, miR‐192*, miR‐1254, and let‐7*) and their predicted targets. We believed that all the 10 miRNAs interactived together and played an important role in the pathology following cerebral ischemia. Among 10 miRNAs, miR‐210 had been attracted. It was the key hypoxia‐related miRNAs and had multiple downstream targets. It participated in the angiogenesis, neurogenesis, mitochondrial function, inflammation, oxidative stress, etc. Our previous studies demonstrated that the blood miR‐210 correlated with the brain miR‐210 after stroke. The patients with higher miR‐210 had a better prognosis 22. MiR‐210 overexpression in the brain promoted focal angiogenesis and neurogenesis in adult normal mouse 23. Interestingly, all the data similar to the IPA analysis detected showed that miR‐210 played an important role in the stroke occurrence and recovery. However, whether it could improve the long‐term outcomes in ischemic mouse model and its mechanism remains unclear.
In our previous study, we have studied the CD31+ and DCX+ staining in the striatum at day 7, 14, and 28 in the normal adult mouse brain. We found only CD31+ staining and DCX+ staining were significantly increased at 28 days 23. We then demonstrated that the behavioral outcomes were significant ameliorated only presented at 28 days. As studies demonstrated that neurogenesis and angiogenesis occurred following 14 days of cerebral ischemia, we therefore chose the endpoint examination at day 28 after MCAO 24. We found that miR‐210 overexpression could promote angiogenesis in the basal ganglion and neurogenesis in the SVZ and the hippocampus. This result confirmed our previous study in the normal mouse brain 23. Furthermore, we demonstrated that miR‐210 transduction improved long‐term outcomes in ischemic mice, suggesting miR‐210 was a potential target for stroke therapy. Finally, our results demonstrated a direct target “BDNF” of miR‐210. BDNF could promote focal angiogenesis and neurogenesis via upregulation of the ratio of BDNF/Pro‐BDNF. In the past, matured BDNF was considered as the functional form and was recognized its function of promoting neurogenesis after cerebral ischemia. Recently, pro‐BDNF was also believed to be a biological function form. It could be released from neurons and astrocytes. Unlike matured BDNF, pro‐BDNF exerted a bad function to promote brain apoptosis and necrosis 25. The ratio of matured BDNF/pro‐BDNF determined the final function 25, 26. We demonstrated that miR‐210 could upregulate matured/ BDNF/pro‐BDNF ratio, providing an evidence for repairing ischemic brain damage of miR‐210. In addition, miR‐210 was found multiple functions in other studies such as regulation of mitochondrial function 27, anti‐inflammation 28, antiapoptosis 29. Therefore, we conclude that miR‐210 could be considered a potential target for ischemic stroke therapy.
Conflict of Interest
The authors have no conflict of interest to disclose.
Supporting information
Table S1. sCBF after MCAO in all groups.
Table S2. Clinical characteristic of study subjects.
Acknowledgments
This study was supported NSFC (2011CB504405, GYY; U1232205, GYY; 81471178, GYY; 81200943, LZ; 81471246, LZ; 81501014, HXS), Shanghai healthy bureau (20124217, LZ), Guangzhou Medical University project (L1451012, HXS), the Science and Technology Commission of Shanghai Municipality (12ZR1418600, FY), and KC Wong foundation (GYY).
The first two authors contribute equally.
References
- 1. Xu AD, Wang YJ, Wang DZ. Consensus statement on the use of intravenous recombinant tissue plasminogen activator to treat acute ischemic stroke by the Chinese Stroke Therapy Expert Panel. CNS Neurosci Ther 2013;19:543–548. [DOI] [PMC free article] [PubMed] [Google Scholar]
- 2. Fiore R, Khudayberdiev S, Saba R, Schratt G. MicroRNA function in the nervous system. Prog Mol Biol Transl Sci 2011;102:47–100. [DOI] [PubMed] [Google Scholar]
- 3. Van Wynsberghe PM, Chan SP, Slack FJ, Pasquinelli AE. Analysis of microRNA expression and function. Methods Cell Biol 2011;106:219–252. [DOI] [PMC free article] [PubMed] [Google Scholar]
- 4. Sun Y, Gui H, Li Q, et al. MicroRNA‐124 protects neurons against apoptosis in cerebral ischemic stroke. CNS Neurosci Ther 2013;19:813–819. [DOI] [PMC free article] [PubMed] [Google Scholar]
- 5. Huang LG, Li JP, Pang XM, et al. MicroRNA‐29c Correlates with Neuroprotection Induced by FNS by Targeting Both Birc2 and Bak1 in Rat Brain after Stroke. CNS Neurosci Ther 2015;21:496–503. [DOI] [PMC free article] [PubMed] [Google Scholar]
- 6. Kosik KS. The neuronal microRNA system. Nat Rev Neurosci 2006;7:911–920. [DOI] [PubMed] [Google Scholar]
- 7. Schratt GM, Tuebing F, Nigh EA, et al. A brain‐specific microRNA regulates dendritic spine development. Nature 2006;439:283–289. [DOI] [PubMed] [Google Scholar]
- 8. Wang Y, Wang Y, Yang GY. MicroRNAs in Cerebral Ischemia. Stroke Res Treat 2013;2013:276540. [DOI] [PMC free article] [PubMed] [Google Scholar]
- 9. Jeyaseelan K, Lim KY, Armugam A. MicroRNA expression in the blood and brain of rats subjected to transient focal ischemia by middle cerebral artery occlusion. Stroke 2008;39:959–966. [DOI] [PubMed] [Google Scholar]
- 10. Sepramaniam S, Armugam A, Lim KY, et al. MicroRNA 320a functions as a novel endogenous modulator of aquaporins 1 and 4 as well as a potential therapeutic target in cerebral ischemia. J Biol Chem 2010;285:29223–29230. [DOI] [PMC free article] [PubMed] [Google Scholar]
- 11. Tan KS, Armugam A, Sepramaniam S, et al. Expression profile of MicroRNAs in young stroke patients. PLoS ONE 2009;4:e7689. [DOI] [PMC free article] [PubMed] [Google Scholar]
- 12. Lim KY, Chua JH, Tan JR, et al. MicroRNAs in Cerebral Ischemia. Transl Stroke Res 2010;1:287–303. [DOI] [PubMed] [Google Scholar]
- 13. Liu XS, Chopp M, Zhang RL, Zhang ZG. MicroRNAs in cerebral ischemia‐induced neurogenesis. J Neuropathol Exp Neurol 2013;72:718–722. [DOI] [PMC free article] [PubMed] [Google Scholar]
- 14. Liu DZ, Tian Y, Ander BP, et al. Brain and blood microRNA expression profiling of ischemic stroke, intracerebral hemorrhage, and kainate seizures. J Cereb Blood Flow Metab 2010;30:92–101. [DOI] [PMC free article] [PubMed] [Google Scholar]
- 15. He X, Li Y, Lu H, Zhang Z, Wang Y, Yang GY. Netrin‐1 overexpression promotes white matter repairing and remodeling after focal cerebral ischemia in mice. J Cereb Blood Flow Metab 2013;33:1921–1927. [DOI] [PMC free article] [PubMed] [Google Scholar]
- 16. Lu H, Wang Y, He X, et al. Netrin‐1 hyperexpression in mouse brain promotes angiogenesis and long‐term neurological recovery after transient focal ischemia. Stroke 2012;43:838–843. [DOI] [PubMed] [Google Scholar]
- 17. Roush S, Slack FJ. The let‐7 family of microRNAs. Trends Cell Biol 2008;18:505–516. [DOI] [PubMed] [Google Scholar]
- 18. Su JL, Chen PS, Johansson G, Kuo ML. Function and regulation of let‐7 family microRNAs. Microrna 2012;1:34–39. [DOI] [PubMed] [Google Scholar]
- 19. Yin R, Bao W, Xing Y, Xi T, Gou S. MiR‐19b‐1 inhibits angiogenesis by blocking cell cycle progression of endothelial cells. Biochem Biophys Res Commun 2012;417:771–776. [DOI] [PubMed] [Google Scholar]
- 20. Pulkkinen K, Malm T, Turunen M, Koistinaho J, Yla‐Herttuala S. Hypoxia induces microRNA miR‐210 in vitro and in vivo ephrin‐A3 and neuronal pentraxin 1 are potentially regulated by miR‐210. FEBS Lett 2008;582:2397–2401. [DOI] [PubMed] [Google Scholar]
- 21. Suarez Y, Fernandez‐Hernando C. New insights into microRNA‐29 regulation: a new key player in cardiovascular disease. J Mol Cell Cardiol 2012;52:584–586. [DOI] [PubMed] [Google Scholar]
- 22. Zeng L, Liu J, Wang Y, et al. MicroRNA‐210 as a novel blood biomarker in acute cerebral ischemia. Front Biosci (Elite Ed) 2011;3:1265–1272. [DOI] [PubMed] [Google Scholar]
- 23. Zeng L, He X, Wang Y, et al. MicroRNA‐210 overexpression induces angiogenesis and neurogenesis in the normal adult mouse brain. Gene Ther 2014;21:37–43. [DOI] [PubMed] [Google Scholar]
- 24. Zhang ZG, Chopp M. Neurorestorative therapies for stroke: underlying mechanisms and translation to the clinic. Lancet Neurol 2009;8:491–500. [DOI] [PMC free article] [PubMed] [Google Scholar]
- 25. Yang J, Harte‐Hargrove LC, Siao CJ, et al. proBDNF negatively regulates neuronal remodeling, synaptic transmission, and synaptic plasticity in hippocampus. Cell Rep 2014;7:796–806. [DOI] [PMC free article] [PubMed] [Google Scholar]
- 26. Cao W, Duan J, Wang X, et al. Early enriched environment induces an increased conversion of proBDNF to BDNF in the adult rat's hippocampus. Behav Brain Res 2014;265:76–83. [DOI] [PubMed] [Google Scholar]
- 27. Chen Z, Li Y, Zhang H, Huang P, Luthra R. Hypoxia‐regulated microRNA‐210 modulates mitochondrial function and decreases ISCU and COX10 expression. Oncogene 2010;29:4362–4368. [DOI] [PubMed] [Google Scholar]
- 28. Zhao M, Wang LT, Liang GP, et al. Up‐regulation of microRNA‐210 induces immune dysfunction via targeting FOXP3 in CD4(+) T cells of psoriasis vulgaris. Clin Immunol 2014;150:22–30. [DOI] [PubMed] [Google Scholar]
- 29. Qiu J, Zhou XY, Zhou XG, Cheng R, Liu HY, Li Y. Neuroprotective effects of microRNA‐210 on hypoxic‐ischemic encephalopathy. Biomed Res Int 2013;2013:350419. [DOI] [PMC free article] [PubMed] [Google Scholar]
Associated Data
This section collects any data citations, data availability statements, or supplementary materials included in this article.
Supplementary Materials
Table S1. sCBF after MCAO in all groups.
Table S2. Clinical characteristic of study subjects.