Summary
Aims
To explore the expression, methylation pattern, the prognostic value, and the biological consequences of CAMKK2 in gliomas.
Methods
The expression and methylation pattern of CAMKK2 was inferred and validated from mRNA expression profile (N = 866) and methylation profile (N = 426) of glioma tissue samples, and independent samples were used for further validation by IHC and pyrosequencing. To explore the function of CAMKK2 in gliomas, in vitro studies, colony formation assays and migration and invasion assays were performed.
Results
We found the upregulation of CAMKK2 in high‐grade glioma samples was associated with promoter hypomethylation. An elevated expression of CAMKK2 was associated with worse prognosis. By in vitro assays, we demonstrated that CAMKK2 could promote cell migration, invasion, and proliferation.
Conclusions
The expression level of CAMKK2 could be regulated by promoter methylation. CAMKK2 serves as a prognostic marker in gliomas and could be a potential therapeutic target in gliomas.
Keywords: CAMKK2, Glioma, Prognosis, Progression
Introduction
Gliomas account for the vast majority of adult malignant brain tumors that are divided into four histopathologic grades based on the degree of malignancy according to the World Health Organization (WHO) classification scheme 1, 2. Defined molecular aberrations (molecular classifications, gene mutations) are needed to supply the current morphology‐based classification 3, 4, 5, 6, 7. This might help resolve the discrepancy between classification and clinical outcome 8, 9. Thus, great efforts have been spent on the identification and validation of novel biomarkers to help diagnosis, therapy response evaluation, and prognosis prediction.
Calcium/calmodulin‐dependent protein kinase kinase 2, beta (CAMKK2) has its strongest expression in the brain and influences learning, memory, neuronal differentiation, migration, neurite outgrowth, and synapse formation 10. It has been reported to be an important potential therapeutic target in hepatic cancer 11, prostate cancer 10, 12, etc. But the biological roles of CAMKK2 in gliomas have not been investigated yet.
The published microarray data from the Chinese Glioma Genome Atlas (CGGA) and the Cancer Genome Atlas (TCGA) have provided us with perfect resources to study the expression and methylation patterns of markers in gliomas. In this study, we identified and validated the expression and methylation differences of CAMKK2 in those data as well as in external validation tissue samples. After inferring from co‐expressed genes, we also validated the biological consequences of CAMKK2 by in vitro assays. CAMKK2, regulated by promoter methylation, was proved to act as an unfavorable prognostic marker by promoting migration, invasion, and proliferation in gliomas.
Materials and Methods
Microarray Data of Glioma Samples
Whole genome mRNA expression microarray data of 305 diffuse glioma samples and methylation microarray data of 151 diffuse glioma samples were downloaded from CGGA database 4 (http://www.cgga.org.cn). The mRNA expression microarray data of 561 GBM samples and methylation microarray data of 275 GBM samples were downloaded from TCGA database (http://cancergenome.nih.gov).
Human Glioma Tissue Samples
Human glioma (N = 147 for expression validation and N = 101 for methylation validation) and normal brain tissue samples (N = 5 for expression validation) were obtained from the Second Affiliated Hospital of Harbin Medical University. All tissues were snap‐frozen in liquid nitrogen within 30 min after resection until DNA extraction or paraffin embedding. The study was approved by the Ethics Committee of the hospital, and written informed consent was obtained from all participants. All samples were histologically classified and graded according to WHO guidelines by two clinical pathologists 1.
Immunohistochemistry (IHC)
Immunoperoxidase staining for CAMKK2 (Abcam, ab96531, Cambridge, MA, USA) was performed following the standard protocol recommended by the manufacturer. Each slide was individually reviewed and scored by two independent observers. Approximately 15–20 fields at 400× magnification were analyzed per specimen. The expression level of CAMKK2 was graded as previously reported 13. In brief, the proportion of positively stained tumor cells was graded as: 0, no positive tumor cells; 1, <5% positive tumor cells; 2, 5–20% positive tumor cells; and 3, >20% positive tumor cells. The intensity of staining was graded as 0 (no staining), 1 (weak staining, light yellow), 2 (moderate staining, yellowish brown), and 3 (strong staining, brown). The staining index was the product of staining intensity multiplied by proportion grade. High CAMKK2 expression was defined as a staining index ≥4, while low expression was defined as a staining index <4.
Pyrosequencing
Genomic DNA was isolated from frozen tumor tissues using the QIAamp DNA Mini Kit (Qiagen, Germantown, MD, USA) according to the manufacturer's protocol. DNA concentration and quality were measured using the NanoDrop ND‐1000 spectrophotometer (NanoDrop Technologies, Houston, TX, USA). As previously reported 14, pyrosequencing of CAMKK2 promoter region was performed using the PyroMark Q96 ID System (QIAGEN) according to the manufacturer's protocol. Bisulfite modification of the DNA was performed using the EpiTect Kit (Qiagen). The samples were considered to be promoter methylated with an average methylation of >10%.
Cell Culture
Human glioma cell line U87 was cultured as previously reported 15. In brief, DMEM medium (Hyclone, Pittsburgh, PA, USA) supplemented with 10% fetal bovine serum (FBS, Hyclone), 100 units of penicillin/mL (Hyclone), and 100 ng of streptomycin/mL (Hyclone) was used. The cell line was incubated at 37°C in an atmosphere of 5% CO2.
miRNA Oligo and Cell Transfection
As previously reported 16, CAMKK2‐specific siRNA duplexes and nonsilencing control sequence were purchased from Santa Cruz Biotechnology Inc (Dallas, TX, USA). Transfection was performed with lipofectamine (Invitrogen, Carlsbad, CA, USA) according to the manufacturer's instructions.
Western Blotting
Western blot was performed as previously described 17. Anti‐CAMKK2 antibody (Abcam, ab96531) was used as the primary antibody, and secondary antibody was HRP‐conjugated antirabbit IgG (ORIGENE, Beijing, China). Equal protein loading was assessed by the expression of GAPDH. The Western blots were visualized by chemiluminescence (ECL) reagents (Thermo, Carlsbad, CA, USA) and Bio‐Rad ChemiDoc XRS+ system (Bio‐Rad, Hercules, CA, USA).
Colony Formation Assay
Colony formation assay was used to assess the capability of cell colony growth. The glioma cell line U87 was collected after siCAMKK2 or negative control transfection, and 200 cells were seeded into the six‐well plates for 2 weeks. After that, the colonies were fixed with methanol for 10 min and stained with 1% crystal violet (Sigma, St. Louis, MO, USA) for 1 min.
Migration and Invasion Assays
Transwell chamber assay was used to assess the migration and invasion ability of tumor cells after transfected with siCAMKK2 RNA or nonsilencing control sequence. For invasion assays, 3 × 10⁴ cells were seeded on the transwell insert coated (BD, Franklin Lakes, NJ, USA) with extracellular matrix, while cell migration assay did coat (Costar, Corning, CA, USA) without ECM. After 24‐h incubation, cells which were adherent to the upper surface of the filter were removed and stained with crystal violet (Sigma).
Statistical Analysis
For quantitative data (microarray data, cell count, etc.), the difference was tested by unpaired student's t‐test. For IHC and pyrosequencing validation data, the difference was tested by chi‐square test. For survival analysis, the overall survival time was defined as the time interval between histological diagnosis and death or last follow‐up. The survival curves were plotted by Kaplan–Meier method with log‐rank test. Pearson correlation analysis was used to find out genes correlated with CAMKK2 in mRNA expression microarray data. Gene ontology (GO) was performed in DAVID 18 (http://david.abcc.ncifcrf.gov/home.jsp). The P values were all presented for a two‐sided test, and P < 0.05 was considered as statistically significant. All the analyses were performed in R 3.2.1 (https://www.r-project.org/) or GraphPad Prism 6.0 for Windows.
Results
CAMKK2 is Differentially Expressed between Low‐ and High‐Grade Gliomas
The mRNA expression microarray data of 305 glioma samples from CGGA were included in this study. There were 126 low‐grade glioma samples (LGG, WHO grade II) and 179 high‐grade glioma samples (HGG, WHO grade III–IV). CAMKK2 was differentially expressed between LGG and HGG (t‐test, P < 0.0001, Figure 1A). To validate the expression pattern of CAMKK2, we further tested the protein expression level in an independent cohort of 147 WHO grade II–IV glioma samples (LGG, n = 48; HGG, n = 99), and five normal brain tissues from our hospital by IHC. CAMKK2 had a significantly higher expression in HGG (chi‐square test, P < 0.0001, Figure 1B, C).
Figure 1.
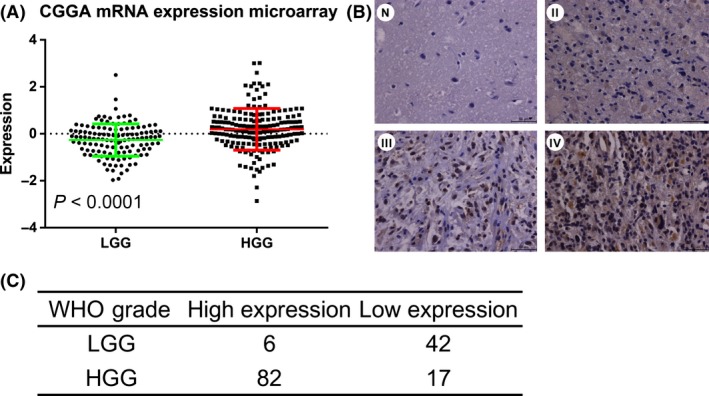
Expression pattern of CAMKK2 in WHO grade II–IV gliomas. (A) CAMKK2 was differently expressed between LGG and HGG samples in CGGA mRNA expression microarray data (t‐test, P < 0.0001). (B) Representative CAMKK2 staining results by IHC. CAMKK2 showed a higher expression in higher‐grade samples. (C) Statistical result of CAMKK2 IHC staining. CAMKK2 showed a higher expression in HGG samples (chi‐square test, P < 0.0001). LGG, low‐grade glioma (WHO grade II); HGG, high‐grade glioma (WHO grade III–IV); N, normal brain tissue; II, WHO grade II; III, WHO grade III; IV, WHO grade IV.
CAMKK2 is Differentially Methylated between Low‐ and High‐Grade Gliomas
The methylation microarray data of 151 glioma samples from CGGA were downloaded from CGGA website. There were 65 LGG samples and 86 HGG samples. CAMKK2 was differentially methylated between LGG and HGG (t‐test, P < 0.0001, Figure 2A). To validate the methylation status of CAMKK2, we further examined the methylation level of CAMKK2 promoter in an independent of 101 WHO grade II–IV glioma samples (LGG, n = 35; HGG, n = 66) from our hospital by pyrosequencing. CAMKK2 promoters were hypermethylated in LGG (chi‐square test, P < 0.0001, Figure 2B, C).
Figure 2.
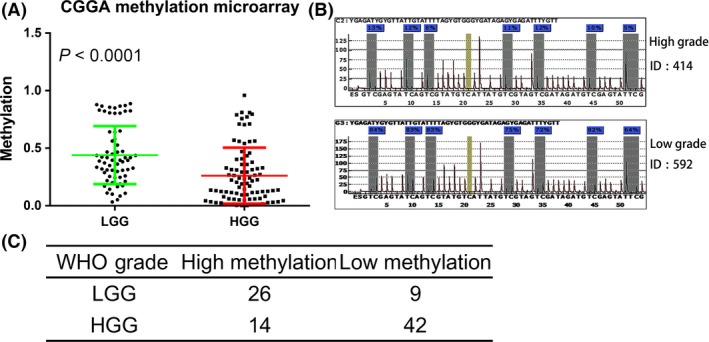
Methylation pattern of CAMKK2 in WHO grade II–IV gliomas. (A) CAMKK2 was differently methylated between LGG and HGG samples in CGGA methylation microarray data (t‐test, P < 0.0001). (B) Representative CAMKK promoter methylation results by pyrosequencing. (C) Statistical result of CAMKK2 promoter methylation by pyrosequencing. CAMKK2 was hyper methylated in LGG samples(chi‐square test, P < 0.0001). LGG, low‐grade glioma (WHO grade II); HGG, high‐grade glioma (WHO grade III–IV).
CAMKK2 is a Prognostic Marker in Gliomas
The 126 LGG samples with mRNA expression microarray data were divided into low CAMKK2 group (L) and high CAMKK2 group (H) according to the median expression level of CAMKK2. Patients with low CAMKK2 expression had a better overall survival (log‐rank test, P = 0.0126, Figure 3A). The 305 glioma samples were likewise divided into L group and H group. CAMKK2 showed similar prognostic value in those patients (median survival: L, not reached, median follow‐up 1091 days; H, 826 days. Log‐rank test, P = 0.0115, Figure 3B). To minimize the interaction of WHO grade and CAMKK2 expression, we further downloaded mRNA expression microarray data of 561 GBM samples along with survival data from TCGA website. Patients with low CAMKK2 expression showed better overall survival (log‐rank test, P = 0.0469, Figure 3C).
Figure 3.
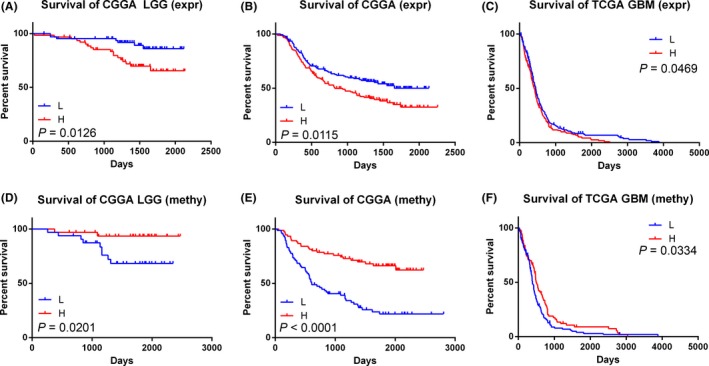
Prognostic value of CAMKK2 in WHO grade II–IV gliomas. (A) CAMKK2 highly expressed samples showed poorer overall survival in CGGA LGG (P = 0.0126), (B) WHO grade II–IV gliomas (P = 0.0115), and in (C)TCGA GBM (WHO grade IV, P = 0.0469) samples. CAMKK2 hyper methylated samples showed better overall survival in (D) CGGA LGG (P = 0.0201), (E) WHO grade II–IV gliomas (P < 0.0001), and in (F)TCGA GBM (WHO grade IV, P = 0.0334) samples. expr, expression; methy, methylation; L, low expression or low methylation; H, high expression or high methylation.
As CAMKK2 expression could significantly silenced by promoter methylation, we also investigated the prognostic value of CAMKK2 promoter methylation levels. The LGG samples from CGGA database, grouped by CAMKK2 methylation status, showed distinct prognosis: patients with high expression levels showed better overall survival (log‐rank test, P = 0.0201, Figure 3D). This held true in all the samples with methylation microarray data from CGGA database (n = 151, median survival: L, 605 days; H, not reached, median follow‐up 1638 days, Figure 3E). To further validate the prognostic value of CAMKK2 methylation levels, we also downloaded methylation microarray data of 275 GBM samples from TCGA database. The GBM patients with high CAMKK2 methylation levels possessed better overall survival (log‐rank test, P = 0.0334, Figure 3F).
Functional Annotation of CAMKK2 in Glioma Datasets
To annotate the functions of CAMKK2 in gliomas, we performed Pearson's correlation analysis to find out the significantly correlated genes in CGGA mRNA expression microarray data. There were 438 probes (426 genes) positively correlated (r > 0.5, P < 0.01) and 686 probes negatively correlated (r < −0.5, P < 0.01, Figure 4A, Supplementary Table S1). GO analysis was used to annotate the genes. Of the 426 positively correlated genes, 80 were associated with transcription and 15 genes were correlated with migration (Supplementary Table S2). GSEA was further used to annotate the functional roles of CAMKK2 in gliomas. By applying gene signatures derived from MSigDB, patients with high CAMKK2 expression showed significant enrichment of cell cycle and proliferation‐associated gene sets (Figure 4B, C).
Figure 4.
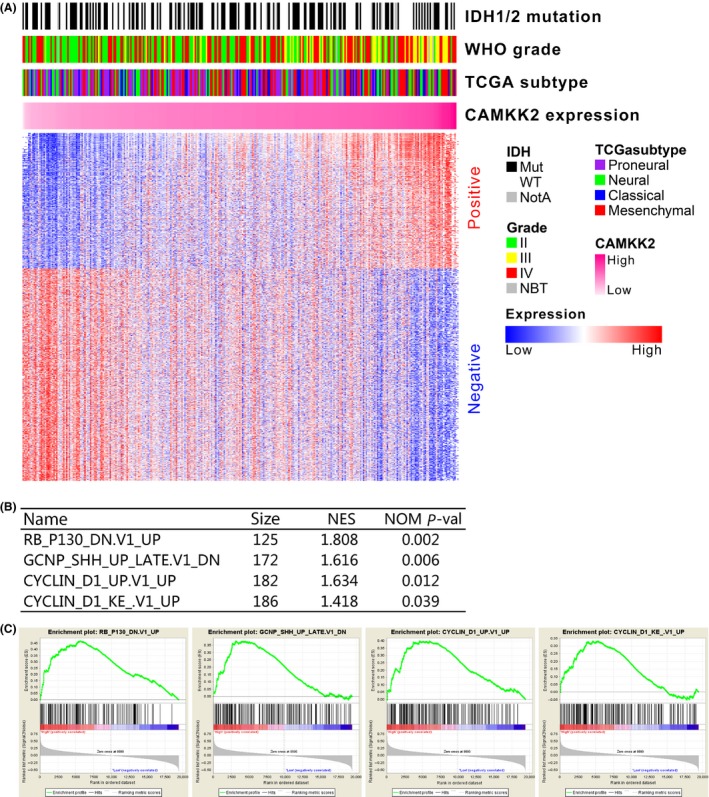
Functional annotation of CAMKK2 in glioma datasets. (A) Genes significantly correlated with CAMKK2 (Pearson correlation, |r| > 0.5, P < 0.01), and the corresponding clinicopathological factors (WHO grade, TCGA subtype and IDH1/2 mutation) were summarized. (B and C) Gene set enrichment analysis revealed that CAMKK2 high‐expressed samples showed significant enrichments of cell cycle or proliferation‐associated gene sets (Gene sets downloaded from MSigDB database). NES, normalized enrichment score; NOM P‐val, nominal P value.
CAMKK2 Promotes Migration, Invasion, and Proliferation In Vitro
To further evaluate the biological roles of CAMKK2 in gliomas, we next transfected CAMKK2‐specific siRNA duplexes or nonsilencing control sequence into glioma cell line U87 and performed in vitro assays on migration, invasion, and proliferation. After transfection, Western blot assays showed that the siCAMKK2 transfected cell lines had a significant lower expression of CAMKK2 (P < 0.01, Figure 5A, B), compared with control cells. The results of transwell and invasion assays showed that downregulation of CAMKK2 inhibited cell migration and invasion (Figure 5C, D). Moreover, the results of colony formation assays showed that siCAMKK2 transfected U87 cells formed much smaller and fewer colonies than control cells. These results indicated that the knockdown of CAMKK2 could inhibit cell migration, invasion, and proliferation.
Figure 5.
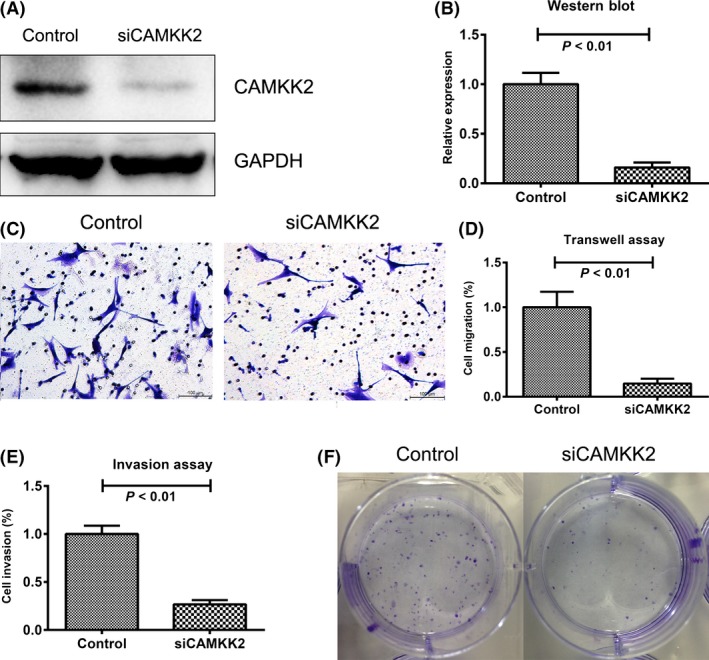
CAMKK2 promotes migration, invasion, and proliferation in vitro. (A and B) CAMKK2 was significantly downregulated by siRNA (GAPDH was loaded as control, t‐test, P < 0.01). (C and D) The migration capacity of cells was determined by transwell assay, where the siCAMKK2 cells showed lower migration capacity (t‐test, P < 0.01). (E) The invasion capacity of cells was determined by invasion assay, where the siCAMKK2 cells showed lower invasion capacity (t‐test, P < 0.01). (F) Colony formation assays showed that siCAMKK2 cells formed smaller and fewer colonies.
Discussion
The present datasets from CGGA and TCGA on histologically diagnosed diffuse glioma with extensive follow‐up data show the power of high throughput microarray data for the identification and validation of biomarkers. CAMKK2 was highly expressed and hypomethylated in HGG samples and acted as an unfavorable prognostic marker in the two dataset. The results above were also validated in external validation tissue samples. Although it has not been fully investigated in gliomas, CAMKK2 has been reported to be upregulated in advanced clinical stage of prostate cancer 10, gastric adenocarcinoma 19, and hepatic cancer 11. CAMKK2 is an important regulator of energy balance, cellular differentiation, and inflammation 20. Signaling of Ca2+ is a well‐known determinant for regulating translation, but the precise mechanism by which Ca2+ regulates this pathway has remained undefined 11.
About the biological roles of CAMKK2 in cancers, the proliferation of cancer (like gastric adenocarcinoma) cell lines could be inhibited by siRNA of CAMKK2 19. Similarly, in this study, silencing of CAMKK2 using siRNA significantly reduced cell migration, invasion, and proliferation. CAMKK2 has been reported to act upstream of AMP‐activated protein kinase (AMPK), which play a role in calcium‐mediated signal transduction pathways 21. AMPK is a critical energy‐balancing sensor in the regulation of cellular metabolism in response to external stimuli. Emerging studies have suggested that AMPK is a potential therapeutic target for human cancers 22. AMPK is phosphorylated and activated by upstream factors in response to increasing AMP/ATP ratios, which occur in a variety of settings including hypoxia, nutrient starvation, and redox imbalance 23. AMPK, a potential target for cancer therapy, is linked to the development and maintenance of the malignant phenotype of cancers 24. Meanwhile, CAMKK2 has been reported to play a role in protein synthesis by regulating S6K and S6. The mTOR/S6K/S6 protein synthesis pathway is a well‐acknowledged oncogenic signaling cascade routinely hijacked by cancer cells 25.
Taken together, in this study, we found out that CAMKK2 in upregulated in HGG by promoter hypomethylation both in silico and in tissue samples. It played as an unfavorable prognostic marker in gliomas. We also demonstrated that CAMKK2 could induce a malignant phenotype by promoting migration, invasion, and proliferation by in vitro assays. In clinical practice, testing the expression and methylation levels of CAMKK2 may contribute to the diagnosis and treatment of glioma patients. These results also suggested that CAMKK2 could be a potential therapeutic target in gliomas.
Conflict of Interest
The authors declare no conflict of interest.
Supporting information
Table S1. CAMKK2 correlated genes (¦r¦ > 0.5, P < 0.01).
Table S2. Genes positively correlated with CAMKK2 expression and associated with transcription and migration.
Acknowledgments
This research was supported by grants from the Health and Family Planning Commission Research Project of Heilongjiang province (NO. 2014‐329, 2014‐401), National Natural Science Foundation of China (No. 81502494), Postdoctoral Fund of Heilongjiang province government (LRB14‐422).
References
- 1. Louis DN, Ohgaki H, Wiestler OD, et al. The 2007 WHO classification of tumours of the central nervous system. Acta Neuropathol 2007;114:97–109. [DOI] [PMC free article] [PubMed] [Google Scholar]
- 2. Wang Y, Jiang T. Understanding high grade glioma: Molecular mechanism, therapy and comprehensive management. Cancer Lett 2013;331:139–146. [DOI] [PubMed] [Google Scholar]
- 3. Cancer Genome Atlas Research, N . Comprehensive genomic characterization defines human glioblastoma genes and core pathways. Nature 2008;455:1061–1068. [DOI] [PMC free article] [PubMed] [Google Scholar]
- 4. Yan W, Zhang W, You G, et al. Molecular classification of gliomas based on whole genome gene expression: A systematic report of 225 samples from the Chinese Glioma Cooperative Group. Neuro Oncol 2012;14:1432–1440. [DOI] [PMC free article] [PubMed] [Google Scholar]
- 5. Cai J, Yang P, Zhang C, et al. ATRX mRNA expression combined with IDH1/2 mutational status and Ki‐67 expression refines the molecular classification of astrocytic tumors: Evidence from the whole transcriptome sequencing of 169 samples samples. Oncotarget 2014;5:2551–2561. [DOI] [PMC free article] [PubMed] [Google Scholar]
- 6. Sun Y, Zhang W, Chen D, et al. A glioma classification scheme based on coexpression modules of EGFR and PDGFRA. Proc Natl Acad Sci USA 2014;111:3538–3543. [DOI] [PMC free article] [PubMed] [Google Scholar]
- 7. Brennan CW, Verhaak RG, McKenna A, et al. The somatic genomic landscape of glioblastoma. Cell 2013;155:462–477. [DOI] [PMC free article] [PubMed] [Google Scholar]
- 8. Dubbink HJ, Atmodimedjo PN, Kros JM, et al., Molecular classification of anaplastic oligodendroglioma using next‐generation sequencing: A report of the prospective randomized EORTC Brain Tumor Group 26951 phase III trial. Neuro Oncol 2016;18:388–400. [DOI] [PMC free article] [PubMed] [Google Scholar]
- 9. van den Bent MJ. Interobserver variation of the histopathological diagnosis in clinical trials on glioma: A clinician's perspective. Acta Neuropathol 2010;120:297–304. [DOI] [PMC free article] [PubMed] [Google Scholar]
- 10. Fu H, He HC, Han ZD, et al. MicroRNA‐224 and its target CAMKK2 synergistically influence tumor progression and patient prognosis in prostate cancer. Tumour Biol 2015;36:1983–1991. [DOI] [PubMed] [Google Scholar]
- 11. Lin F, Marcelo KL, Rajapakshe K, et al. The camKK2/camKIV relay is an essential regulator of hepatic cancer. Hepatology 2015;62:505–520. [DOI] [PMC free article] [PubMed] [Google Scholar]
- 12. Popovics P, Frigo DE, Schally AV, Rick FG. Targeting the 5′‐AMP‐activated protein kinase and related metabolic pathways for the treatment of prostate cancer. Expert Opin Ther Targets 2015;19:617–632. [DOI] [PubMed] [Google Scholar]
- 13. Bao Z, Zhang C, Yan W, et al. BMP4, a strong better prognosis predictor, has a subtype preference and cell development association in gliomas. J Transl Med 2013;11:100. [DOI] [PMC free article] [PubMed] [Google Scholar]
- 14. Zhang W, Yan W, You G, et al. Genome‐wide DNA methylation profiling identifies ALDH1A3 promoter methylation as a prognostic predictor in G‐CIMP‐ primary glioblastoma. Cancer Lett 2013;328:120–125. [DOI] [PubMed] [Google Scholar]
- 15. Guo T, Feng Y, Liu Q, et al. MicroRNA‐320a suppresses in GBM patients and modulates glioma cell functions by targeting IGF‐1R. Tumour Biol 2014;35:11269–11275. [DOI] [PubMed] [Google Scholar]
- 16. Zhang J, Xie Z, Dong Y, Wang S, Liu C, Zou MH. Identification of nitric oxide as an endogenous activator of the AMP‐activated protein kinase in vascular endothelial cells. J Biol Chem 2008;283:27452–27461. [DOI] [PMC free article] [PubMed] [Google Scholar] [Retracted]
- 17. Kim JK, Jin X, Ham SW, et al. IRF7 promotes glioma cell invasion by inhibiting AGO2 expression. Tumour Biol 2015;36:5561–5569. [DOI] [PubMed] [Google Scholar]
- 18. da Huang W, Sherman BT, Lempicki RA. Systematic and integrative analysis of large gene lists using DAVID bioinformatics resources. Nat Protoc 2009;4:44–57. [DOI] [PubMed] [Google Scholar]
- 19. Subbannayya Y, Syed N, Barbhuiya MA, et al. Calcium calmodulin dependent kinase kinase 2 – a novel therapeutic target for gastric adenocarcinoma. Cancer Biol Ther 2015;16:336–345. [DOI] [PMC free article] [PubMed] [Google Scholar]
- 20. Racioppi L, Means AR. Calcium/calmodulin‐dependent protein kinase kinase 2: Roles in signaling and pathophysiology. J Biol Chem 2012;287:31658–31665. [DOI] [PMC free article] [PubMed] [Google Scholar]
- 21. Woods A, Dickerson K, Heath R, et al. Ca2+/calmodulin‐dependent protein kinase kinase‐beta acts upstream of AMP‐activated protein kinase in mammalian cells. Cell Metab 2005;2:21–33. [DOI] [PubMed] [Google Scholar]
- 22. Yu SY, Chan DW, Liu VW, Ngan HY. Inhibition of cervical cancer cell growth through activation of upstream kinases of AMP‐activated protein kinase. Tumour Biol 2009;30:80–85. [DOI] [PubMed] [Google Scholar]
- 23. Kuhajda FP. AMP‐activated protein kinase and human cancer: Cancer metabolism revisited. Int J Obes (Lond) 2008;32(Suppl 4):S36–S41. [DOI] [PMC free article] [PubMed] [Google Scholar]
- 24. Kuhajda FP, Jenner K, Wood FD, et al. Fatty acid synthesis: A potential selective target for antineoplastic therapy. Proc Natl Acad Sci USA 1994;91:6379–6383. [DOI] [PMC free article] [PubMed] [Google Scholar]
- 25. Zoncu R, Efeyan A, Sabatini DM. mTOR: From growth signal integration to cancer, diabetes and ageing. Nat Rev Mol Cell Biol 2011;12:21–35. [DOI] [PMC free article] [PubMed] [Google Scholar]
Associated Data
This section collects any data citations, data availability statements, or supplementary materials included in this article.
Supplementary Materials
Table S1. CAMKK2 correlated genes (¦r¦ > 0.5, P < 0.01).
Table S2. Genes positively correlated with CAMKK2 expression and associated with transcription and migration.


