

Summary
Aims
This study explored sFasL expression in neurons and the potential role of neuronal sFasL in modulating the microglial phenotypes.
Methods
In vivo, middle cerebral artery occlusion (MCAO) was induced in both FasL‐mutant (gld) and wild‐type (wt) mice. In vitro, primary cortical neuron or microglia or coculture from wt/gld mice was subjected to oxygen glucose deprivation (OGD). sFasL level in the supernatant was evaluated by ELISA. Neuronal‐conditioned medium (NCM) or exogenous sFasL was applied to primary microglia with or without FasL neutralizing antibody. Protein expression of JAK2/STAT3 and NF‐κB pathways were determined by Western blot. The effect of microglia phenotype from wt/gld mice on the fate of ischemic neurons was further elucidated.
Results
In vivo, compared with wild‐type mice, M1 markers (CD16, CD32 and iNOS) were attenuated in gld mice after MCAO. In vitro, post‐OGD neuron released more sFasL. Both post‐OGD NCM and exogenous sFasL could trigger M1‐microglial polarization. However, this M1 phenotype shift was partially blocked by utilization of FasL neutralizing antibody or gld NCM. Consistently, JAK2/STAT3 and NF‐κB signal pathways were both activated in microglia after exogenous sFasL treatment. Compared with wild‐type mice, M1‐conditioned medium prepared from gld mice protected neuron against OGD injury.
Conclusions
Ischemic neurons release sFasL, which contributes to M1‐microglial polarization. The underlying mechanisms may involve the activation of JAK2/STAT3 and NF‐κB signaling pathways.
Keywords: Inflammation, Ischemic stroke, Microglia, Neuron, Soluble FasL
Introduction
After heart disease, stroke is the second leading cause of death worldwide and is a major cause of adult disability 1, 2. Ischemic stroke, the most common type, accounts for approximately 85% of acute cerebral vascular diseases 1. Inflammation occurs throughout the progression of cerebral ischemia/reperfusion and appears to play important roles in the pathogenic process 3. At early stages, inflammation may amplify ischemic injury, but set the stage for tissue repair in later periods 4, which is related to the different phenotypes and functions of microglia. Microglia respond by switching from a surveillance state to various types of activated phenotypes, referred to as classical activation phenotypes (M1) typically releasing pro‐inflammatory mediators, and alternative activation phenotypes (M2), which possess antiinflammatory properties 5. However, the underlying mechanisms of how microglia to shift phenotypes after ischemia are largely unknown.
It is well known that microglia constitute the first line of immune defense in the brain, neurons also have the ability to sense changes in the brain, contributing to maintenance of CNS‐homeostasis in the normal condition 6. Substantial evidence shows that neurons can control microglia by both contact‐dependent and contact‐independent mechanisms 7. Healthy neurons produce calming signals preventing inappropriate microglial activation. However, in some pathological conditions, such as ischemia and trauma, the interactions between neurons and microglia are disturbed 7.
Fas ligand (FasL) is a member of the TNF protein family and exists in two distinct forms: a membrane‐bound form (mFasL) and a soluble form (sFasL) generated from the cleavage of membranous molecules by matrix metalloproteinases 8. Although mFasL is a primary mediator of apoptosis, emerging evidence suggests sFasL is chemotactic and is characterized by a pro‐inflammatory, instead of apoptosis‐related function 9, 10. Mice with FasL mutant (gld) or inhibition of FasL activity with neutralizing antibody treatment is neuroprotective and reduce inflammatory cell infiltration in experimental stroke models 11, 12. In our previous study, we revealed gld mice attenuate the recruitment of neutrophil and inhibit the microglial activation after ischemia, which might involve the decreased sFasL expression compared to wild‐type mice 12. However, little is known about the effect of sFasL in the phenotypes and functions of activated microglia and its role in regulation of interactions between neuron and microglia.
In this study, we explored the polarization of microglia in FasL‐mutant (gld) mice and the involvement of neuronal sFasL in modulating microglial polarization after ischemia. The effect of M1/M2‐conditioned medium from wt/gld mice on the fate of ischemic neurons was also elucidated. In addition, the potential mechanisms of sFasL in triggering JAK2/STAT3 and NF‐κB signal transduction pathways were demonstrated in this study.
Materials and Methods
Middle Cerebral Artery Occlusion Model in Mice
The wild‐type control C57BL/6J (wild‐type) and FasL‐mutant (gld) mice (12–14 weeks, 22–24 g, male) were obtained from the Animal Model Center of Nanjing University, in Nanjing, China. For transient middle cerebral artery occlusion (MCAO), intraluminal filament technique was utilized for 60 min as previously described 13. Animals were included if regional cerebral blood flow was below 30% of baseline. Sham‐operated mice underwent the same surgery except the MCAO filament inducement.
Cortical Neuronal Culture
Embryonic cortical neuronal cultures were prepared from 16‐day‐old C57/BL6J or gld mice embryos as previously described 14. The purity of neuronal cultures was more than 90%, as determined by immunocytochemical staining using an antibody against microtubule‐associated protein‐2 (MAP‐2).
Primary Microglia Cells Culture and Microglial‐Conditioned Medium Preparation
Primary microglia cells were isolated from glia cultures prepared from newborn C57/BL6J or gld mice <48 h old as described previously 15. Microglia cells were collected directly from the mixed glia cells when most of them floating in the medium (10–12 days after initial seeding) and seeded into 6‐ or 24‐well plates at a density of 5 × 10⁵ cells/mL for 2–3 days. The purity of the primary microglia cells was more than 95% as determined by Iba‐1 immunocytochemical staining. Lipopolysaccharide (LPS, 100 ng/mL) and IFN‐γ (20 ng/mL) were added to medium for 48 h for M1 induction. In contrast, for M2 induction, IL‐4 (20 ng/mL) was applied. The M1 or M2 microglial‐conditioned medium was then collected and stimulated post‐oxygen glucose deprivation (OGD) neurons in 96‐well plates for indicated times. Neurotoxicity and cell viability were assessed by propidium iodide (Sigma, St. Louis, MO, USA) and calcein AM staining (Molecular, Houston, TX, USA), lactate dehydrogenase (LDH) assay (Beyotime Biotech, Nantong, China), and conventional 3‐[4,5‐diethylthiazol‐2yl]‐2,5‐diphenyltetrazolium bromide (MTT) assay following the manufacturers' protocols.
Neuron–Microglia Cocultures
To generate neuron–microglia cocultures, embryonic cortical neurons were cultured in 12‐well plates (1 × 10⁶ cells/mL) for about 7 days. Primary microglia (1 × 10⁵ cells/mL) were then seeded and cultured together with neurons in the culture medium (minimum essential medium containing 10% FBS, 2 mmol/L l‐glutamine, 1 mmol/L sodium pyruvate, and 100 μM/L nonessential amino acids). After 3 days, the coculture system was subjected to OGD treatment.
OGD of Cells and Neuronal‐Conditioned Medium Preparation
Oxygen glucose deprivation was performed in neurons and neuron–microglia cocultures, as reported previously 16, with minor modifications. Briefly, neuron or neuron–microglia cocultures were initially maintained in an anoxic (95% N2 and 5% CO2) and serum/glucose‐free DMEM environment at 37°C for 30 min. The cells were then transferred to a normoxic incubator (95% air and 5% CO2) with normal glucose medium without B27 for reperfusion. Three to six hours after reperfusion, the conditioned medium was harvested from neuron. Neuronal‐conditioned medium (NCM) from OGD‐induced neurons was cleared by centrifugation and was then diluted to 3:1 by mixing with microglial complete medium prior to treating microglia cells. The conditioned medium was applied fresh without storage. For all experiments, conditioned medium from normal neurons was collected simultaneously and used in parallel. In some experiments, microglia were pretreated with and without AG490 (10 μM; Santa Cruz Biotechnology Inc., Santa Cruz, CA, USA), JSH‐23 (10 μM; Selleck Chemicals, Houston, TX, USA), anti‐FasL neutralizing antibody of TNFSF6 Ab (0.1 μg/mL; R&D Systems, Minneapolis, MN, USA), or rat IgG (0.1 μg/mL; R&D systems) for 30 min and then incubated with recombinant murine sFasL (0.1 nM; R&D Systems) for 3–48 h.
ELISA Assay
The embryonic cortical neuronal cultures or neuron–microglia cocultures were exposed to OGD as mentioned above, and supernatants were evaluated using a mouse sFasL immunoassay kit (R&D Systems) following the manufacturer's protocol.
RNA Isolation and Real‐Time PCR
Total RNA was extracted from the microglia and neuron–microglia cocultures (with or without OGD treatment) using TRIzol (Invitrogen, Carlsbad, CA, USA) and was reverse‐transcribed into cDNA using a PrimeScript RT reagent Kit (Takara, Dalian, China) according to the manufacturer's instructions. Quantitative real‐time PCR (RT‐PCR) was performed using SYBR Premix Ex Tag™ on an ABI 7500 PCR instrument (Applied Biosystems, Foster City, CA, USA). Relative gene expression was analyzed by the 2−(ΔΔCt) with normalization to the expression of the internal control glyceraldehyde‐3‐phosphate dehydrogenase (GAPDH). Corresponding primers (Invitrogen) were as follows:
CD11b: F: CCA AGA CGA TCT CAG CAT CA, R: TTC TGG CTT GCT GAA TCC TT; CD16: F: TTT GGA CAC CCA GAT GTT TCA G, R: GTC TTC CTT GAG CAC CTG GAT C; CD32: F: AAT CCT GCC GTT CCT ACT GAT C, R: GTG TCA CCG TGT CTT CCT TGA G; CD86: F: GAC CGT TGT GTG TGT TCT GG, R:GAT GAG CAG CATCAC AAG GA; iNOS: F: CAG CTG GGC TGT ACA AAC CTT, R: CAT TGG AAG TGA AGC GTT TCG; TNF‐α: F: CAA GGG ACA AGG CTG CCC CG, R: GCA GGG GCT CTT GAC GGC AG; IL‐1β: F: AAG CCT CGT GCT GTC GGA CC, R: TGA GGC CCA AGG CCA CAG G; CD206: F: TTC GGT GGA CTG TGG ACG AGC A, R: ATA AGC CAC CTG CCA CTC CGG T; IL‐10: F: GGT TGC CAA GCC TTA TCG GA, R: ACC TGC TCC ACT GCC TTG CT; Ym1/2:F: GGG CAT ACC TTT ATC CTG AG, R: CCA CTG AAG TCA TCC ATG TC; TGF‐β: F: GGA GCC ACA AAC CCC GCC TC, R: GCC AGC AGG TCC GAG GGG AGA.
Western Blot Analysis
Western blot analysis was performed as previously 17. Cytoplasmic and nuclear protein extraction kit (Thermo Fisher Scientific, Pittsburgh, PA, USA) was used to collect the cytoplasmic and nuclear protein according to the manufacturer's instruction. Equal amounts of protein were separated by 8% SDS‐polyacrylamide gel and transferred to polyvinylidene difluoride (PVDF) membrane. The membrane was blocked with 5% skim milk in TBST for 1 h at room temperature and incubated with primary antibodies against p‐JAK2, JAK2, p‐STAT3, STAT3 (1:500; Cell Signaling Technology, Beverly, MA, USA), NF‐κB p50 (1:200; Santa Cruz Biotechnology Inc.), NF‐κB p65 (1:1000; Cell Signaling Technology), IκBa (1:1000; Cell Signaling Technology, Beverly, MA, USA), p‐IκBa (1:1000; Cell Signaling Technology), iNOS (1:1000; Bioworld, Louis Park, MN, USA), COX‐2 (1:1000; Bioworld), and β‐actin (1:5000; Bioworld) overnight, followed by appropriate horseradish peroxidase (HRP)‐conjugated secondary antibody (1:5000; Bioworld). The reaction was observed using chemiluminescence reagents (Bioworld). The intensity of blots was quantified using densitometry.
Immunofluorescene Analysis
Brain slices were prepared as previously described 18. After being blocked with 5% goat serum (TBST), the slices were incubated with CD16 antibody (1:500; BD Pharmingen, San Diego, CA, USA), CD206 (1:500; Abcam, Cambridge, UK), and Iba‐1 (1:500; Wako Chemicals USA Inc., Richmond, VA, USA) overnight at 4°C. Primary microglia were seeded in cover slips in 24‐well culture plates and exposed to NCM or sFasL (0.1 nM) for 24 h with or without neutralization antibody. Briefly, cells were washed twice with PBS and fixed in cold 4% paraformaldehyde for 25 min at room temperature. After washing twice in PBS pH 7.4 containing 0.25% Triton X‐100, cells were blocked in 3% BSA in PBS for 1 h at room temperature. Subsequently, the cells were incubated overnight with antibodies against CD16 (1:500, BD Pharmingen, UK), CD206 (1:500; Abcam), and Iba‐1 (1:500; Wako Chemicals USA Inc.) at 4°C and then incubated with FITC‐conjugated goat anti‐mouse IgG at room temperature for 2 h. Images were taken using a fluorescence microscope (Olympus PX51; Olympus Corporation, Tokyo, Japan) and analyzed with Adobe Photoshop 5.5 software (Adobe Systems, San Jose, CA, USA). The cell quantity calculation was made by counting three randomly selected microscopic fields on the cover slips; fluorescent density was analyzed using ImageJ software (National Institutes of Health, Bethesda, MD, USA).
Statistical Analysis
Data were expressed as the mean ± standard error of the mean (SEM) of three to six independent experiments. Significant differences were evaluated using ANOVA test followed by Bonferroni post hoc multiple comparison test using the SPSS software 18.0 (SPSS, Chicago, IL, USA). P‐values <0.05 were considered as statistically significant differences.
Results
gld Mice Attenuated M1 Microglia Polarization in Ischemic Brain
To investigate whether sFasL is relevant to microglia polarization after stroke, the gene expression of M1 markers (CD16, CD32, CD86, iNOS, and TNF‐α) and M2 markers (CD206, YM1/2, and IL‐10) of ipsilateral cortex in both wild‐type and gld mice after MCAO was measured by RT‐PCR. The results showed that CD16, CD32, CD86, iNOS, and TNF‐α were increased from 24 to 72 h after MCAO in wild‐type mice (Figure 1A–C), which was consistent with Hu's study 19. However, in comparison with wild‐type mice, the gene levels of CD16, CD32, and iNOS were decreased by 28.7%, 28.0%, and 23.7% at 72 h after MCAO in gld mice, respectively. In contrast, the gene levels of M2 marker CD206 was increased by 27.5% and 14.0% at 24 and 72 h after MCAO (Figure 1D). In addition, as an antiinflammatory factor, another M2 marker, IL‐10, was upregulated by 42.2% in gld mice at 24 h (Figure 1D).
Figure 1.
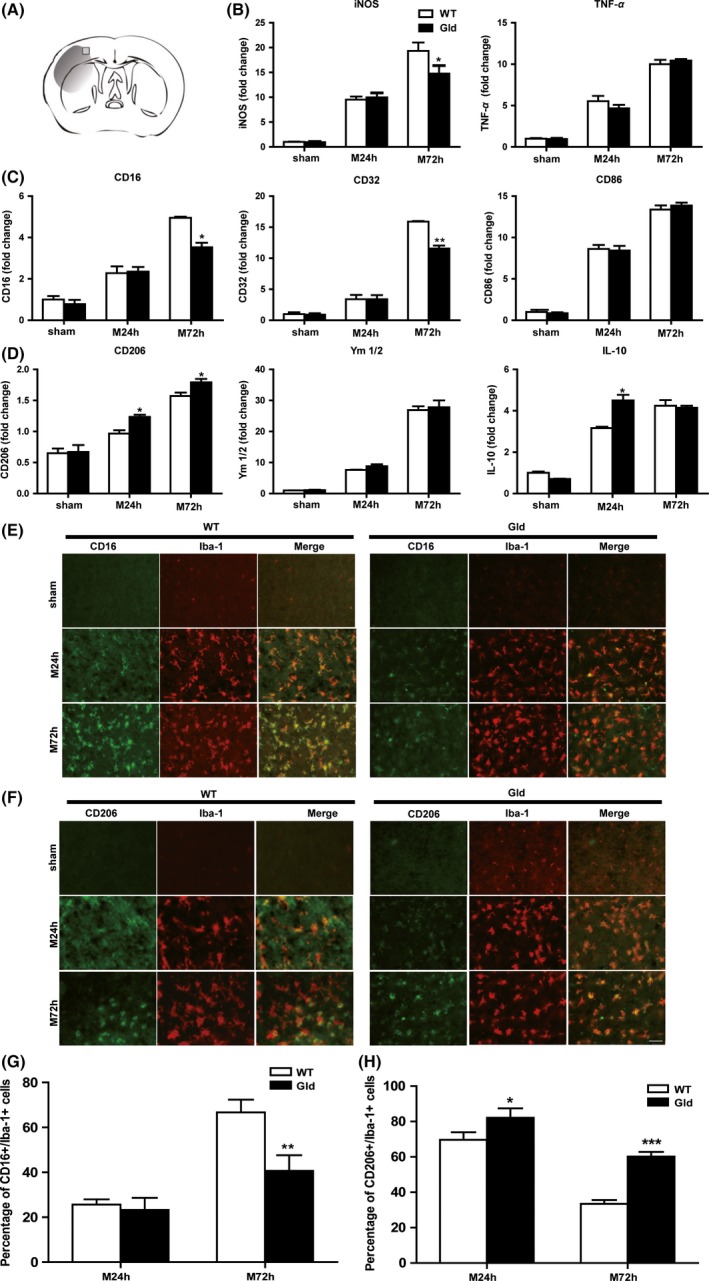
FasL mutation in gld mice reduces microglial activation and M1 polarization after middle cerebral artery occlusion (MCAO). (A) The image showing the position of immunofluorescent staining obtained from the penumbra of the infarct brain, (B) RT‐PCR for mRNA expressions of inflammatory cytokines, (C) M1 surface markers and (D) M2 markers of ipsilateral cortexs at 24 and 72 h after MCAO. n = 4 animals per group. (E) Cortex costained for CD16 (M1 marker, green) and Iba‐1 (red). (F) Cortex costained for CD206 (M2 marker, green) and Iba‐1 (red). (G) Expression of the percentage of CD16+/Iba‐1+ cell. (H) Expression of the percentage of CD206+/Iba‐1+ cell. Scale bar: 50 μM. n = 4 animals per group. *P < 0.05, **P < 0.01, ***P < 0.001 versus wild‐type mice, respectively.
Consistent with gene expression, M1 microglial polarization, as revealed by Iba1+/CD16+ staining in ischemic brain slices, was prominent in wild‐type mice after MCAO while greatly attenuated in gld mice (Figure 1E,G). Iba1+/CD206+ cell number was higher in gld mice at 24 and 72 h after MCAO (Figure 1F,H). Taken together, these results suggest the protective function of gld mice after ischemia mainly involves the microglial polarization process by declining the pro‐inflammatory M1 phenotype and promoting the antiinflammatory M2 phenotype.
OGD‐Induced Microglial Activation and M1 Microglial Polarization in Neuron–Microglia Cocultures
To investigate the cross talk between neurons and microglia after OGD treatment, neuron–microglia cocultures were constructed in vitro to exclude interactions with other cell types. Microglial inflammatory activity was evaluated by mRNA or protein levels of iNOS, IL‐1β, or COX2. Meanwhile, the surface markers of M1 phenotype (CD11b) and M2 phenotype (CD206) gene expression were tested to determine the microglial polarization. As evaluated by RT‐PCR (Figure 2A), the levels of M1‐type gene CD11b were increased at both 3 h (P < 0.05) and 6 h (P < 0.01) after OGD reperfusion in neuron–microglia cocultures, accompanied by upregulated pro‐inflammatory cytokines iNOS (3 h: P < 0.01, 6 h: P < 0.001) and IL‐1β (3 h: P < 0.05, 6 h: P < 0.01) and downregulated M2‐type markers CD206 (3 h: P < 0.001, 6 h: p < 0.05). Meanwhile, the protein levels of inflammatory mediator iNOS and COX2 were prominently increased after OGD treatment in cocultures (Figure 2B,C). These results demonstrated that the interactions between neurons and microglia changed after OGD treatment, inducing microglial activation, generating more inflammatory cytokines and shifting to M1 type.
Figure 2.
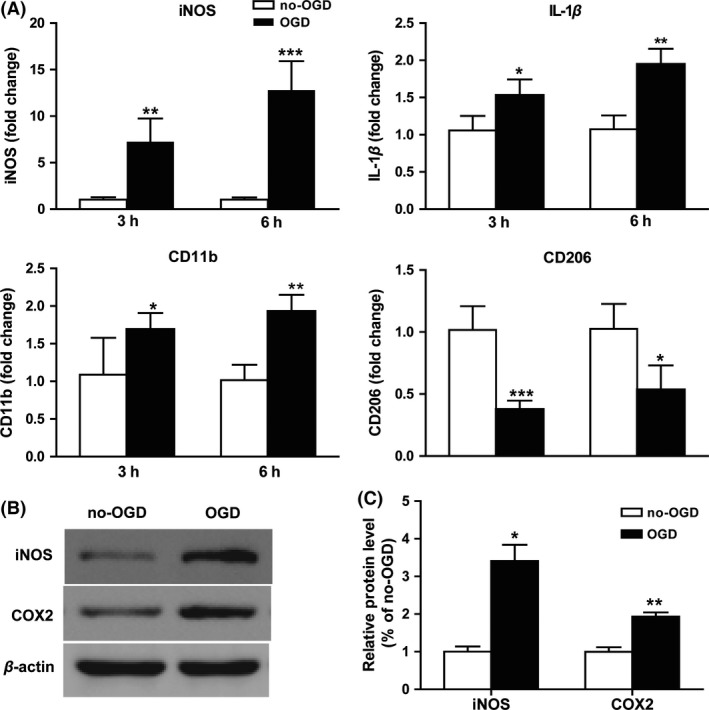
Microglia shift to M1 phenotype in neuron–microglia cocultures after oxygen glucose deprivation (OGD). Cocultures were exposed to OGD for 3 or 6 h. (A) mRNA expression for iNOS, IL‐1β, CD11b, and CD206 were evaluated by RT‐PCR. (B) The protein level of iNOS and COX‐2 was determined by Western blotting. (C) Statistical bar graph of protein expression. *P < 0.05, **P < 0.01, ***P < 0.001 versus no‐OGD cocultures. n = 12 per group.
Ischemic Neurons From gld Mice Decreased Microglia Polarization Toward M1 in a Contact‐Independent Way in vitro
Neuron–microglia interaction through contact‐dependent or contact‐independent mechanisms is involved in the regulation of microglial phenotype in both physiological and pathological conditions 6. To investigate the different effects of the soluble factors released by ischemic neuron cultured between wild‐type and gld mice on microglia, microglia were treated with conditioned medium collected from normal neuronal cultures (NCM) or 6 h post‐OGD neuronal cultures (OGD‐NCM) of the two genotype mice. As shown in Figure 3A, the gene expression of M1 markers (iNOS, TNF‐α, CD11b, CD16, CD32, and CD86) were increased after OGD‐NCM treatments for 24 h. Meanwhile, M2 marker IL‐10 was also downregulated after the OGD‐NCM stimulation, although no significant changes were found in CD206 expression (Figure 3A). Consistent with the RT‐PCR results, immunofluorescent analysis confirmed a statistically significant increase of CD16 expression in microglia 24 h after OGD‐NCM treatment (Figure 3B,C). Interestingly, compared with OGD‐NCM cultured from wild‐type neuron, OGD‐NCM from gld neuron attenuated the gene expression of M1 markers (iNOS, TNF‐α, CD11b, CD16, CD32, and CD86) and release of pro‐inflammatory mediators (iNOS and COX2) (Figure 3A–E). These results indicated that ischemic neuron could induce M1 polarization through contact‐independent mechanism by releasing soluble mediators, while ischemic neurons from gld mice attenuated M1 polarization.
Figure 3.
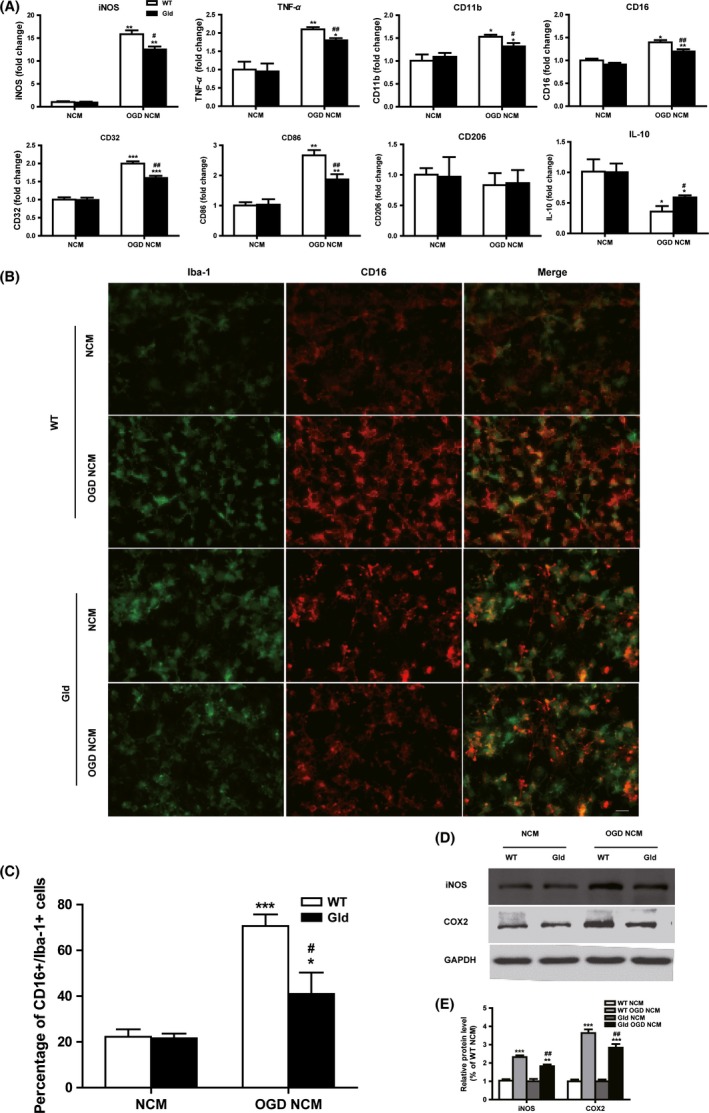
Oxygen glucose deprivation (OGD)‐treated neuronal‐conditioned medium (NCM) primes microglial polarization toward M1 phenotype. Microglia were subjected to normal NCM or 6 h post‐OGD neuron‐conditioned medium (OGD‐NCM) prepared from wild‐type (WT) or FasL‐mutant (gld) mice for 24 h. (A) RT‐PCR quantification of mRNA expression of M1 surface markers (iNOS, TNF‐α, CD11b, CD16, CD32, and CD86) and M2 markers (CD206 and IL‐10). (B) Representative double‐staining immunofluorescence of CD16+/Iba‐1+ cell. Scale bar: 20 μM. (C) Quantification of the percentage of CD16+/Iba‐1+ cell. (D) Protein expression of iNOS and COX2 were evaluated by Western blotting. n = 9 per group. Quantification of the percentage of CD16+/Iba‐1+ cell and CD206+/Iba‐1+ cell (E) Statistical bar graph of iNOS, COX2 protein expression. *P < 0.05, **P < 0.01, ***P < 0.001 versus corresponding NCM group. # P < 0.05, ## P < 0.01 versus WT OGD‐NCM. n = 12 per group.
Neuron‐Derived sFasL Plays Important Roles in OGD‐Mediated M1 Microglia Polarization
The pro‐inflammatory function of sFasL after ischemia has been described previously 9, 12. From ELISA assay results (Figure 4A), a significant increase of sFasL expression was observed in the post‐OGD neuronal medium at 3 and 6 h, indicating that neuron‐derived sFasL may be involved, in part, in the regulation of microglia phenotype and function. To evaluate the potential and degree of sFasL influence in pro‐inflammatory responses of post‐OGD neuronal medium, sFasL‐specific neutralizing antibody (0.1 μg/mL) was added into post‐OGD‐NCM to inhibit its functions. As shown by Figure 4B–D, inhibition of sFasL activity was highly effective in inhibiting production of pro‐inflammatory both in mRNA (iNOS, TNF‐α, and IL‐1β) and protein (iNOS and COX‐2) levels, although inflammation was not totally blocked in post‐OGD neuronal medium.
Figure 4.
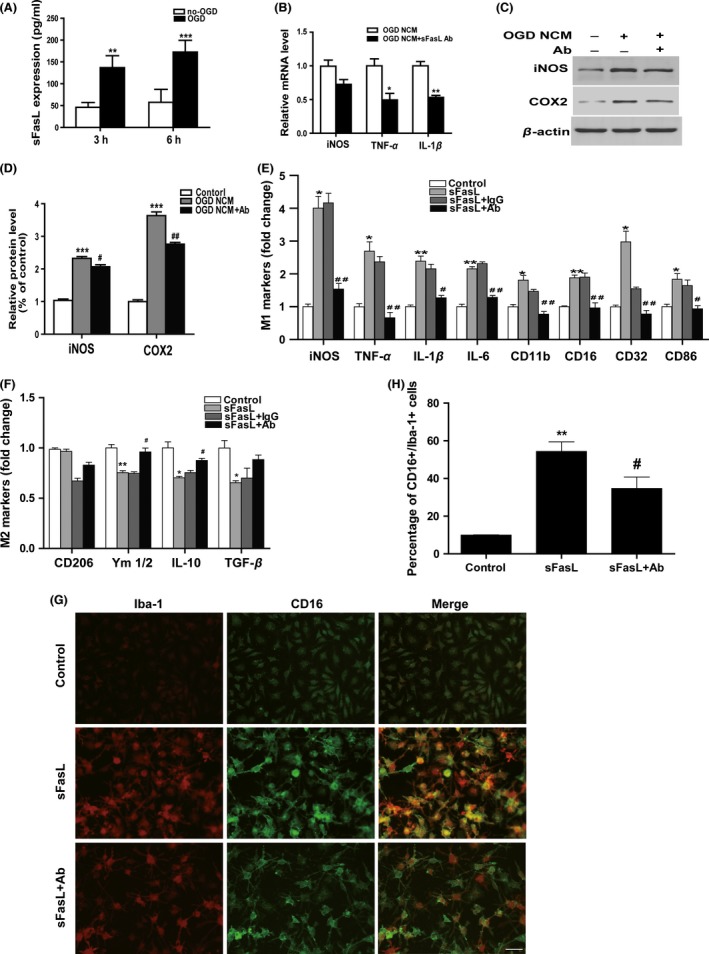
FasL neutralization inhibited post‐oxygen glucose deprivation (OGD) neuronal‐conditioned medium (NCM) or sFasL‐induced M1‐microglial polarization. (A) Neuronal sFasL expression after 3 h/6 h OGD was detected by ELISA assay. **P < 0.01, ***P < 0.001 versus no‐OGD control group. n = 12 per group. (B) Microglia were treated with 6 h NCM with or without sFasL neutralizing antibody (0.1 μg/mL). mRNA levels of inflammatory cytokine iNOS, TNF‐α, and IL‐1β. *P < 0.05, **P < 0.01 versus OGD‐NCM group. n = 12 per group. (C) Protein expression of iNOS and COX2 evaluated by Western blotting. n = 9 per group. (D) Statistical bar graph of iNOS, COX2 protein expression. *P < 0.05, **P < 0.01, ***P < 0.001 versus control, # P < 0.05, ## P < 0.01 versus OGD‐NCM group. (E) Microglia were pretreated with or without FasL neutralizing antibody (0.1 μg/mL) or rat Ig G(0.1 μg/mL, negative control) for 30 min followed by 0.1 nM sFasL treatment for 24 h. mRNA expression of M1 markers and (F) M2 markers was analyzed by Q‐PCR. n = 12 per group. (G) Costaining of CD16 (M1 marker, green) and Iba‐1 (red) for immunofluorescence pictures and (H) quantification of the percentage of CD16+/Iba‐1+ cell. Scale bar: 20 μM. *P < 0.05, **P < 0.01, ***P < 0.001 versus control, # P < 0.05, ## P < 0.01 versus sFasL and Ig G group.
To better understand the direct effect of sFasL in microglia, cells were treated with heterogeneous sFasL at different times. A 0.1 nM stimuli concentration was selected as most similar to the expression level of post‐OGD neuronal medium. As shown in Figure S1, M1 markers such as CD16 and CD32 were simultaneously increased and peaked at 24 h, which suggests that sFasL‐induced microglia shifted to M1 type within 24 h. A 24‐h period was therefore selected for subsequent experiments.
In following experiments, recombined sFasL (0.1 nM) was added to microglia pretreated with or without FasL antibody (0.1 μg/mL) or rat IgG (0.1 μg/mL). The bar graph in Figure 4E,F demonstrates that sFasL significantly promoted the genes expression of M1 surface markers (CD11b, CD16, CD32, and CD86) and pro‐inflammatory cytokines (iNOS, IL‐1β, IL‐6, and TNF‐α) and attenuated anti‐inflammatory cytokines (IL‐10, Ym1/2, TGF‐β). Functionally, blockage of sFasL dramatically reversed the changes of markers and cytokines. Consistent with the RNA results, immunofluorescence indicated a significant increase of M1 polarization (Iba1+/CD16+ staining) at 24 h after sFasL treatment (Figure 4G,H). Taken together, these data suggest that sFasL is an important inflammatory mediator in microglia, which correlates with its effect in M1 microglia polarization.
sFasL Activated the JAK2/STAT3 and NF‐κB Signaling Pathways in Microglia
Both the JAK2/STAT3 and NF‐κB signaling pathways are strongly connected to inflammation regulation in stroke. To determine whether the two pathways play important roles in the pro‐inflammatory functions of sFasL, the protein expression of p‐JAK2/STAT3 and activation of NF‐κB p50/p65 were evaluated by Western blotting. As indicated in Figure 5A–C, sFasL significantly increased p‐JAK2 to 197.3 ± 37.5% of control and p‐STAT3 to 178.8 ± 10.3% of control. Compared with negative control group, inhibition of sFasL by its specific neutralizing antibody decreased the phosphorylation levels of JAK2/STAT3 in microglia exposed to sFasL. Meanwhile, sFasL treatment increased the phosphorylation of IκBa (P < 0.01) and nuclear translocation of p50/p65 (P < 0.05) in microglia. In addition, neutralization of sFasL inhibited the sFasL‐induced phosphorylation of IκBa (P < 0.05) and translocation of p50/p65.
Figure 5.
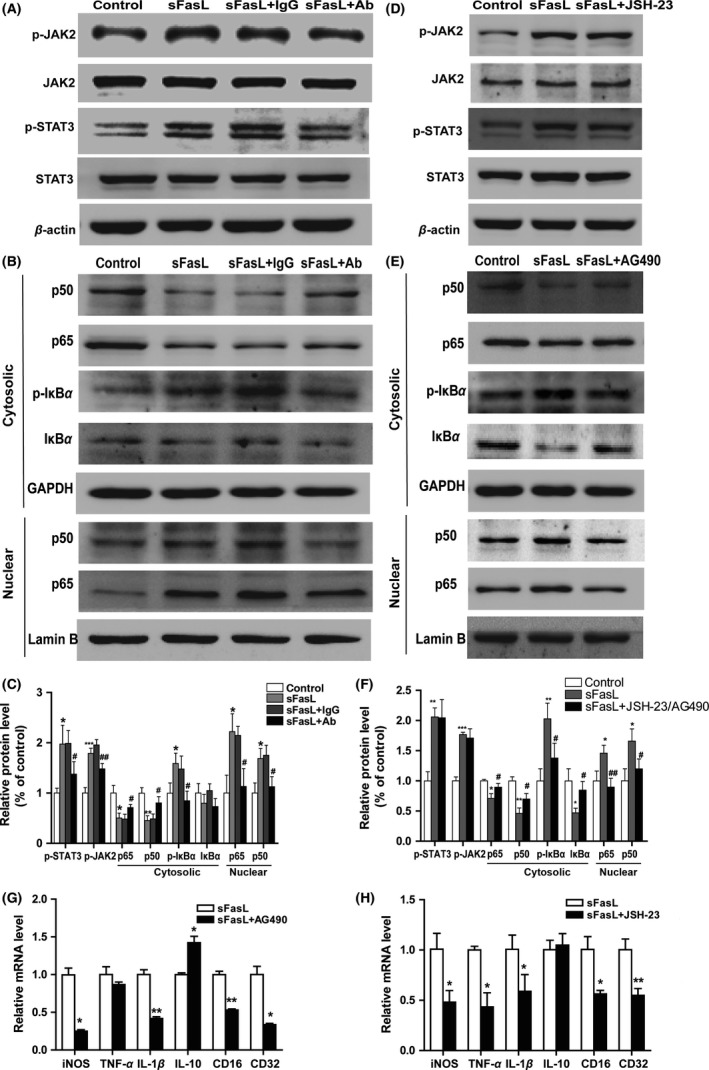
JAK2/STAT3 and NF‐κB signaling pathways were involved in the sFasL‐induced pro‐inflammatory effects in microglia. Microglia were pretreated with 0.1 μg/mL rat IgG or FasL neutralizing antibody for 30 min followed by challenge with sFasL for 24 h. (A) Immunoblot analysis for p‐JAK2, JAK2, P‐STAT3, STAT3 and β‐actin. (B) Representative image of Western blotting of p50, p65, p‐IκBa, and IκBa in the cytosolic and p50 and p65 in nuclear. (C) Quantitative analysis of Figure 5 A and B. *P < 0.05, **P < 0.01, ***P < 0.001 versus control, # P < 0.05, ## P < 0.01 versus sFasL + rat Ig G group. n = 9 per group. Microglia were pre‐treated with or without JAK2 inhibitor AG490 (10 μM) or NF‐κB inhibitor JSH‐23 (10 μM)for 30 min and then stimulated with sFasL (0.1 nM) for 24 h. Representative image of Western blotting of JAK2/STAT3. (D) and NF‐κB (E) signaling pathways. (F) Quantitative analysis of Figure 5D,E. *P < 0.05, **P < 0.01, ***P < 0.001 versus control, # P < 0.05, ## P < 0.01 versus sFasL group. n = 9 per group. (G, H) mRNA expression of iNOS, TNF‐α, IL‐1β, IL‐10, CD16, and CD32 were determined by RT‐PCR at 24 h after stimulation of sFasL pretreated with or without AG490 or JSH‐23. *P < 0.05, **P < 0.01 versus sFasL group. n = 3 repeats.
To validate whether the activation of JAK2/STAT3 and NF‐κB pathways were responsible for the pro‐inflammatory function of sFasL in microglia, AG490 (a tyrosine kinase inhibitor of JAK2) or JSH‐23 (an NF‐κB nuclear translocation inhibitor) was pretreated to sFasL‐induced microglia. As shown in Figure S2, AG490 and JSH‐23 effectively inhibited the activation of p‐JAK2/STAT3 and NF‐κB pathways, respectively, in microglia pretreated with sFasL. Concomitantly, the M1 markers such as iNOS, IL‐1β, TNF‐α, CD16, and CD32 were downregulated after JAK2/STAT3 or NF‐κB signaling pathway inhibition (Figure 5G,H). Collectively, from these data, it is concluded that pro‐inflammatory effect of sFasL might be partially mediated by the JAK2/STAT3 and NF‐κB signal pathways in microglia.
To investigate the relationship between NF‐κB and JAK2/STAT3 signaling pathways activated by sFasL in microglia, we pretreated microglia with AG490 (10 μM) for 30 min before sFasL stimuli. The phosphorylation of IκBa and translocation of p50/p65 were significantly blocked after microglia pretreated with AG490 (Figure 5E,F). These data suggested that NF‐κB might act as a downstream of JAK2/STAT3 pathway in mediating pro‐inflammatory effects of sFasL in microglia.
FasL Mutant Attenuated M1 Microglial‐Induced Post‐OGD Neuronal Death
Experiments in vitro previously revealed that conditioned medium from M1‐polarized microglia exacerbated OGD‐induced neuronal death, and in contrast, M2‐conditioned medium protected neurons against OGD 19. To elucidate the effects of sFasL in M1‐ or M2‐polarized microglia induced neuronal death after OGD, M1, or M2 microglial‐conditioned medium from both wild‐type and gld were prepared (Figure S3) and applied to the post‐OGD neuronal cultures for 6 h. Consistent with the previous study, compared with nonpolarized microglia (M0) and M2‐polarized microglia, M1‐polarized microglial medium with or without FasL mutant exacerbated OGD‐induced neuronal death, as demonstrated by increased percentage of PI‐positive cells (Figure 6A,B) and increased LDH release (Figure 6C). MTT assay further confirmed that M1 microglial‐conditioned medium resulted in reduced cell viability of post‐OGD neuron (Figure 6D). Interestingly, compared with wild‐type primary microglia, microglia with FasL mutant protected the survival and increased the cell viability of post‐OGD neurons under M1 microglial‐conditioned medium treatment (Figure 6A–D). These results suggest that as a soluble factor, sFasL played important roles in M1 microglia exacerbated neuronal death under ischemic/hypoxic conditions.
Figure 6.
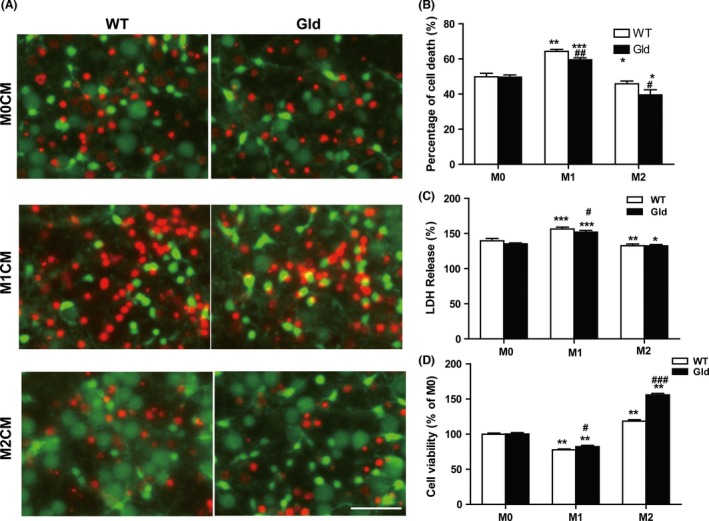
Effect of M1 and M2 microglia on post‐oxygen glucose deprivation (OGD) neuronal survival. Both wild‐type and gld microglia were induced to M1 or M2 phenotype using LPS (100 ng/mL) + IFN‐γ (20 ng/mL) or IL‐4 (20 ng/mL) for 48 h, respectively. The microglial‐conditioned medium were applied over post‐OGD neuron for 6 h. (A) Neuronal cell death was quantified by propidium iodide (red) and calcein AM (green) staining. Scale bar: 50 μm. (B) Mean percentage of neuronal death. (C) lactate dehydrogenase (LDH) release of post‐OGD neuron. (D) Cell viability was quantified by MTT assay. *P < 0.05, **P < 0.01, ***P < 0.001 versus corresponding M0 control group, # P < 0.05, ## P < 0.01 versus WT group. n = 9 per group.
Discussion
The present study for the first time showed the following facts: (1) M1‐phenotype microglia of ipsilateral cortex decreased in the gld mice after MCAO. (2) The ischemic neurons triggered microglial pro‐inflammation in a contact‐independent way and sFasL released by ischemic neurons took a significant role in M1‐phenotype shift. (3) sFasL‐induced morphological and biochemical reactions in microglia might involve the activation of the JAK2/STAT3 and NF‐κB signal pathways.
Fas‐FasL signaling has been demonstrated in the apoptosis of immune cells, but increasing evidence indicated its roles in apoptosis‐independent processes such as proliferation, angiogenesis, fibrosis, and particularly inflammation 20, 21. In our previous study, we reported that the production of inflammatory cytokines and sFasL and the recruitment of peripheral inflammatory cells were attenuated in gld mice after MCAO, accompanied by reduced brain damage and improved neurological performance, suggesting the inflammatory role of sFasL in experimental stroke 12. As reported, neutralizing FasL with antibody treatment had neuroprotection in MCAO mice 11, 22. However, little is known about the involvement of FasL in microglial activation and polarization.
Increasing researches have suggested that damaged neurons after stroke are not merely phagocytosed by microglia, but rather regulate phenotypes and functions of microglia through cytokines, nucleotides, and chemokines 6. We hypothesized that sFasL released by neuron modulated functions of microglia, due to FasL/Fas expresses on both neurons and microglia 23. This study showed that OGD neurons in wild‐type mice produced higher sFasL in vitro, which activated and shifted microglia to M1. M1 microglia produce inflammatory cytokines, such as IL‐1β, TNF‐α, iNOS, and COX2, which could damage neuron and brain after stroke 19. sFasL‐mediated inflammatory responses were reversed partially at the presence of FasL antibody. sFasL mainly accounts for inflammation and endothelial dysfunction, not only in ischemic stroke 12, but also in coronary artery disease 24, 25 and chronic kidney disease 26. Investigation in gld mice has revealed that sFasL elevation promotes tumorigenesis and triggers autoimmune reactions 27. Based on these findings, many researchers suggest sFasL may become a new marker of inflammation and endothelial dysfunction in immune diseases 26.
How does sFasL mediate M1 microglia polarization after ischemic stroke? Phosphorylation of STAT3 at tyrosine Y705 residue is involved in microglial‐mediated inflammatory processes. JAK kinase‐induced phosphorylation of STAT3 is triggered by pro‐inflammatory cytokines after brain injury 27. Increased phosphorylation of JAK2 and STAT3 appeared in the ipsilateral cortex and striatum of rats after MCAO and inhibition of phosphorylated JAK2/STAT3 by AG490 or siRNA decreased infarct volume, produced fewer apoptotic cells and improved neurological function 28. Both NF‐κB and JAK2/STAT3 pathways can regulate inflammatory process of many CNS diseases 29, 30. In this study, we found that sFasL activated microglia and increased M1 microglia polarization through phosphorylation of JAK2/STAT3/NF‐κB pathway. JAK2 antagonist AG490 could inhibit not only phosphorylated STAT3/NF‐κB, but also sFasL‐induced M1 microglia polarization and related inflammation.
In conclusion, the present study demonstrates that sFasL released by neurons in vitro ischemic stroke model plays an important role in mediating M1 microglia shift and microglial inflammatory response, and the mechanisms may involve the phosphorylation of JAK2/STAT3/NF‐κB pathway. Neutralization of sFasL may become a novel therapeutic strategy to suppress poststroke inflammation and M1 microglia polarization, which may thus improve stroke outcomes.
Disclosure
None.
Conflict of Interest
The authors declare no conflict of interest.
Supporting information
Figure S1 Time‐dependent manner of sFasL‐induced mocroglia polarization.
Figure S2 Inhibition of JAK2/STAT3 and NF‐κB signaling pathways.
Figure S3 Microglia were induced to M1 or M2 phenotype.
Acknowledgments
The authors thank Brad Peterson for modifying the English. This research was supported by the National Natural Science Foundation of China (81230026, 81171085, 81000510, 81400971), the Natural Science Foundation (BL2012013), and the Bureau of Health (LJ201101) of Jiangsu Province of China.
The first two authors contributed equally to this work.
References
- 1. Feigin VL, Lawes CM, Bennett DA, Barker‐Collo SL, Parag V. Worldwide stroke incidence and early case fatality reported in 56 population‐based studies: A systematic review. Lancet Neurol 2009;8:355–369. [DOI] [PubMed] [Google Scholar]
- 2. Mozaffarian D, Benjamin EJ, Go AS, et al. Heart disease and stroke statistics–2015 update: A report from the American Heart Association. Circulation 2015;131:e29–e322. [DOI] [PubMed] [Google Scholar]
- 3. Picascia A, Grimaldi V, Iannone C, Soricelli A, Napoli C. Innate and adaptive immune response in stroke: Focus on epigenetic regulation. J Neuroimmunol 2015;289:111–120. [DOI] [PubMed] [Google Scholar]
- 4. Jin R, Yang G, Li G. Inflammatory mechanisms in ischemic stroke: Role of inflammatory cells. J Leukoc Biol 2010;87:779–789. [DOI] [PMC free article] [PubMed] [Google Scholar]
- 5. Benarroch EE. Microglia: Multiple roles in surveillance, circuit shaping, and response to injury. Neurology 2013;81:1079–1088. [DOI] [PubMed] [Google Scholar]
- 6. Suzumura A. Neuron‐microglia interaction in neuroinflammation. Curr Protein Peptide Sci 2013;14:16–20. [DOI] [PubMed] [Google Scholar]
- 7. Chavarria A, Cardenas G. Neuronal influence behind the central nervous system regulation of the immune cells. Front Integr Neurosci 2013;7:64. [DOI] [PMC free article] [PubMed] [Google Scholar]
- 8. Sun M, Fink PJ. A new class of reverse signaling costimulators belongs to the TNF family. J Immunol 2007;179:4307–4312. [DOI] [PubMed] [Google Scholar]
- 9. Choi C, Benveniste EN. Fas ligand/Fas system in the brain: Regulator of immune and apoptotic responses. Brain Res Brain Res Rev 2004;44:65–81. [DOI] [PubMed] [Google Scholar]
- 10. Kunes P, Krejsek J, Brtko M, et al. Neutrophil apoptosis by Fas/FasL: Harmful or advantageous in cardiac surgery? Thorac Cardiovas Surg 2009;57:1–6. [DOI] [PubMed] [Google Scholar]
- 11. Blankenberg FG, Kalinyak J, Liu L, et al. 99mTc‐HYNIC‐annexin V SPECT imaging of acute stroke and its response to neuroprotective therapy with anti‐Fas ligand antibody. Eur J Nucl Med Mol Imaging 2006;33:566–574. [DOI] [PubMed] [Google Scholar]
- 12. Niu FN, Zhang X, Hu XM, et al. Targeted mutation of Fas ligand gene attenuates brain inflammation in experimental stroke. Brain Behav Immun 2012;26:61–71. [DOI] [PubMed] [Google Scholar]
- 13. Chen ZB, Huang DQ, Niu FN, Zhang X, Li EG, Xu Y. Human urinary kallidinogenase suppresses cerebral inflammation in experimental stroke and downregulates nuclear factor‐kappaB. J Cereb Blood Flow Metab 2010;30:1356–1365. [DOI] [PMC free article] [PubMed] [Google Scholar]
- 14. Xu Y, Tao YX. Involvement of the NMDA receptor/nitric oxide signal pathway in platelet‐activating factor‐induced neurotoxicity. NeuroReport 2004;15:263–266. [DOI] [PubMed] [Google Scholar]
- 15. Han LJ, Yin KL, Zhang SY, et al. Dalesconols B inhibits lipopolysaccharide induced inflammation and supresses NF‐κB and p38/JNK activation in microglial cells. Neurochem Int 2013;62:913–921. [DOI] [PubMed] [Google Scholar]
- 16. Cao G, Pei W, Ge H, et al. In vivo delivery of a Bcl‐xL fusion protein containing the TAT protein transduction domain protects against ischemic brain injury and neuronal apoptosis. J Neurosci 2002;22:5423–5431. [DOI] [PMC free article] [PubMed] [Google Scholar]
- 17. Zhu X, Chen C, Ye D, et al. Diammonium glycyrrhizinate upregulates PGC‐1alpha and protects against Abeta1‐42‐induced neurotoxicity. PLoS One 2012;7:e35823. [DOI] [PMC free article] [PubMed] [Google Scholar]
- 18. Zhang MJ, Sun JJ, Qian L, et al. Human umbilical mesenchymal stem cells enhance the expression of neurotrophic factors and protect ataxic mice. Brain Res 2011;1402:122–131. [DOI] [PubMed] [Google Scholar]
- 19. Hu X, Li P, Guo Y, et al. Microglia/macrophage polarization dynamics reveal novel mechanism of injury expansion after focal cerebral ischemia. Stroke 2012;43:3063–3070. [DOI] [PubMed] [Google Scholar]
- 20. Bien K, Sokolowska J, Baska P, Nowak Z, Stankiewicz W, Krzyzowska M. Fas/FasL pathway participates in regulation of antiviral and inflammatory response during mousepox infection of lungs. Mediators Inflamm 2015;2015:281613. [DOI] [PMC free article] [PubMed] [Google Scholar]
- 21. Padosch SA, Popp E, Vogel P, Bottiger BW. Altered protein expression levels of Fas/CD95 and Fas ligand in differentially vulnerable brain areas in rats after global cerebral ischemia. Neurosci Lett 2003;338:247–251. [DOI] [PubMed] [Google Scholar]
- 22. Martin‐Villalba A, Hahne M, Kleber S, et al. Therapeutic neutralization of CD95‐ligand and TNF attenuates brain damage in stroke. Cell Death Differ 2001;8:679–686. [DOI] [PubMed] [Google Scholar]
- 23. Lu YM, Tao RR, Huang JY, et al. P2X7 signaling promotes microsphere embolism‐triggered microglia activation by maintaining elevation of Fas ligand. J Neuroinflammation 2012;9:172. [DOI] [PMC free article] [PubMed] [Google Scholar]
- 24. Blanco‐Colio LM, Martin‐Ventura JL, Tunon J, Garcia‐Camarero T, Berrazueta JR, Egido J. Soluble Fas ligand plasma levels are associated with forearm reactive hyperemia in subjects with coronary artery disease: A novel biomarker of endothelial function? Atherosclerosis 2008;201:407–412. [DOI] [PubMed] [Google Scholar]
- 25. Cardinal H, Brophy JM, Bogaty P, et al. Usefulness of soluble fas levels for improving diagnostic accuracy and prognosis for acute coronary syndromes. Am J Cardiol 2010;105:797–803. [DOI] [PubMed] [Google Scholar]
- 26. Musial K, Zwolinska D. The sFas/sFasL ratio as a novel marker of inflammation in children with chronic kidney disease. Clin Chim Acta 2012;414:7–11. [DOI] [PubMed] [Google Scholar]
- 27. Hohlbaum AM, Moe S, Marshak‐Rothstein A. Opposing effects of transmembrane and soluble Fas ligand expression on inflammation and tumor cell survival. J Exp Med 2000;191:1209–1220. [DOI] [PMC free article] [PubMed] [Google Scholar]
- 28. Satriotomo I, Bowen KK, Vemuganti R. JAK2 and STAT3 activation contributes to neuronal damage following transient focal cerebral ischemia. J Neurochem 2006;98:1353–1368. [DOI] [PubMed] [Google Scholar]
- 29. Zhang ZH, Yu LJ, Hui XC, et al. Hydroxy‐safflor yellow A attenuates Abeta(1)(‐)(4)(2)‐induced inflammation by modulating the JAK2/STAT3/NF‐kappaB pathway. Brain Res 2014;1563:72–80. [DOI] [PubMed] [Google Scholar]
- 30. Fang Y, Yan J, Li C, et al. The Nogo/Nogo‐66 receptor (NgR) signal is involved in neuroinflammation through the regulation of microglia inflammatory mediator expression. J Biol Chem 2015;290:28901–28914. [DOI] [PMC free article] [PubMed] [Google Scholar]
Associated Data
This section collects any data citations, data availability statements, or supplementary materials included in this article.
Supplementary Materials
Figure S1 Time‐dependent manner of sFasL‐induced mocroglia polarization.
Figure S2 Inhibition of JAK2/STAT3 and NF‐κB signaling pathways.
Figure S3 Microglia were induced to M1 or M2 phenotype.