

Abstract
Hippocampal Sclerosis (HS) is a prevalent cause of dementia in the oldest-old, but is generally misdiagnosed as Alzheimer’s disease (AD) due to similarities in clinical presentation. To determine if clinical and cognitive features diverge over time, we compared results from longitudinal evaluations of participants in the UCSD Alzheimer’s Disease Research Center with autopsy-confirmed AD (n=195), HS (n=21), or both HS+AD (n=18). Each group exhibited decline on all cognitive measures, with HS declining at a slower rate than AD on the Mini-Mental State Exam, immediate recall condition of a word-list learning test, and Dementia Rating Scale total and subtest scores (except Memory). Five years prior to the final evaluation, more prominent semantic and visuospatial deficits were apparent in AD than in HS despite comparable global cognitive impairment. Groups did not differ on any measure of Executive Function. HS+AD differed from AD only on the Boston Naming Test. Overall, results suggests that HS dementia is associated with cognitive deficits that progress more slowly than, but generally mimic, those observed in AD.
1. Introduction:
Hippocampal Sclerosis (HS) is characterized by severe neuronal loss and gliosis in the CA-1 and subiculum of the hippocampal formation (Dickson et al., 1994; Jellinger, 1994). While predominantly studied in temporal lobe epilepsy, HS is increasingly recognized as the cause of dementia in up to 25% of the “oldest-old” (Leverenz et al., 2002; Nelson et al., 2013, 2011; Zarow et al., 2012). Despite clear pathologic differences at autopsy, HS dementia presents with prominent memory-loss (Dickson et al., 1994) as well as impairment in language, executive function, attention, visuospatial abilities, and perceptual speed (Corey-Bloom et al., 1997; Nag et al., 2015; Zarow et al., 2012), and is typically misdiagnosed as Alzheimer’s disease (AD) in the clinic (Brenowitz et al., 2014; Leverenz et al., 2002; Nelson et al., 2011). While patients with HS tend to be older and less functionally impaired than those with AD (Brenowitz et al., 2014), no clinically differentiating features have been identified.
Comparisons of cognitive profiles between AD and HS have yielded inconsistent results: greater visuospatial, executive, and attention impairments in AD versus HS (Corey-Bloom et al., 1997), only greater executive impairment in AD (Leverenz et al., 2002), or no differences in cognition between the two (Zarow et al., 2008). Results indicating that patients with HS exhibit slower decline on the Mini Mental State Exam (MMSE) than those with AD (Murray et al., 2014) suggest that these variable findings may be attributable to differences in trajectories of decline across various cognitive domains which are obscured in cross-sectional comparisons. In a single longitudinal study, Nelson et al. (2011) identified relatively preserved verbal fluency with similarly impaired word-list recall in HS compared to AD at baseline and 5.5-6.5 years before death. A modest group-level difference in the ratio of these measures was replicated in the National Alzheimer’s Coordinating Center database (Brenowitz et al., 2014), but with too much overlap for individual discrimination. We now extend this work by comparing trajectories of decline in HS, AD, or HS+AD on a comprehensive panel of cognitive measures to determine if profiles of decline can assist in clinical differentiation.
2. Materials and Methods
2.1. Standard Protocol Approvals, Registrations, and Patient Consents
The research protocol was reviewed and approved by the human subject’s review board at the University of California, San Diego. Informed consent to participate in the study was obtained at the point of entry into the ADRC longitudinal study from all patients or their caregivers consistent with California State law. Informed consent for autopsy was obtained at the time of death from the next of kin.
2.2. Participants
Cases for this study were selected from the brain bank of the Shiley-Marcos Alzheimer's Disease Research Center (ADRC) at the University of California, San Diego (UCSD). Cases were included if they had completed at least two longitudinal (approximately annual) clinical and neuropsychological evaluations between 1985 and 2018, received a pathologic diagnosis of hippocampal sclerosis (HS), Alzheimer’s disease (AD), or both (HS+AD), and did not have another neurodegenerative pathology that could account for cognitive decline. We excluded cases with the following concomitant pathologies: Fronto-Temporal Lobar Degeneration, Parkinson’s disease, Multiple Sclerosis, and Tangle-only Dementia. The presence of any Lewy body pathology also resulted in exclusion from the sample. Participants were also excluded if pathological data were incomplete, their last ADRC evaluation was more than 4 years from the date of death, or they died prior to age 65 (Figure 1). In contrast, presence of vascular pathologies did not warrant exclusion as there may be a causal relationship with HS (Dickson et al., 1994; Leverenz et al., 2002; Nelson et al., 2016; Neltner et al., 2014). The prevalence of these vascular pathologies in each group is summarized in Table 1.
Figure 1: Participant Selection and Exclusion.
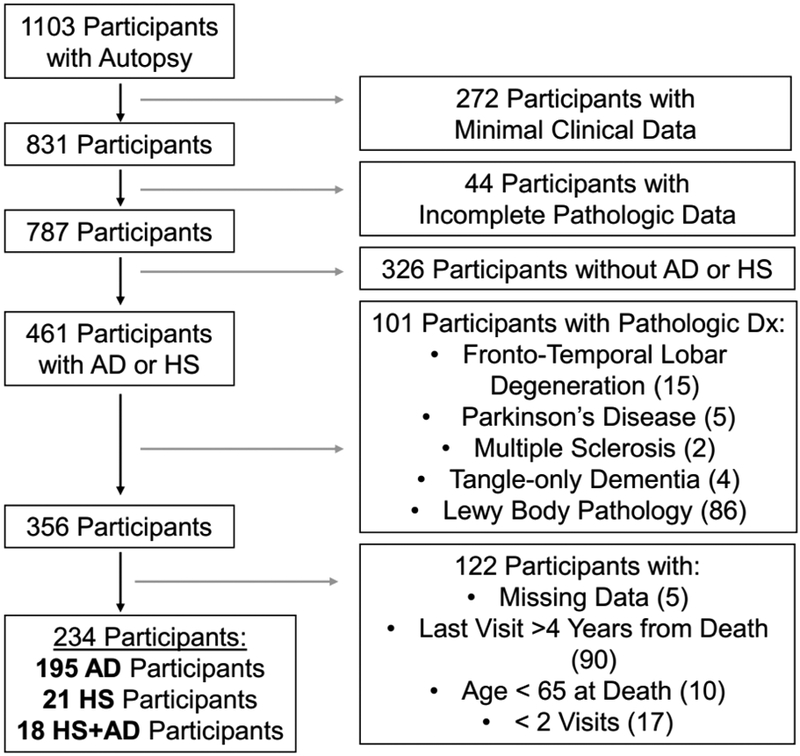
Flowchart of the identification of participants for this analysis from the brain bank at the UCSD Shiley-Marcos Alzheimer’s Disease Research Center. Exclusion criteria along with the number of subjects excluded, are presented at each stage of selection.
Table 1:
Participant Demographics and Pathology
| AD n = 195 |
AD + HS n = 18 |
HS n = 21 |
P Value | |
|---|---|---|---|---|
| Age at Last Visit, y, mean ± SD | 78.1 ± 7.1 | 84.9 ± 5.2 | 85.2 ± 7.0 | <.001 a,b |
| Age at Death, y, mean ± SD | 79.7 ± 7.0 | 86.6 ± 5.1 | 86.7 ± 7.1 | <.001 a,b |
| Last Visit to Death Interval, y, mean ± SD | 1.6 ± 1.0 | 1.6 ± 1.0 | 1.5 ± 0.9 | .89 |
| Age at Symptom Onset, y, mean ± SD | 70.3 ± 8.1 | 76.5 ± 5.9 | 78.3 ± 7.1 | <.001 a,b |
| Disease Duration, y, mean ± SD | 9.3 ± 3.6 | 10.3 ± 4.9 | 8.2 ± 3.6 | .25 |
| Education, y, mean ± SD | 14.7 ± 3.0 | 15.3 ± 2.4 | 15.3 ± 2.8 | .55 |
| Gender, n (%): | ||||
| Male | 115 (59%) | 9 (50%) | 14 (67%) | .60 |
| Female | 80 (41%) | 9 (50%) | 7 (33%) | |
| # Apo E4 Alleles*, n (%): | ||||
| 0 alleles | 65 (34%) | 4 (22%) | 12 (57%) | <.05 a |
| 1 alleles | 93 (48%) | 13 (72%) | 9 (43%) | |
| 2 alleles | 34 (18%) | 1 (6%) | 0 (0%) | |
| Clinical History, n (%): | ||||
| Hypertension | 100 (51%) | 9 (50%) | 12 (57%) | .87 |
| Diabetes | 20 (10%) | 0 (0%) | 4 (19%) | .13 |
| Stroke | 30 (15%) | 3 (17%) | 3 (14%) | .99 |
| Braak Stage, n (%): | <.001 a,b,c | |||
| I | - | - | 6 (29%) | |
| II | - | - | 2 (10%) | |
| III | - | - | 4 (20%) | |
| IV | - | - | 6 (29%) | |
| V | 65 (33%) | 13 (72%) | 1 (5%)# | |
| VI | 130 (67%) | 5 (28%) | 2 (10%)# | |
| CERAD Neuritic Plaque Score, n (%): | <.001 a,c | |||
| None | - | - | 6 (29%) | |
| Mild | - | - | 3 (14%) | |
| Moderate | 43 (22%) | 7 (39%) | 8 (38%) | |
| Severe | 152 (78 %) | 11 (61%) | 4 (19%) | |
| Vascular Pathology*, n (%): | ||||
| Arterial or Lacunar Infarct | 30 (16%) | 0 (0%) | 2 (10%) | .19 |
| Microinfarct | 15 (8%) | 3 (17%) | 6 (29%) | .008 a |
| Hemorrhage/Microbleed | 11 (6%) | 1 (6%) | 0 (0%) | .70 |
| Cerebral Amyloid Angiopathy (Moderate/Severe) | 121 (63%) | 12 (67%) | 8 (38%) | .08 |
| Arteriolosclerosis (Moderate/Severe) | 27 (18%) | 5 (42%) | 6 (35%) | .06 |
| At Least 1 of Above | 142 (73%) | 13 (72%) | 15 (71%) | .99 |
Abbreviations: AD = Alzheimer’s disease; HS = Hippocampal Sclerosis; MCI = Mild Cognitive Impairment; DLB = Dementia with Lewy Bodies; CDR = Clinical Dementia Rating; POD = Pfeffer Outpatient Disability scale
Missing data: APOE genotype (n = 4, 1.7%), Arterial or Lacunar Infarct (n = 2, <1%), Microinfarcts (n = 1, <1%), Hemorrhage or Microbleed (n = 1, <1%), Amyloid Angiopathy (n = 2, <1%), Arteriolosclerosis (n = 56, 24%)
Despite Braak Stages of V or VI, these 3 participants did not meet the diagnostic criteria for AD due to having “none” or “mild” CERAD neuritic plaque scores.
P Values from Fisher Exact or ANOVA tests as appropriate
Significant post-hoc pairwise comparison between HS and AD
Significant post-hoc pairwise comparison between HS+AD and AD
Significant post-hoc pairwise comparison between HS+AD and HS
2.3. Clinical Evaluation
Participants had annual standardized and detailed clinical, neurological, and neuropsychological assessments as previously described (Galasko et al., 1994; Salmon and Butters, 1992). Global cognitive function was assessed with the MMSE (Folstein et al., 1975) and the Dementia Rating Scale (DRS) (Mattis, 1988) including its subscales for Attention, Initiation, Conceptualization, Construction, and Memory. Memory was further assessed with the Wechsler Memory Scale (WMS) Visual Reproduction Test immediate and delayed recall (adaptation) (Russell, 1975), the WMS-R Logical Memory Test, the Consortium to Establish a Registry for Alzheimer’s Disease (CERAD) Word List Learning Test (Morris et al., 1988), and the California Verbal Learning Test (CVLT) (Delis et al., 1987). Language was assessed with the Boston Naming Test-30 item version (BNT) (Goodglass et al., 1983), the Letter Fluency Test (F-A-S) and the Category Fluency Test (“animals”, “fruits”, and “vegetables”) (Thurstone and Thurstone, 1941). Executive Function and Attention was assessed with the Modified Wisconsin Card Sorting Test (Nelson, 1976), Wechsler Adult Intelligence Scale-Revised (WAIS-R) Digit Symbol Substitution Test (Wechsler, 1987), Trail Making Test Parts A and B (measured as seconds/circle) (Reitan, 1958), WAIS-R Digit Span Test (Kaplan, 1983). Visuospatial Abilities were assessed with the Wechsler Intelligence Scale for Children-Revised (WISC-R) Block Design Test and the copy condition of the WMS Visual Reproduction Test. Functional impairment was assessed using the Pfeffer Outpatient Disability (POD) (Pfeffer et al., 1981) scale or the Functional Assessment Questionnaire (in which case, scores were converted to appropriate corresponding POD scores).
2.4. Neuropathological Evaluation
UCSD ADRC procedures at autopsy were as follows: the brain was divided sagittally, and the left hemibrain was fixed in 10% buffered formalin, while the right hemibrain was sectioned coronally and then frozen at −70°C in sealed plastic bags. Routinely, tissue blocks from the right hemibrain of the midfrontal, inferior parietal, and superior temporal cortices, primary visual cortex in the occipital cortex, hippocampus, basal ganglia, substantia nigra, and cerebellum were removed and placed in 2% paraformaldehyde for subsequent thick sectioning by vibratome. Tissue blocks adjacent to the ones described above were stored at −70°C for subsequent immunoblot analysis for synaptic proteins and Aβ species (soluble and oligomers). Vibratome sections (40 μm thick) were stored in cryoprotective medium at −20°C for subsequent immunochemical studies. The formalin-fixed left hemibrain was serially sectioned in 1 cm slices, and tissue blocks from the regions described above were processed for histopathological examination by H&E and Thioflavin-S (Thio-S) to detect tau and β-amyloid deposits.
Brains were staged for degree of neurofibrillary tangle pathology by one pathologist (L.A.H) using a modification of the Braak staging scheme (Hansen and Terry, 1997). Estimates of neuritic plaque density were calculated using methods recommended by CERAD (Mirra et al., 1991). To match previously published analyses comparing HS and AD (Brenowitz et al., 2014; Nelson et al., 2011), Alzheimer’s disease was operationalized using the NIA-Reagan consensus criteria for the postmortem diagnosis of AD, wherein Braak stage V-VI with moderately to severely dense neuritic plaques corresponds to “high likelihood” that dementia is due to AD. Hippocampal Sclerosis was pathologically defined as cell loss and gliosis in CA1 and the subiculum of the hippocampus, out of proportion to AD pathology.
Participant brains were assessed for cerebral amyloid angiopathy and cerebrovascular disease. The severity of cerebral amyloid angiopathy was assessed semiquantitatively on thioflavin-S–stained preparations of the midfrontal cortex, superior temporal gyrus, inferior parietal cortex, and posterior hippocampus using a four-point scale ranging from 0 to 3 (absent, mild, moderate, and severe), using a method previously described (Olichney et al, 1996). The severity of arteriolosclerosis was scored separately on a similar semiquantitative four-point scale. Both were dichotomized as moderate/severe versus absent/mild for the purposes of comparison. Other pathologies were grouped as (1) large arterial and lacunar infarcts, (2) cortical microinfarcts, and (3) hemorrhages and microbleeds, and were simply dichotomized as present or absent.
2.5. Reference Values
Reference values for each cognitive measure (presented as green shading on figures) were derived from a group of “robust” normal controls who were diagnosed as normal on their first evaluation and remained normal for the duration of their participation in the ADRC longitudinal study. There were 241 individual “robust” normal participants who completed a total of 1109 visits after age 65. Based on all of these visits, the “normal” reference range was defined as being within 1.5 standard deviations of the mean score for each measure. The “robust” normal participants were not used in any calculation, model, or statistics, but purely served as a visual reference to guide interpretation of results.
2.6. Statistical Methods
Demographics, clinical characteristics, and final cognitive performance were compared using a 3-group ANOVA for continuous variables, followed up by Tukey’s HSD post-hoc analysis for significant results, and a 3-group Fisher Exact Test for categorical variables, followed up by post-hoc pairwise Fisher Exact comparisons for significant results.
Trajectories of cognitive decline associated with AD and HS neuropathology were analyzed using data from the final visit and up to five prior annual evaluations covering a period of up to six years. This approach was chosen because starting at the first evaluation and moving forward is confounded by the variance in the clinical status of participants at entry into the study. With this approach, 100% of participants had data available at the last visit (by definition), 94% 1 year prior, 82% 2 years prior, 67% 3 years prior, 52% 4 years prior, and 38% 5 years prior. Data from a total of 1015 visits were available in this time window, with AD participants averaging 4.3 ± 1.4 visits, HS+AD averaging 4.8 ± 1.4, and HS averaging 4.0 ± 1.8 visits (p = 0.24).
Longitudinal linear mixed-effects models were used to assess how performance (expressed as raw scores) on each cognitive test declined with time to last evaluation. The participants’ performance was modeled with fixed effects of pathologically-confirmed diagnostic group, years of education, presence of an APOE ε4 allele, age at death, and interval from last evaluation to death, as well as each term’s interactions by time (expressed as inverse time in years from last visit). Participant specific intercepts and slopes were included as random effects, which are assumed to follow a normal distribution with unknown variance. To account for floor effects on some of the measures, data after the first score of 0 were dropped on a by-participant and by-test basis. Each continuous variable was centered. All contrasts were in reference to AD. This parameterization allows for the estimation of the predicted performance for an average participant (varying only the pathologic diagnosis) via the group term, as well as the longitudinal decline each year via the group by time interaction term. Each of the covariates (education, age at death, APOE ε4, and interval from last evaluation to death) is able to influence both the final performance as well as slope of decline.
All analyses were performed in R version 3.4.2 (R Core Team, 2013) using the lme4 package (Bates et al., 2014) with restricted maximal likelihood (REML) estimation. Degrees of freedom for the fixed effects were estimated by the Satterwaithe approximation as implemented in the package lmerTest (Kuznetsova et al., 2015).
3. Results
A total of 195 cases with autopsy-confirmed AD, 18 with HS+AD, and 21 with HS alone were identified (Table 1), and clinical data for the last visit (approximately 1.6 years prior to death for all groups; p = 0.89) and up to 5 additional prior annual visits were selected for modeling. Groups did not differ in gender distribution (p = 0.60) or education (p = 0.55). An APOE4 allele was present in 43% of HS cases, 66% of AD cases, and 78% of HS + AD cases (p = < 0.05), with a significant post-hoc difference only between pure HS and pure AD (adjusted p < 0.05). HS and HS + AD participants were older than pure AD participants by approximately 7 years at symptom onset (p < 0.001), last visit (p < 0.001), and death (p < 0.001). The groups did not differ in the prevalence of self-reported history of hypertension (p = 0.86), diabetes (p = 0.13), or stroke (p = 0.99). Of the vascular pathologies assessed at autopsy, only prevalence of microinfarcts significantly differed between groups, with a greater proportion of HS than AD participants affected on pairwise post-hoc testing (adjusted p < 0.05). However, the proportion of participants with at least one vascular pathology present was near 70% in all three groups (p = 0.99).
The consensus clinical diagnosis for participants in each group was Possible or Probable AD in over 85% of cases at the final visit (Table 2) and over 70% at the first visit used for modeling (Table 3). There were no differences between groups (p = 0.49 and p = 0.44 respectively). At the first modeled visit, the groups did not differ in the use of antidepressant medications, antipsychotic medications, or NMDA antagonists, although a higher proportion of the HS+AD than the AD group was taking acetylcholinesterase inhibitors (Table 3, adjusted p <0.05).
Table 2:
Global Cognitive Performance at Last Visit by Pathologic Diagnosis
| AD n = 195 |
AD + HS n = 18 |
HS n = 21 |
P Value | |
|---|---|---|---|---|
| Clinical Diagnosis at Last Visit, n (%): | ||||
| Prob/Poss AD | 173 (89%) | 17 (94%) | 18 (86%) | .49 |
| MCI | 2 (1%) | 0 (0%) | 1 (5%) | |
| DLB | 17 (9%) | 1 (6%) | 1 (5%) | |
| Other | 3 (1%) | 0 (0%) | 1 (5%) | |
| CDR at Last Visit*, n (%): | ||||
| 0 | 0 (0%) | 0 (0%) | 0 (0%) | <.001 a,c |
| 0.5 | 5 (4%) | 0 (0%) | 3 (21%) | |
| 1.0 | 15 (12%) | 3 (23%) | 7 (50%) | |
| 2.0 | 61 (49%) | 4 (31%) | 4 (29%) | |
| 3.0 | 44 (35%) | 6 (46%) | 0 (0%) | |
| POD at Last Visit*, mean ± SD: | 16.7 ± 3.9 | 18.0 ± 3.3 | 11.9 ± 6.3 | <.001 a,c |
| MMSE, mean ± SD (/30) | 10.5 ± 8.0 | 10.7 ± 7.7 | 18.4 ± 6.1 | < .001a,c |
| DRS Total, mean ± SD (/144) | 63.4 ± 37.9 | 59.7 ± 41.3 | 101.0 ± 26.1 | < .001 a,c |
| DRS Attention, mean ± SD (/37) | 23.2 ± 11.3 | 23.2 ± 12.2 | 32.5 ± 5.9 | .002 a,c |
| DRS Initiation, mean ± SD (/37) | 11.1 ± 9.8 | 11.0 ± 11.2 | 21.9 ± 9.6 | < .001 a,c |
| DRS Construction, mean ± SD (/6) | 2.2 ± 2.1 | 1.8 ± 1.6 | 4.1 ± 1.6 | < .001 a,c |
| DRS Conceptualization, mean ± SD (/39) | 19.7 ± 13.0 | 17.9 ± 13.6 | 30.5 ± 9.0 | 0.01 a,c |
| DRS Memory (/25) | 7.1 ± 4.8 | 5.7 ± 5.5 | 12.0 ± 4.9 | < .001 a,c |
Abbreviations: AD = Alzheimer’s disease; HS = Hippocampal Sclerosis; MMSE = Mini-Mental State Exam, DRS = Mattis Dementia Rating Scale.
Missing Data: CDR (n = 82, 35%), POD (n = 47, 20%)
P Values from Fisher Exact or ANOVA tests as appropriate
Significant post-hoc pairwise comparison between HS and AD
Significant post-hoc pairwise comparison between HS+AD and AD
Significant post-hoc pairwise comparison between HS+AD and HS
Table 3:
Global Cognitive Performance at First Modeled Visit by Pathologic Diagnosis
| AD n = 195 |
AD + HS n = 18 |
HS n = 21 |
P Value | |
|---|---|---|---|---|
| Interval from First Modeled Visit to Last Visit, y, mean ± SD | 4.0 ± 1.3 | 4.3 ± 1.2 | 4.1 ± 1.7 | .15 |
| Clinical Diagnosis at First Modeled Visit, n (%): | .44 | |||
| Cognitively Normal | 10 (5%) | 1 (6%) | 1 (5%) | |
| Prob/Poss AD | 161 (83%) | 15 (83%) | 15 (71%) | |
| MCI | 10 (5%) | 1 (6%) | 3 (14%) | |
| DLB | 7 (4%) | 1 (6%) | 0 (0%) | |
| Other | 7 (4%) | 0 (0%) | 2 (10%) | |
| CDR at Last Visit*, n (%): | ||||
| 0 | 4 (4%) | 0 (0%) | 1 (6%) | .04 c |
| 0.5 | 24 (23%) | 0 (0%) | 7 (41%) | |
| 1.0 | 63 (59%) | 11 (73%) | 9 (53%) | |
| 2.0 | 15 (14%) | 4 (27%) | 0 (0%) | |
| 3.0 | 0 (0%) | 0 (0%) | 0 (0%) | |
| Medications used*, n (%): | ||||
| AChE Inhibitors | 59 (30%) | 12 (67%) | 9 (43%) | .007 b |
| NMDA Antagonists | 9 (5%) | 3 (17%) | 0 (0%) | .06 |
| Antipsychotics | 10 (5%) | 1 (6%) | 0 (0%) | .68 |
| Antidepressants | 47 (24%) | 4 (22%) | 5 (24%) | .99 |
| POD at First Modeled Visit, mean ± SD | 10.2 ± 5.2 | 12.2 ± 5.7 | 7.4 ± 5.3 | .02 c |
| MMSE*, mean ± SD (/30) | 21.7 ± 5.4 | 22.1 ± 3.8 | 24.4 ± 2.5 | .07 |
| DRS Total*, mean ± SD (/144) | 112.2 ± 20.1 | 113.9 ± 12.4 | 121.7 ± 10.4 | .09 |
| DRS Attention, mean ± SD (/37) | 33.8 ± 3.9 | 35.3 ± 1.4 | 35.5 ± 1.5 | .06 |
| DRS Initiation, mean ± SD (/37) | 26.1 ± 7.8 | 26.4 ± 6.2 | 29.4 ± 5.2 | .17 |
| DRS Construction, mean ± SD (/6) | 4.6 ± 1.5 | 4.5 ± 1.2 | 4.8 ± 1.3 | .80 |
| DRS Conceptualization, mean ± SD (/39) | 33.0 ± 5.9 | 33.5 ± 3.4 | 34.2 ± 2.6 | .63 |
| DRS Memory (/25) | 14.6 ± 5.4 | 14.2 ± 5.3 | 17.8 ± 4.7 | .03 a |
Abbreviations: AD = Alzheimer’s disease; HS = Hippocampal Sclerosis; MMSE = Mini-Mental State Exam, DRS = Mattis Dementia Rating Scale.
Missing Data: MMSE (n = 3, 1 %), DRS (n = 8, 3%), Medications (n = 1, <1%), CDR (n = 95, 41%), POD (n = 14, 6%)
P Values from Fisher Exact or ANOVA tests as appropriate
Significant post-hoc pairwise comparison between HS and AD
Significant post-hoc pairwise comparison between HS+AD and AD
Significant post-hoc pairwise comparison between HS+AD and HS
3.1. Decline in Global Cognitive Measures
Our primary analysis used the MMSE and the Mattis DRS, which were the most commonly administered tests with the most complete data. At the last visit AD and HS+AD participants were more impaired than pure HS on these measures (Table 2, p < 0.01). Tukey’s post-hoc analysis revealed significant differences between HS and AD, as well as HS and HS+AD groups on every measure (adjusted p < 0.05), but no differences between AD and HS+AD.
Mixed effects linear regression was used to assess the trajectories of decline for the participants. All 3 groups exhibited decline over their last 5 years of evaluations (Figure 2A). For a demographically average individual with all else held constant, HS participants declined 3.3 ± 1.4 % of the maximal score per year slower than AD participants on the MMSE (p = 0.02), and 2.9 ± 1.2 % slower on the total Mattis DRS (p = 0.02).
Figure 2: Trajectories of Global Cognitive Decline by Pathologic Diagnosis.
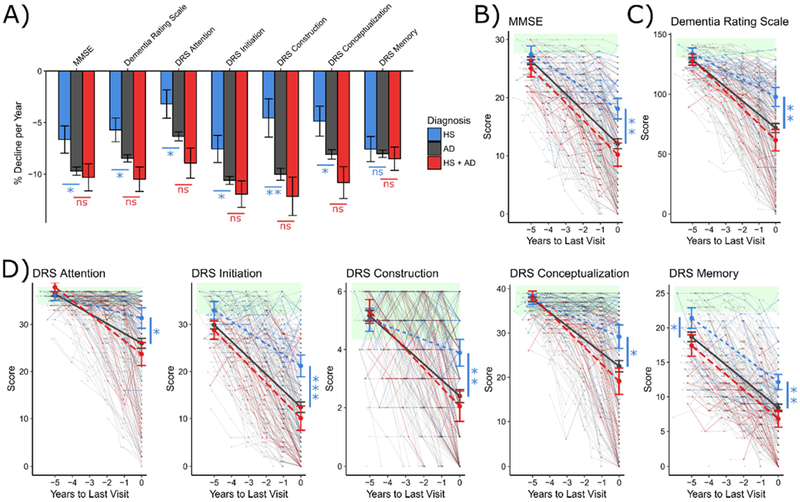
Linear mixed modeling of the trajectories of cognitive decline due to Hippocampal Sclerosis (blue), Alzheimer’s disease (grey), or both pathologies (red). Average rates of cognitive decline per year (expressed as percentage of maximal score), stratified by eventual pathology, are presented for each cognitive measure (A). Spaghetti plots of data used for modeling, overlaid with model predictions in bold are presented for the MMSE (B), total DRS (C), and each of the DRS subscales (D). Green shading represents the reference range for normal performance, defined as being within 1.5 standard deviations of mean performance of ADRC robust normal controls. Comparisons of modeled performance (in reference to AD) were made at last visit and 5 years prior. *p < .05; **p < .01; ***p < .001 as calculated using the Satterwaithe approximation for degrees of freedom.
The DRS includes 5 subdomains, that assess Attention, Initiation, Conceptualization, Construction, and Memory. HS participants declined 3.1 ± 1.4 % (p = 0.03) slower per year on Attention, 3.1 ± 1.3 % (p = 0.02) slower on Initiation, 5.4 ± 1.9% (p = 0.004) slower on Construction, and 3.5 ± 1.5 % (p = 0.02) slower on Conceptualization. HS did not differ from AD in rate of decline on the Memory subscale (p = 0.51). The mixed HS+AD group did not differ from pure AD on any DRS subscale.
The model predictions (Figure 2B – 2D), plotted over the raw data, indicate that at their final visit all groups were impaired relative to the reference range of scores obtained from cognitively intact control participants (green shading), with AD and HS+AD more severely impaired than HS on all measures (all p < 0.05). 5 years prior to their final visit, all 3 groups were near the normal range on all measures except DRS Memory, which was significantly more impaired in AD than in HS (p = 0.03). A similar pattern is observed when actual scores from the first modelled visit were examined (Table 3; HS > AD on DRS Memory, p < 0.03).
3.2. Decline in Domain Specific Cognitive Tests
As a secondary analysis, we explored trajectories of decline on specific cognitive measures that had data available for at least 50% of visits, using the same model parameterizations. Because most of these measures had less complete data than the MMSE and DRS, models were underpowered to detect differences in slope - instead, inferences are drawn from model predictions at specific time points (Figure 3).
Figure 3: Trajectories of Cognitive Decline on Domain-Specific Measures by Pathologic Diagnosis.
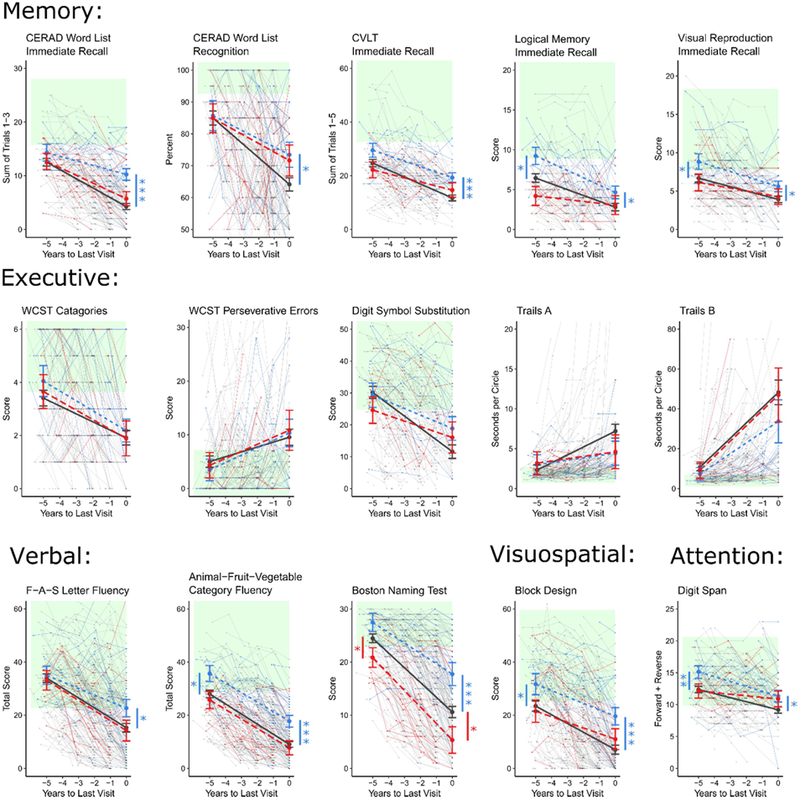
Linear mixed modeling of decline in domain-specific measures due to Hippocampal Sclerosis (blue), Alzheimer’s disease (grey), or both pathologies (red). Green shading represents the reference range for normal performance, defined as being within 1.5 standard deviations of mean performance of ADRC robust normal controls. Comparisons of modeled performance (in reference to AD) were made at last visit and 5 years prior. *p < .05; **p < .01; ***p < .001 as calculated using the Satterwaithe approximation for degrees of freedom.
Memory was assessed using the CERAD Word List (available for 66% of visits), the California Verbal Learning Test (52% of visits), Visual Reproduction Test (56% of visits), and the Logical Memory Test (56% of visits). The CERAD Word List Immediate Recall had sufficient data to demonstrate a significant 2.8 ± 1.1 % slower decline in HS participants compared to AD participants (p = 0.01). At the final visit, HS participants were significantly less impaired than AD participants on all five memory measures (all p < 0.05). 5 years prior to final visit, HS were significantly less impaired than AD only on Logical Memory immediate recall (p < 0.01) and Visual Reproduction Test immediate recall (p < 0.01). These groups showed comparable performance on CERAD Word List immediate recall and recognition, as well as CVLT immediate recall, at this earlier time point. The delayed recall conditions of these tests were at floor for participants in all 3 groups and could not be modeled.
Attention was assessed using the Digit Span test (58% of visits). HS participants performed significantly better than AD participants at both the final visit (p < 0.05) and 5 years prior (p < 0.01).
Executive function was assessed using the Digit Symbol Substitution test (53% of visits), the Wisconsin Card Sorting Test (53% of visits), and the Trail Making Test Parts A and B (56% of visits). HS, AD, and HS+AD participants did not differ in performance on these measures at any time point.
Visuospatial ability, assessed via the Block Design test (82% of visits), was less impaired in HS than AD at the final visit (p < 0.001) and 5 years prior (p < 0.05).
Language was assessed using Verbal Fluency (85% of visits) and the Boston Naming Test (86% of visits). At the final visit, HS participants performed significantly better than AD participants on the Category Fluency test (p < 0.001), the F-A-S Letter Fluency test (p < 0.05), and the Boston Naming Test (p < 0.01); however, 5 years prior, they performed better only on the Category Fluency test (p < 0.05).
3.3. Trajectories of Functional Impairment
In addition to less severe cognitive impairment, HS participants were also less functionally impaired at their final evaluation than either AD or HS+AD as judged both by their global Clinical Dementia Rating (CDR) score (p < 0.001) and their Pfeffer Outpatient Disability (POD) scale score (p < 0.001) (Table 2). HS were also less impaired than HS+AD on the CDR and POD at the first modeled visit (Table 3, both p < 0.05). Our longitudinal modeling approach applied to POD scores (available for 86% of visits) demonstrated nearly identical slopes of increasing functional impairment across groups, with HS participants significantly less impaired than AD participants at both final visit (p < 0.001) and 5 years prior (p < 0.05). HS+AD participants were also more impaired than AD participants at the final visit (p< 0.05).
3.4. Age-Matched Validation
When we repeated the above analyses with a subset of AD participants matched for age to the HS and HS+AD participants, the pattern of findings was unchanged for all global cognitive and functional tests (data not shown). Results in domain-specific measures were also similar, although with fewer significant effects due to a reduced number of participants in the models.
4. Discussion
We examined the profiles of cognitive decline in 234 participants with longitudinal neuropsychological testing who had neuropathologically confirmed diagnoses of HS, AD, or both (HS+AD) and no other neurodegenerative pathologies that could account for cognitive decline. Consistent with previously published work (Brenowitz et al., 2014; Leverenz et al., 2002), participants with HS were less functionally and cognitively impaired than those with AD or HS+AD proximal to death (Table 2). Less cognitive impairment at the last visit apparently reflects slower decline in HS than AD since the groups showed comparable performance 5 years prior on both the MMSE and DRS global cognitive measures (Figure 1). A similar pattern was observed on the DRS Attention, Initiation, Conceptualization, and Construction subscales. DRS Memory subscale performance, in contrast, showed similar slopes of decline for HS and AD, but with a persistent longitudinal profile of less severe memory impairment in HS.
Longitudinal performance on domain-specific neuropsychological tests showed that HS produced a slower rate of decline than AD on measures of language (BNT, FAS fluency) and memory for word lists (i.e., CERAD Word List, CVLT). In each case, the HS and AD groups did not differ 5 years prior to the final visit, but HS were less impaired than AD at the last visit. HS and AD declined at similar rates on two additional memory tests (i.e., Visual Reproduction and Logical Memory) and tests of category fluency, attention (Digit Span) and visuospatial ability (Block Design), even though HS were less impaired than AD on these measures overall (i.e., less impaired both 5 years prior to the last visit and at the last visit). There was no difference in overall impairment or rate of decline on tests of executive function (i.e., Digit Symbol Substitution, Trail Making Test parts A and B); the HS and AD groups did not differ 5 years prior to the last visit or at the last visit.
Performance on individual neuropsychological tests 5 years prior to the final visit provides a look at the differential effects of early HS and AD pathology on various cognitive processes at a time when global mental status is equivalent and near normal levels in the two groups. Despite comparable impairment on the CVLT and CERAD Word List memory tests at that point, AD was more impaired than HS on the immediate recall conditions of the Logical Memory and Visual Reproduction tests (see Figure 2). This discrepancy suggests that these later two tasks engage cognitive processes beyond episodic memory that may be affected more prominently in early AD than in early HS. One possibility, for example, is that the Logical Memory test engages both memory and semantic processing (since the story provides a semantic structure), and language deficits are greater in early AD than in early HS. This is consistent with our finding that AD was more impaired than HS on category fluency but not letter fluency tests, a pattern that is thought to reflect a semantic language deficit (Monsch et al., 1994). Similarly, the Visual Reproduction test may engage both memory and visuospatial abilities (to process the geometric forms), and visuospatial deficits are greater, as shown by our results with the Block Design test, in early AD than in early HS.
A number of our findings are consistent with previous cross-sectional studies that have compared patterns of cognitive deficits in HS and AD. As reported by Corey-Bloom et al. (1997), we found that performance on tests of attention and visuospatial abilities were less impaired in HS than in AD throughout the course of disease. Consistent with Nelson et al. (2011), we found that 5 years prior to the last visit HS were less impaired than AD on the category fluency test, while the two groups were equally impaired on the CERAD Word List memory test, although we used the immediate recall condition while Nelson et al. used delayed recall. This pattern was not maintained over time, however, as HS showed slower decline than AD on the CERAD memory test and declined at the same rate as AD on the category fluency test, thus causing the ratio of CERAD memory (either immediate or delayed) to category fluency to not differ in HS and AD in the later stages of disease. In contrast to Corey-Bloom et al. (1997) and other investigators (Leverenz et al., 2002), we did not detect differences on measures of executive function at any time point.
Our findings indicate that HS is a progressive pathological process that results in gradual cognitive decline, albeit at a rate slower than in AD. The involvement of all cognitive domains in HS suggests that the effects of HS pathology are not localized to the hippocampus, as the name might imply, but likely involve diffuse neocortical regions either directly or through disruption of networks that support the affected cognitive functions. Worse deficits in AD than HS on tasks that require visuospatial and semantic processing may reflect greater disruption of fronto-temporal semantic (Binder and Desai, 2011; Mascali et al., 2018) and occipito-parietal visual networks (Deng et al., 2016) that are known to be altered by AD. In contrast, the striking similarity in performance of HS and AD on five measures from three different tests of executive function indicates that HS results in similar disruptions to frontal executive networks as AD. Indeed, these executive measures are the only measures to not demonstrate less impairment in HS at the final visit, suggesting that relative to the levels of impairment in other cognitive functions, executive deficits may actually be more prominent in HS than AD.
Despite some of the group differences we observed at various time points in the course of disease, the overall similarity of cognitive impairments between HS and AD makes it difficult to confidently distinguish these pathologies on clinical grounds alone. As Nelson et al. (2011) suggest, the overlap in the distribution of scores on those cognitive measures that did show group differences means that no measure tested had the discriminatory power necessary for individual classification.
Some investigators suggest that the presence of dementia with a clinical and cognitive profile consistent with AD and neuroimaging evidence of neurodegeneration in an elderly person (e.g., over age 80), but in the absence of positive PET-imaging or CSF biomarkers of amyloid or tau pathology, suggests the presence of HS (Botha et al., 2018). However, without a positive biomarker for HS, such a diagnosis must remain speculative and may rise only to the level of “probable” or “possible” HS. A pattern of circumscribed medial temporal lobe hypometabolism on FDG PET imaging has been proposed as a potential marker of HS (Botha et al., 2018) but has yet to be validated. The presence of the TDP-43 protein has been proposed as a possible pathological marker of the disease, but there is considerable overlap in TDP-43 deposition across AD and other neurodegenerative diseases (e.g., Amyotrophic Lateral Sclerosis, Fronto-Temporal Lobar Degeneration), and there is currently no PET imaging ligand or CSF marker to measure TDP-43 deposition in the brain. Our results, in conjunction with those of Nelson et al. (2011), show that the pattern of cognitive deficits at a single time point may provide some supportive positive evidence for the diagnosis of HS, but this does not rise to the level where it would be useful for identifying an individual patient, and any diagnostic utility of the pattern may depend upon the stage of disease. Without a positive biomarker of HS pathology, it will remain very difficult to differentiate the disease from AD.
We observed very few differences between AD and HS+AD on cognitive measures in terms of overall severity or rate of decline. These results suggest that the contributions of the two pathologies to the development of dementia are not simply additive. Since the AD and AD+HS groups had a similar degree of AD pathology (i.e., all were Braak stage V-VI and had moderate to severe neuritic plaque density), the addition of HS pathology might be expected to increase the severity of cognitive impairment or the rate of cognitive decline, but this was not the case. The interpretation of these results is limited, however, as the temporal order of onset of the pathologies is not known, and HS+AD were more likely than AD participants to be taking acetylcholinesterase inhibitors at the first modeled visit. The only measure that demonstrated a difference between AD and HS+AD was the Boston Naming Test, traditionally considered a measure of cortical (rather than hippocampal) function. This is further evidence for the wide-ranging effects of HS on cognitive functions beyond those thought to be regulated by the hippocampus.
Strengths of this work include the relatively large numbers of participants compared to most previous studies, the longitudinal nature of the analysis, and the consistency of neuropsychological, clinical, and pathological evaluation. We report performance on a broad range of well-established cognitive instruments, allowing comparison to existing literature. Additionally, when we restricted the analysis to AD participants that were age-matched to HS, the results were essentially unchanged.
There are also some limitations. First, previous work suggests that HS occurs unilaterally in some cases, yet the ADRC neuropathology protocol assesses only the left hemisphere. Second, given the legacy nature of this study, TDP-43 immunostaining was not routinely performed at the time of autopsy for the vast majority of cases. Though TDP-43 protein inclusions in the hippocampus have been reported in 70 - 90% of HS cases (Leverenz et al., 2002; Nelson et al., 2011), this has proved to be a non-specific pathological marker for HS that also occurs in 20 - 60% of cases with pure AD (Amador-Ortiz et al., 2007; Josephs et al., 2014), and is not part of the diagnostic criteria for either disease. Furthermore, a recent study examining the effects of neural pathologies on cognition found that TDP-43 and HS pathologies independently affect distinct cognitive domains, suggesting that they may not be manifestations of the same pathologic process (Wilson et al., 2013). Nonetheless, the association of TDP-43 with cognitive decline is intriguing (both in the context of HS and dementia in general), and we will examine the complex relationship between TDP-43 and cognition in future studies.
5. Conclusion
HS and AD both result in progressive impairments in all cognitive domains, although HS generally appears to decline at a slower rate. Compared to HS, AD disproportionally affects semantic and visuospatial abilities at an early stage of overall cognitive impairment. In contrast, by the final evaluation, HS demonstrated less impairment in all domains except executive function. Yet despite these group-level differences, the differing trajectories of decline and the extensive overlap in cross-sectional scores between groups meant that no cognitive measure had the discriminatory power to differentiate HS and AD clinically.
Both Hippocampal Sclerosis (HS) and Alzheimer’s disease (AD) show progressive cognitive decline
HS declines slower than AD on measures of global cognitive function
Early AD demonstrates more pronounced deficit in semantic and visuospatial processes
At last evaluation HS was less impaired in all domains except executive function
No single cognitive measure is able to reliably differentiate HS and AD
Acknowledgements
This work was supported by the UCSD Medical Scientist Training Program through NIH/NIGMS Training Grant 5 T32 GM007198, and the Shiley-Marcos Alzheimer’s Disease Research Center through NIH AG05131.
Footnotes
Publisher's Disclaimer: This is a PDF file of an unedited manuscript that has been accepted for publication. As a service to our customers we are providing this early version of the manuscript. The manuscript will undergo copyediting, typesetting, and review of the resulting proof before it is published in its final citable form. Please note that during the production process errors may be discovered which could affect the content, and all legal disclaimers that apply to the journal pertain.
Disclosures
Mr. Smirnov reports no disclosures. Dr. Galasko serves as editor for Alzheimer’s Research and Therapy, and as a paid consultant on Data Safety Monitoring Boards for Pfizer, Inc., Elan, Inc., and Balance Pharmaceuticals, Inc. Dr. Hansen reports no disclosures. Dr. Edland serves as a paid consultant on Data Safety Monitoring Boards for Lilly USA, LLC and Suven Life Sciences Ltd. Dr. Brewer has served on advisory boards for Elan, Bristol-Myers Squibb, Avanir, Novartis, Genentech, and Eli Lilly and holds stock options in CorTechs Labs, Inc and Human Longevity, Inc. Dr. Salmon serves as a consultant for Takeda Pharmaceuticals, Inc.
References:
- Amador-Ortiz C, Lin W, Ahmed Z, Personett D, Davies P, Duara R, Graff-Radford N, Hutton M, Dickson D, 2007. TDP-43 immunoreactivity in hippocampal sclerosis and Alzheimer’s disease. Annals of Neurology 61, 435–445. 10.1002/ana.21154 [DOI] [PMC free article] [PubMed] [Google Scholar]
- Bates D, Maechler M, Bolker B, Walker S, 2014. lme4: Linear mixed-effects models using Eigen and S4. R package version 1. [Google Scholar]
- Binder JR, Desai RH, 2011. The neurobiology of semantic memory. Trends in cognitive sciences 15, 527–536. https://doi.org/10.1016%2Fj.tics.2011.10.001 [DOI] [PMC free article] [PubMed] [Google Scholar]
- Botha H, Mantyh W, Murray M, Knopman D, Przybelski S, Wiste H, Graff-Radford J, Josephs K, Schwarz C, Kremers W, Boeve B, Petersen R, Machulda M, Parisi J, Dickson D, Lowe V, Jack C, Jones D, 2018. FDG-PET in tau-negative amnestic dementia resembles that of autopsy-proven hippocampal sclerosis. Brain J Neurology 141, 1201–1217. 10.1093/brain/awy049 [DOI] [PMC free article] [PubMed] [Google Scholar]
- Brenowitz W, Monsell S, Schmitt F, Kukull W, Nelson P, 2014. Hippocampal sclerosis of aging is a key Alzheimer’s disease mimic: clinical-pathologic correlations and comparisons with both alzheimer’s disease and non-tauopathic frontotemporal lobar degeneration. Journal of Alzheimer’s disease : JAD 39, 691–702. 10.3233/JAD-131880 [DOI] [PMC free article] [PubMed] [Google Scholar]
- Corey-Bloom J, Sabbagh M, Bondi M, Hansen L, Alford M, Masliah E, Thal L, 1997. Hippocampal sclerosis contributes to dementia in the elderly. Neurology 48, 154–60. 10.1212/WNL.48.1.154 [DOI] [PubMed] [Google Scholar]
- Delis D, Kramer J, Kaplan E, Thompkins O, 1987. CVLT: California verbal learning test-adult version: manual. Psychological Corporation. [Google Scholar]
- Deng Y, Shi L, Lei Y, Wang D, Initiative A, 2016. Altered topological organization of high-level visual networks in Alzheimer’s disease and mild cognitive impairment patients. Neurosci Lett 630, 147–153. 10.1016/j.neulet.2016.07.043 [DOI] [PubMed] [Google Scholar]
- Dickson D, Davies P, Bevona C, Van Hoeven KH, Factor SM, Grober E, Aronson M, Crystal H 1994. Hippocampal sclerosis: a common pathological feature of dementia in very old (≥ 80 years of age) humans. Acta Neuropathol 88, 212–221. 10.1007/BF00293396 [DOI] [PubMed] [Google Scholar]
- Folstein M, Folstein S, McHugh P, 1975. “Mini-mental state”: a practical method for grading the cognitive state of patients for the clinician. Journal of Psychiatric Research 12, 189–198. 10.1016/0022-3956(75)90026-6 [DOI] [PubMed] [Google Scholar]
- Galasko D, Hansen L, Katzman R, Wiederholt W, Masliah E, Terry R, Hill L, Lessin P, Thal L, 1994. Clinical-Neuropathological Correlations in Alzheimer’s Disease and Related Dementias. Arch Neurol-chicago 51, 888–895. 10.1001/archneur.1994.00540210060013 [DOI] [PubMed] [Google Scholar]
- Goodglass H, Kaplan E, Weintraub S, 1983. Boston naming test. Philadelphia: Lea & Febiger; 2. [Google Scholar]
- Hansen L, Terry R, 1997. Position Paper on Diagnostic Criteria for Alzheimer Disease. Neurobiol Aging 18, S71–S73. 10.1016/s0197-4580(97)00073-0 [DOI] [PubMed] [Google Scholar]
- Jellinger K, 1994. Hippocampal sclerosis: a common pathological feature of dementia in very old humans. Acta neuropathologica 88, 599–599. [DOI] [PubMed] [Google Scholar]
- Josephs K, Murray M, Whitwell J, Parisi J, Petrucelli L, Jack C, Petersen R, Dickson D, 2014. Staging TDP-43 pathology in Alzheimer’s disease. Acta Neuropathologica 127, 441–50. 10.1007/s00401-013-1211-9 [DOI] [PMC free article] [PubMed] [Google Scholar]
- Kaplan E, 1983. The assessment of aphasia and related disorders. Vol 2 Lippincott Williams & Wilkins. [Google Scholar]
- Kuznetsova A, Brockhoff P, Christensen R, 2015. Package ‘lmerTest.’ R package version 2. [Google Scholar]
- Leverenz J, Agustin C, Tsuang D, Peskind E, Edland S, Nochlin D, DiGiacomo L, Bowen J, McCormick W, Teri L, Raskind M, Kukull W, Larson E, 2002. Clinical and Neuropathological Characteristics of Hippocampal Sclerosis: A Community-Based Study. Arch Neurol-chicago 59, 1099–1106. 10.1001/archneur.59.7.1099 [DOI] [PubMed] [Google Scholar]
- Mascali D, DiNuzzo M, Serra L, Mangia S, Maraviglia B, Bozzali M, Giove F, 2018. Disruption of Semantic Network in Mild Alzheimer’s Disease Revealed by Resting-State fMRI. Neuroscience 371. [DOI] [PMC free article] [PubMed] [Google Scholar]
- Mattis S, 1988. Dementia rating scale (DRS). Odessa, FL: Psychological Assessment Resources. [Google Scholar]
- Mirra S, Heyman A, McKeel D, Sumi, Crain B, Brownlee L, Vogel F, Hughes J, Belle G, Berg L, 1991. The Consortium to Establish a Registry for Alzheimer’s Disease (CERAD). Part II. Standardization of the neuropathologic assessment of Alzheimer’s disease. Neurology 41, 479–86. 10.1212/wnl.41.4.479 [DOI] [PubMed] [Google Scholar]
- Monsch AU, Bondi MW, Butters N, Paulsen JS, Salmon DP, Brugger P, Swenson MR, 1994. A comparison of category and letter fluency in Alzheimer’s disease and Huntington’s disease. Neuropsychology 8, 25 10.1037/0894-4105.8.1.25 [DOI] [Google Scholar]
- Morris J, Mohs R, Rogers H, Fillenbaum G, Heyman A, 1988. Consortium to establish a registry for Alzheimer’s disease (CERAD) clinical and neuropsychological assessment of Alzheimer’s disease. Psychopharmacol Bull 24, 641–52. [PubMed] [Google Scholar]
- Murray ME, Cannon A, Graff-Radford NR, Liesinger AM, Rutherford NJ, Ross OA, Duara R, Carrasquillo MM, Rademakers R, Dickson DW, 2014. Differential clinicopathologic and genetic features of late-onset amnestic dementias. Acta Neuropathol 128, 411–421. 10.1007/s00401-014-1302-2 [DOI] [PMC free article] [PubMed] [Google Scholar]
- Nag S, Yu L, Capuano A, Wilson R, Leurgans S, Bennett D, Schneider J, 2015. Hippocampal sclerosis and TDP-43 pathology in aging and Alzheimer disease. Ann Neurol 77, 942–952. 10.1002/ana.24388 [DOI] [PMC free article] [PubMed] [Google Scholar]
- Nelson H, 1976. A Modified Card Sorting Test Sensitive to Frontal Lobe Defects. Cortex 12, 313–324. 10.1016/s0010-9452(76)80035-4 [DOI] [PubMed] [Google Scholar]
- Nelson P, Schmitt F, Lin Y, Abner E, Jicha G, Patel E, Thomason P, Neltner J, Smith C, Santacruz K, Sonnen J, Poon L, Gearing M, Green R, Woodard J, Eldik L, Kryscio R, 2011. Hippocampal sclerosis in advanced age: clinical and pathological features. Brain 134, 1506–1518. 10.1093/brain/awr053 [DOI] [PMC free article] [PubMed] [Google Scholar]
- Nelson P, Smith C, Abner E, Wilfred B, Wang W, Neltner J, Baker M, Fardo D, Kryscio R, Scheff S, Jicha G, Jellinger K, LJV E, Schmitt F, 2013. Hippocampal sclerosis of aging, a prevalent and high-morbidity brain disease. Acta Neuropathologica 126, 161–177. 10.1007/s00401-013-1154-1 [DOI] [PMC free article] [PubMed] [Google Scholar]
- Nelson P, Trojanowski J, Abner E, Al-Janabi O, Jicha G, Schmitt F, Smith C, Fardo D, Wang W, Kryscio R, Neltner J, Kukull W, Cykowski, Eldik L, Ighodaro E, 2016. “New Old Pathologies”: AD, PART, and Cerebral Age-Related TDP-43 With Sclerosis (CARTS). Journal of neuropathology and experimental neurology 75, 482–98. 10.1093/jnen/nlw033 [DOI] [PMC free article] [PubMed] [Google Scholar]
- Neltner J, Abner E, Baker S, Schmitt F, Kryscio R, Jicha G, Smith C, Hammack E, Kukull W, Brenowitz W, LJV E, Nelson P, 2014. Arteriolosclerosis that affects multiple brain regions is linked to hippocampal sclerosis of ageing. Brain: a journal of neurology 137, 255–67. 10.1093/brain/awt318 [DOI] [PMC free article] [PubMed] [Google Scholar]
- Olichney J, Hansen L, Galasko D, Saitoh T, Hofstetter C, Katzman R, Thal L, 1996. The apolipoprotein E epsilon 4 allele is associated with increased neuritic plaques and cerebral amyloid angiopathy in Alzheimer's disease and Lewy body variant. Neurology 47, 190–196. 10.1212/WNL.47.1.190 [DOI] [PubMed] [Google Scholar]
- Pfeffer R, Kurosaki T, Harrah C, Chance J, Bates D, Detels R, Filos S, Butzke C, 1981. A survey diagnostic tool for senile dementia. Am J Epidemiol 114, 515–27. 10.1093/oxfordjournals.aje.a113217 [DOI] [PubMed] [Google Scholar]
- Reitan R, 1958. Validity of the Trail Making Test as an Indicator of Organic Brain Damage. Percept Motor Skill 8, 271–276. 10.2466/pms.1958.8.3.271 [DOI] [Google Scholar]
- Russell E, 1975. A multiple scoring method for the assessment of complex memory functions. Journal of Consulting and Clinical Psychology 43, 800. [Google Scholar]
- Salmon D, Butters N, 1992. Neuropsychological assessment of dementia in the elderly Principles of geriatric neurology. Philadelphia: FA Davis 144. [Google Scholar]
- R Core Team. 2013. R: A language and environment for statistical computing. https://www.R-project.org
- Thurstone L, Thurstone T, 1941. Factorial studies of intelligence. Psychometric monographs. [Google Scholar]
- Wechsler D, 1984. WMS-R: Wechsler memory scale-revised: manual. Psychological Corporation. [Google Scholar]
- Wilson R, Yu L, Trojanowski J, Chen E, Boyle P, Bennett D, Schneider J, 2013. TDP-43 pathology, cognitive decline, and dementia in old age. JAMA neurology 70, 1418–24. 10.1001/jamaneurol.2013.3961 [DOI] [PMC free article] [PubMed] [Google Scholar]
- Zarow C, Sitzer T, Chui H, 2008. Understanding hippocampal sclerosis in the elderly: epidemiology, characterization, and diagnostic issues. Current neurology and neuroscience reports 8, 363–70. 10.1007/s11910-008-0057-3 [DOI] [PubMed] [Google Scholar]
- Zarow C, Weiner M, Ellis W, Chui H, 2012. Prevalence, laterality, and comorbidity of hippocampal sclerosis in an autopsy sample. Brain and Behavior 2, 435–442. 10.1002/brb3.66 [DOI] [PMC free article] [PubMed] [Google Scholar]