Abstract
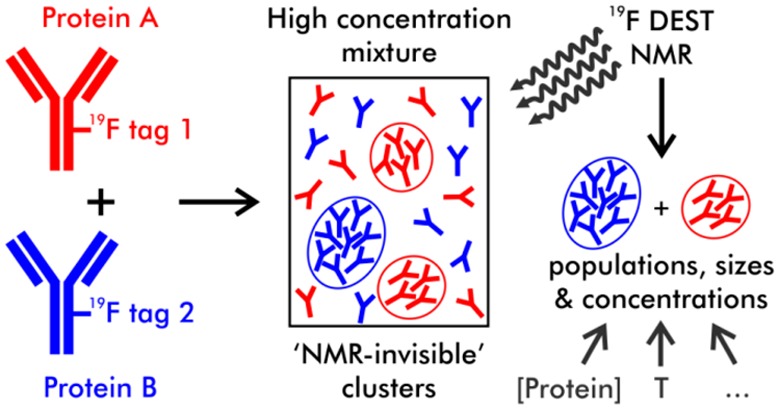
Proteins frequently exist as high-concentration mixtures, both in biological environments and increasingly in biopharmaceutical co-formulations. Such crowded conditions promote protein–protein interactions, potentially leading to formation of protein clusters, aggregation, and phase separation. Characterizing these interactions and processes in situ in high-concentration mixtures is challenging due to the complexity and heterogeneity of such systems. Here we demonstrate the application of the dark-state exchange saturation transfer (DEST) NMR technique to a mixture of two differentially 19F-labeled 145 kDa monoclonal antibodies (mAbs) to assess reversible temperature-dependent formation of small and large protein-specific clusters at concentrations up to 400 mg/mL. 19F DEST allowed quantitative protein-specific characterization of the cluster populations and sizes for both mAbs in the mixture under a range of conditions. Additives such as arginine glutamate and NaCl also had protein-specific effects on the dark-state populations and cluster characteristics. Notably, both mAbs appear to largely exist as separate self-associated clusters, which mechanistically respond differently to changes in solution conditions. We show that for mixtures of differentially 19F-labeled proteins DEST NMR can characterize clustering in a protein-specific manner, offering unique tracking of clustering pathways and a means to understand and control them.
Proteins in biological environments are often part of complex mixtures at high concentration. Such conditions lead to macromolecular crowding and increased protein–protein interactions, which may be involved in normal or aberrant biological processes.1−3 Understanding molecular mechanisms of protein-specific clustering is needed in diverse areas of science ranging from biopharmaceutical development to cell biology and biotechnology. For example, in biopharmaceuticals such as monoclonal antibodies (mAbs), which constitute a large and rapidly growing section of the pharmaceutical market,4,5 there is considerable interest in formulating at high concentrations (≥100 mg/mL)6−8 and/or as co-formulations of two or more proteins.9,10 However, high concentrations may promote formation of reversible and irreversible oligomers, aggregates, and clusters.11−13
Assessing protein stability and interactions in situ in high-concentration mixtures is non-trivial for both biopharmaceutical formulations14,15 and biological mixtures. Standard biophysical techniques, such as dynamic or static light scattering (DLS or SLS) and analytical ultracentrifugation (AUC), often do not permit measurements at such high concentrations.16 Characterization becomes even more challenging for mixtures and co-formulations, where proteins mixed together may undergo both self- and cross-interactions.9,10
Extrinsic differential labeling of proteins with 19F tags was recently suggested for monitoring the behavior of individual mAbs in high-concentration mixtures in situ by 19F NMR, using diffusion ordered spectroscopy (DOSY) and relaxation experiments.17 Proteins can be labeled using a variety of 19F tags,18 with even proteins as large as mAbs giving rise to strong, well-resolved signals in the 19F spectrum.17
Increases in protein concentration in solution do not always result in a concomitant increase in NMR signal intensity. This situation has been explained by concentration-dependent self-association, with consequential increase of protein oligomer size and so broadening of its signals.17,19,20 Large self-associated species undergo such rapid transverse relaxation that they are no longer visible in a conventional NMR spectrum, and so can be described as existing in an NMR-invisible “dark state”. The size and populations of these dark-state species under various conditions may be used for understanding molecular mechanisms of cluster formation:11 for biopharmaceuticals, for example, these would serve as useful criteria for designing successful formulations which minimize aggregate formation.
One NMR technique used to study dark states is dark-state exchange saturation transfer (DEST).21−23 This technique exploits the principle that the rapid transverse relaxation rates of the NMR dark state results in very broad NMR signals. Therefore, selective radiofrequency saturation applied offset from the visible NMR signal will saturate only the dark state. However, if the dark state undergoes exchange with the observable monomer or lower-oligomer species, saturation will transfer to the NMR visible state, leading to signal attenuation. Mapping of this signal attenuation at numerous offsets allows quantitative characterization of the dark state.22,23
DEST is typically conducted on 15N or 13C nuclei in isotopically labeled proteins,22−24 but such labeling is impractical for mAbs produced in mammalian cells on an industrial scale25 and not possible for proteins purified from biological samples. 1H DEST on unlabeled proteins is hindered by spin diffusion, complicating quantitative analysis.26
Here we demonstrate that the DEST technique can be applied to proteins as large as 145 kDa mAbs in mixtures if they are labeled extrinsically with 19F tags. We investigate by 19F DEST and other NMR techniques a co-formulation of two differentially 19F-labeled mAbs known to associate reversibly at high concentrations under a range of conditions, including variable temperature and concentration, and in the presence of excipients. We show that 19F DEST enables us to quantify formation of individual types of protein clusters co-existing in highly concentrated mixtures, providing a measurable parameter to understand the mechanism of protein-specific cluster formation and the potential ability to control the size distribution and concentration of clusters using various additives.
Materials and Methods
19F Labeling
The monoclonal IgG antibody samples (mAb2, MW = 144.8 kDa, pI = 8.44 and COE19, MW 148 kDa, pI = 7.4) used in this study were supplied by MedImmune Ltd., Cambridge, UK, and have previously been described.17,20,27 Two 19F labels were used here: TFBPD (1-(4-(trifluoromethyl)benzyl)-1H-pyrrole-2,5-dione), which was custom synthesized by Charnwood Molecular Ltd., Loughborough, UK, and TFCS (N-(ε-trifluoroacetylcaproyloxy)succinimide ester)28,29 supplied by Fisher Scientific, Cat. no. 22299. The mAbs were diluted from a supplied concentration of 45 mg/mL in citrate buffer to 5 mg/mL by addition of pH 7.2 100 mM sodium phosphate buffer. TFBPD and TFCS labeling was carried out following the previously reported procedure for these mAbs,17 with overall labeling efficiencies varying batch-to-batch between 100% and 200% (i.e., an average of 1–2 tags per protein molecule). Protein concentrations were measured based on optical density (OD) at 280 nm (extinction coefficients of mAb2 and COE19 are 1.435 and 1.780 mL mg–1cm–1, respectively). For extremely high (400 mg/mL) mAb concentrations, samples were diluted prior to OD measurement.
NMR Experimental Details
NMR experiments were carried out on a Bruker 500 MHz Avance III spectrometer using a QCI-F cryoprobe with cooled 1H and 19F channels and sample temperature control unit. The NMR buffer used throughout was 100 mM pH 5.5 sodium acetate buffer with 10% (v/v) D2O. Spectra were processed and analyzed using Topspin 2.5 and Dynamics Centre 2.4.8.
DEST experiments were conducted with continuous-wave (CW) saturation of 1.0 s duration at three (50, 100, and 200 Hz) saturation field strengths (γB1) for simultaneous fitting. DEST experiments were conducted as pseudo-2D experiments, with CW saturation applied at 31 offset frequencies between −50 and +50 kHz from the frequency carrier position set at the observable 19F signal.
Longitudinal relaxation times (T1) for 19F were measured using a standard Bruker inversion recovery sequence (t1ir). Translational diffusion coefficients (DL) were collected using diffusion ordered spectroscopy (DOSY) by stimulated echo- pulsed-field gradient pulse program stebpgp1s19 from Bruker’s standard library adapted for 19F. The diffusion time (Δ) and the gradient length (δ) were set to 200 and 2 ms, respectively.
19F transverse relaxation rates (R2) were measured using a combination of modified Bruker Carr–Purcell–Meiboom–Gil (CPMG)l sequences.30 Examples of decay curves from these experiments are shown in Figure S1 in the Supporting Information.
DEST Data Fitting and Protein Cluster Size Analysis
Experimental DEST profiles22 were fitted to a two-state model describing exchange between an NMR-visible state A (reporting on monomeric or lower-oligomeric species) and an NMR-invisible dark state B (reporting on large protein clusters):
where kABapp is the apparent on rate and kBA is the off rate.21−23 The DEST effect for this two-state system was modeled using an homogeneous form of the Bloch–McConnell equations,31 as shown in the Supporting Information, Figure S2, taking into account lifetime line broadening derived from relaxation rate R2 measured at each condition, following the well-established protocols.21−23 The analysis reveals the fractions and relaxation rates of the visible monomeric and dark states present in solution (PA = Pvis and PB = Pdark, and R2A and R2, respectively), as well as kABapp and kBA rates for each protein separately.
For variable temperature DEST analysis, first the transverse relaxation rates of the reference monomeric species R2rm were measured at 313 K in diluted samples (<5 mg/mL) of isolated proteins (3.47 ± 0.27, 38.6 ± 0.03, 3.66 ± 0.29, and 46.5 ± 0.02 s–1 for mAb2-TFCS, mAb2-TFBPD, COE19-TFCS, and COE19-TFBPD, respectively). Control DEST experiments for these samples did not reveal any measurable dark-state populations. R2 is proportional to the rotational correlation time τC of a particle with effective radius reff, calculated according to Stokes’s equation:
| 1 |
where k is the Boltzmann constant, η is viscosity, and T is absolute temperature. The values of R2A = R2 at lower temperature were re-calculated to compensate for slowing molecular tumbling and increased water viscosity32 as
| 2 |
where ηT and ηref are water viscosities at temperature T and reference temperature Tref = 313 K, respectively. The effective radius of dark-state clusters reffcluster at temperature T was derived from the apparent relaxation rate of dark state B (R2(T) = R2dark(T)) as
| 3 |
where rmon is the radius of monomeric mAb, taken as 5 nm.17
Effective mAb radii for visible species (reffvis) were calculated directly from measured diffusion coefficients DL using the Stokes–Einstein equation, combined with a correction for the effects of molecular crowding:17,33,34
| 4 |
where φ is the total volume fraction of the proteins in solution assuming a protein density factor of 1.25 g/mL.33,35
Results
To assess whether DEST effects could be observed in 19F-tagged mAbs, two equimolar mAb mixtures were prepared, one consisting of COE19-TFBPD with mAb2-TFCS and a second with the 19F tags reversed (i.e., COE19-TFCS mixed with mAb2-TFBPD). Data were collected at two different concentrations (160 and 400 mg/mL total) and across a range of temperatures rising from 277 to 313 K. At each condition 19F NMR spectra were collected, measuring translational diffusion coefficients DL (to capture the sizes of the visible species), as well as observed relaxation rates (R1 and R2obs) and DEST spectra for full DEST fitting, taking into account lifetime line broadening, for each mAb represented by their 19F tags. A typical example of a DEST profile fitted to the two-state model is shown in Figure 1. Further examples are shown in the Supporting Information, Figure S3, with fitted rate constants shown in Figure S4.
Figure 1.
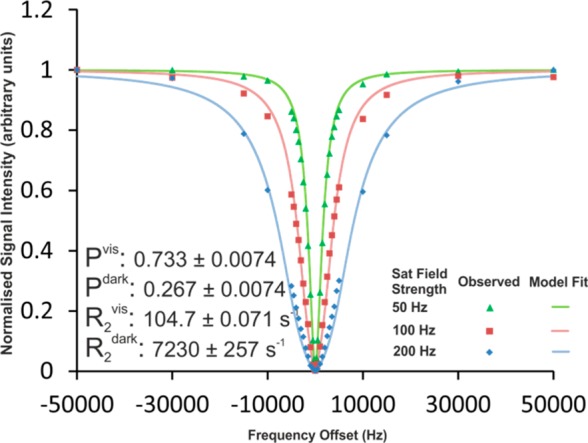
Example of DEST profiles for mAb2-TFBPD in an equimolar mixture with COE19-TFCS (total concentration 160 mg/mL). Data were collected at 277 K at three saturation field strengths and fitted simultaneously to minimize the combined residuals. Markers indicate the measured data points, while the continuous lines show the calculated DEST profiles from the model fitted to them.
It was noted that 19F signal losses and signal broadening at low temperatures were much greater for both mAbs when tagged with TFBPD than for the same mAbs tagged with TFCS. This effect is clearly visible in the 1D 19F spectra (Supporting Information, Figure S5) and in the observed different characteristic ranges for transverse relaxation values R2obs for TFCS and TFBPD tags when attached to mAbs (Figure 2). This difference can be explained by the relative differences in the tag length and flexibility (structures shown in the Supporting Information, Figure S5). TFCS contains a long, flexible alkyl linker and attaches to lysine side chains, giving the fluorine moiety considerable freedom to move relative to the attached protein. TFBPD is more rigid and attaches to the shorter cysteine side chain, resulting in a faster relaxation rate. TFCS with its greater mobility will remain NMR visible even when attached to relatively large clusters, for which the signal of the less mobile TFBPD would have already been lost to the NMR dark state. We hypothesized that the two tags would essentially report on different size ranges of associates, both in visible and in dark states. When using the TFCS tag only the very large mAb clusters would have a high enough R2 to be in the NMR dark state, with most of the smaller oligomers remaining in the visible fraction, which can be then observed for example by DOSY. When using the TFBPD tag more of the smaller oligomers will be in the dark state rather than the visible. In order to explore this further, we analyzed how the distributions of the visible and dark-state populations depend on temperature and concentration of mAbs (Figure 3).
Figure 2.
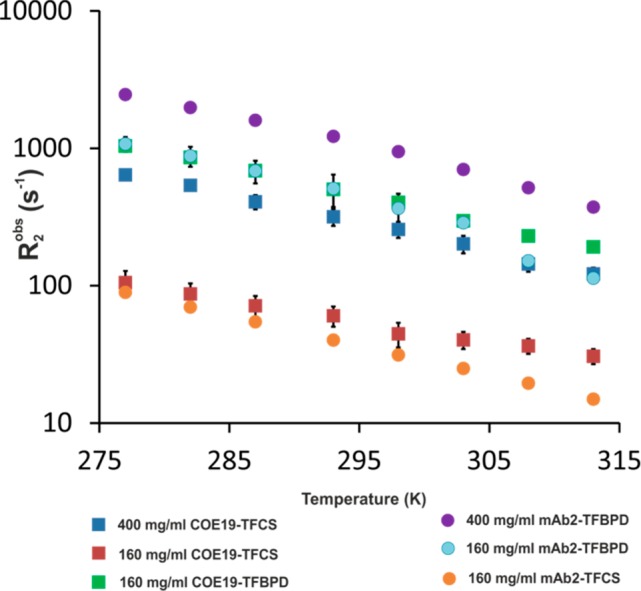
Temperature dependence of observed effective transverse relaxation rate (R2obs) for two mAb-tag combinations (COE19-TFBPD/mAb2-TFCS and COE19-TFCS/mAb2-TFBPD) in equimolar mixtures at different concentrations.
Figure 3.
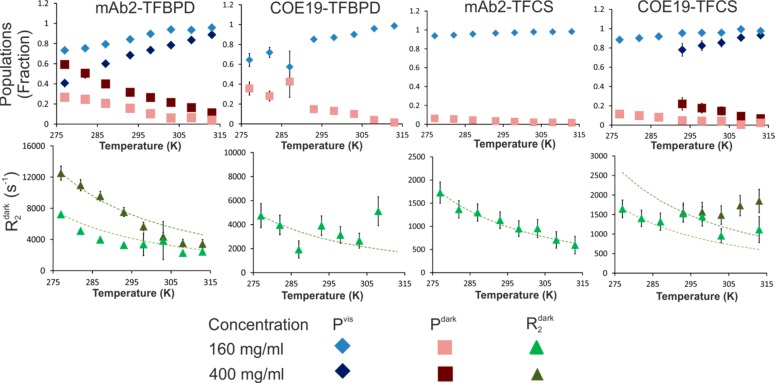
DEST data for all four mAb-tag combinations for temperatures from 277 to 313 K. Upper row shows the variation of the visible population and the dark-state population. Lower row shows relaxation rate R2dark. The green dashed guidelines show the projected change in R2 based solely on the effects of temperature and viscosity. Data were obtained in the samples containing equimolar mixtures of labeled mAbs as shown, at total concentrations of 160 mg/mL, with selected data available for 400 mg/mL mixed sample. Error bars are present for all data points, but for some values are smaller than the markers shown. Where Pdark ≈ 0, the value of R2dark is not defined, and therefore it is not shown for these points.
As hypothesized, the dark-state populations are significantly larger for each mAb when tagged with TFBPD than with TFCS (Figure 3). The data show that for TFCS-tagged mAbs a wider range of apparent cluster sizes remains in the visible state. With the same tags used, COE19 is consistently much more represented in the dark-state population than mAb2 at each condition, revealing its greater aggregation propensity. Both mAbs show a consistent decrease in the populations of their dark-state species at higher temperature and an increase in the dark state at higher concentration (Figure 3). The data suggest that formation of large dark-state protein clusters is exacerbated by low temperature and increased concentration; however, different antibodies in the mixture are affected to varying extents.
Effects of Temperature and Concentration on Apparent Radius of mAbs
The dependencies of the fitted relaxation rates R2dark on temperature are dominated by the expected change in water viscosity. The deviations from this expected trend can be interpreted as changes in the effective size of the dark-state clusters. This allows calculation of a nominal effective radius of protein clusters in this dark state23 (shown in Figure 4) and comparison to the effective radii reff calculated from the translational diffusion coefficients DL (Supporting Information, Figure S6), which reflect the apparent size of the smaller mAb oligomers still visible in the NMR spectra. It can be seen that DEST consistently reports a larger effective radius reffcluster for the dark-state clusters when using the TFCS tag compared to the TFBPD tag, in agreement with our hypothesis that the TFBPD dark state includes smaller oligomers than the TFCS dark state for a given protein. The translational diffusion data, which report on the visible oligomeric species, consistently report cluster sizes larger than expected for a monomer (ca. 5 nm).
Figure 4.
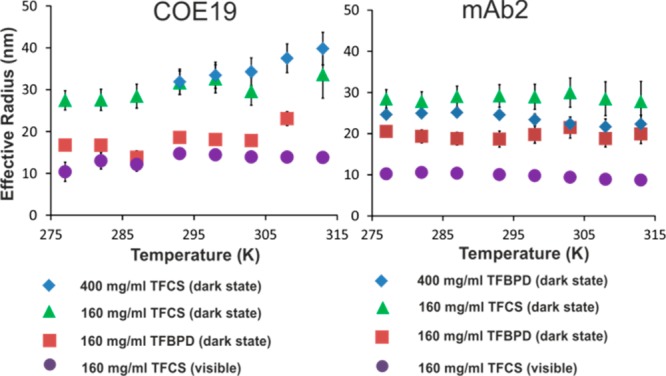
Temperature dependence of effective radii of the mAb visible oligomers reffvis and dark-state clusters reff in the mixed samples of COE19 and mAb2 labeled with different tags.
We can estimate the concentration of dark-state clusters for each data set (Figure 5). The apparent concentrations of large dark-state clusters for TFCS-tagged mAbs are much lower than for TFBPD-tagged mAbs. Both mAbs show an increased cluster concentration at higher protein concentration and at lower temperature; however, the nominal concentration of such clusters for each mAb is very small (<10 μM) when compared with the mAb concentration (1.3 mM). Interestingly, at lower temperature an increase in the number of large COE19 clusters (Figure 5) is accompanied by a reduction in their size (Figure 4). In contrast for mAb2, while the number of large clusters increases at lower temperatures, their size remains constant.
Figure 5.
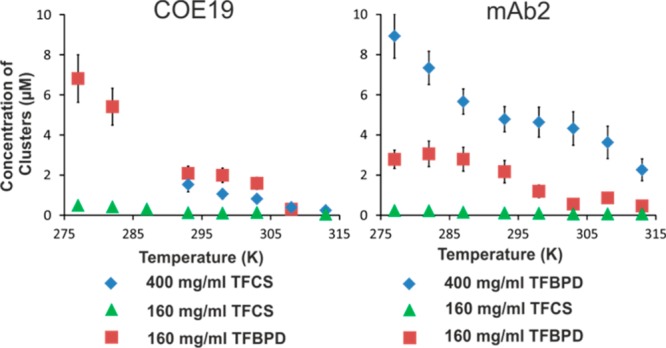
Calculated effective concentrations of dark-state clusters for COE19 and mAb2 derived from the dark-state populations and cluster radii.
Effects of Additives—Excipients, Salt, and Denaturant
19F DEST can be used to investigate the effect of additives on disrupting the dark-state mAb clusters, detecting reductions in cluster size, cluster concentration, or both. Detailed understanding of protein-specific clustering mechanisms and effects of excipients would therefore require quantification of both the sizes and concentrations of protein clusters. An equimolar mixture of l-arginine and l-glutamate (Arg·Glu) has been reported to reduce aggregation of mAbs and other proteins.19,27,36 Adding salt (NaCl) can potentially promote or disrupt aggregation controlled by the balance between electrostatic and hydrophobic interactions.37−39 The effects of these additives on dark-state clusters in COE19-mAb2 mixtures are summarized in Table 1.
Table 1. Effects of Additives on Dark-State Clusters of COE19 and mAb2 Observed at 277 Ka.
| mAb-tag combination | additive | additive concn (M) | Pdark (fraction) | R2dark (s–1) | kBA (s–1) | reffcluster (nm) | cluster concn (μM) |
|---|---|---|---|---|---|---|---|
| Sample I | |||||||
| COE19-TFCS | Arg·Glu | 0 | 0.14 ± 0.02 | 1400 ± 200 | 900 ± 100 | 26.4 ± 1.2 | 0.7 ± 0.2 |
| COE19-TFCS | Arg·Glu | 0.200 | 0.08 ± 0.01 | 1200 ± 200 | 900 ± 200 | 24.4 ± 1.3 | 0.5 ± 0.2 |
| mAb2-TFBPD | Arg·Glu | 0 | 0.30 ± 0.02 | 6500 ± 600 | 2500 ± 200 | 19.8 ± 0.6 | 3.5 ± 0.6 |
| mAb2-TFBPD | Arg·Glu | 0.200 | 0.27 ± 0.03 | 4000 ± 500 | 2400 ± 300 | 16.8 ± 0.7 | 5.1 ± 1.4 |
| Sample II | |||||||
| COE19-TFCS | NaCl | 0 | 0.20 ± 0.03 | 1300 ± 200 | 800 ± 200 | 25.3 ± 1.4 | 1.1 ± 0.4 |
| COE19-TFCS | NaCl | 0.150 | 0.10 ± 0.01 | 2000 ± 300 | 1800 ± 400 | 29.4 ± 1.6 | 0.3 ± 0.1 |
| mAb2-TFBPD | NaCl | 0 | 0.33 ± 0.02 | 8000 ± 700 | 2500 ± 200 | 21.2 ± 0.6 | 3.2 ± 0.5 |
| mAb2-TFBPD | NaCl | 0.150 | 0.30 ± 0.02 | 8600 ± 700 | 3300 ± 200 | 21.7 ± 0.6 | 2.6 ± 0.4 |
The two samples (I and II) contained equimolar mixtures (160 mg/mL total) of COE19 and mAb2 labeled as shown. The measurements were performed for each sample before and after pre-measured lyophilized additives were added at the specified concentration. Those pairs showing absolute differences in observed values which are greater than the sum of the correspondent standard deviations are highlighted in boldface italic type.
Generally, the effect of additives such as Arg·Glu and NaCl is mAb-specific. Arg·Glu does reduce the dark-state population for COE19 while showing a weak trend in reducing both its cluster size and concentration. For mAb2 in the same mixed sample, the overall dark-state population does not change noticeably; however, the relaxation rate of the dark state R2dark is reduced, suggesting that the cluster size for mAb2 becomes smaller, at the expense of having slightly more clusters. Adding NaCl reduces the dark-state population for COE19 but has little effect on mAb2. R2 for COE19 increases, implying some increase in the average cluster size, which is, however, accompanied by drastic reduction in the overall concentration of these large clusters. The greater sensitivity of COE19 to the solvent conditions fits with earlier observations that COE19 is more prone to self-association and generally has lower solubility, and hence is more problematic than mAb2.17 Addition of denaturant (GdnHCl) completely removed the dark-state populations for both COE19 and mAb2 in the control sample, converting both proteins to an entirely monomeric and unfolded state (see Supporting Information, Figure S7).
Discussion
Understanding the effects of external stimuli such as temperature or changes in solution conditions on protein-specific clustering at high concentrations is extremely challenging in heterogeneous solutions containing several protein components. Whether the clusters are formed by a mixture of proteins, or if each protein tends to be part of its own homogeneous cluster, cannot be easily deduced from traditional measurements such as light scattering. 19F DEST NMR described here, in combination with the differential labeling strategy proposed previously,17 allows detection and quantification of dark-state aggregates for multiple proteins simultaneously and independently in the same sample. The analysis can then show if the observed proteins become part of the same cluster, in which case they should both experience joint tumbling, or different clusters of substantially different size. Even if proteins do not interact with each other tightly to form functional biological complexes, under extremely high concentrations and in crowded conditions, weak cross-interactions between proteins become as important as self-interactions.
Large cluster formation may lead to unwanted mAb solution opalescence, and identifying which components of the mixture are responsible would be important.40 Here we studied cluster formation in a mixture of two mAbs at high concentration, up to 400 mg/mL. We found no evidence for uniformly mixed clusters composed of both proteins, in either the dark state or the visible state (which will include some low oligomers). The protein cluster sizes showed different tendencies, with both large and small COE19 cluster radii increasing with temperature, whereas for mAb2 radii remained the same for large clusters but reduced slightly for the smaller NMR-visible clusters (Figure 4). The concentrations of the large dark-state clusters generally increased at low temperature for both mAbs (Figure 5). The clusters of these two mAbs also responded differently to the addition of Arg·Glu and NaCl (Table 1). These observations reveal that different mAbs in the mixture may respond differently to the external stimuli and change of conditions. 19F DEST allows the clustering properties of different proteins to be observed even when they are mixed together at very high concentration, allowing straightforward testing of conditions and excipients, without signal interference from any other unlabeled sample constituents. Although in our studies we have not observed that addition of relatively small 19F-tags affects association properties of large protein molecules such as mAbs,17 appropriate care should be taken in new systems studied.
Different 19F tags, depending on their length and flexibility, enable us to sample slightly different characteristic sizes of protein clusters. This would allow fine-tuning the nature of the tag to the requirements of the system. For example when investigating very large slow-tumbling proteins a longer tag (such as TFCS) will still provide a useful reporter signal.
Conclusions
This study has demonstrated that novel 19F DEST analysis enables detection and characterization of different types of large NMR-invisible clusters formed reversibly by differentially tagged mAbs at high concentration. Selection of 19F tags with differing inherent flexibility and transverse relaxation rates allows sampling of different cluster sizes. Use of 19F differential labeling allows working with large proteins (e.g., the 145 kDa antibodies tested here) and complex solutions without any interference from background signals. This is particularly relevant when it is necessary to study mAb mixtures at ultra-high concentrations (up to 400 mg/mL), for example, in drug product stability testing. The results suggest that instead of engaging in uniformly mixed clusters, IgG proteins mAb2 and COE19 are involved in more homogeneous large self-assemblies which co-exist in solution at relatively low concentrations, and which respond somewhat differently to external stimuli, such as temperature or additives. The measurable parameters thus allow us to reveal the mechanisms of protein-specific reversible cluster formation in complex concentrated mixtures and fine-tune the conditions to achieve the required solution properties, such as minimal overall aggregation and solution viscosity. The proposed approach could be used to study the onset of phenomena such as aggregation, opalescence, and liquid–liquid phase separation in any protein mixture.
Acknowledgments
J.M.E. was funded by MedImmune Ltd, part of AstraZeneca plc. J.E.B. was funded by CASE DTP Ph.D. studentship BB/M011208/1 from the UK Biotechnology and Biological Sciences Research Council (BBSRC) in partnership with MedImmune Ltd. We are grateful to Professors Jeremy Derrick and Alan Dickson, and Jiali Du (MedImmune) for useful discussions, to Dr. Matthew Cliff for help with pulse sequence programming and for looking after the NMR Facility, and to the Marius Clore and Vincenzo Venditti groups, and Vitali Tugarinov for sharing sample DEST fitting scripts.
Supporting Information Available
The Supporting Information is available free of charge on the ACS Publications website at DOI: 10.1021/acs.analchem.9b00143.
Figure S1, examples of signal intensity decay curves used for measurement of extremely rapid R2 relaxation; Figure S2, Bloch–McConnell matrix used to model the DEST effect for exchange between NMR–visible and dark states; Figure S3, examples of DEST model fitted to experimental data; Figure S4, effects of temperature on calculated rate constants (kAB and kBA) for self-association of the mAbs; Figure S5, comparison of the 19F NMR spectra of TFCS and TFBPD at low and high temperature; Figure S6: effects of temperature on diffusion coefficients (DL); and Figure S7, fitted DEST data for a control experiment of mAbs denatured with 6 M GdnHCl (PDF)
Pulse sequence for 19F DEST experiment and the MATLAB DEST fitting script with example data (ZIP)
Author Contributions
∥ J.M.E. and J.E.B. contributed equally.
The authors declare no competing financial interest.
Supplementary Material
References
- Kuznetsova I. M.; Turoverov K. K.; Uversky V. N. What Macromolecular Crowding Can Do to a Protein. Int. J. Mol. Sci. 2014, 15 (12), 23090–23140. 10.3390/ijms151223090. [DOI] [PMC free article] [PubMed] [Google Scholar]
- Hyman A. A.; Weber C. A.; Juelicher F. Liquid-Liquid Phase Separation in Biology. Annu. Rev. Cell Dev. Biol. 2014, 30, 39–58. 10.1146/annurev-cellbio-100913-013325. [DOI] [PubMed] [Google Scholar]
- Theillet F. X.; Binolfi A.; Frembgen-Kesner T.; Hingorani K.; Sarkar M.; Kyne C.; Li C. G.; Crowley P. B.; Gierasch L.; Pielak G. J.; Elcock A. H.; Gershenson A.; Selenko P. Physicochemical Properties of Cells and Their Effects on Intrinsically Disordered Proteins (IDPs). Chem. Rev. 2014, 114 (13), 6661–6714. 10.1021/cr400695p. [DOI] [PMC free article] [PubMed] [Google Scholar]
- Ecker D. M.; Jones S. D.; Levine H. L. The therapeutic monoclonal antibody market. MAbs 2015, 7 (1), 9–14. 10.4161/19420862.2015.989042. [DOI] [PMC free article] [PubMed] [Google Scholar]
- Elvin J. G.; Couston R. G.; van der Walle C. F. Therapeutic antibodies: market considerations, disease targets and bioprocessing. Int. J. Pharm. 2013, 440 (1), 83–98. 10.1016/j.ijpharm.2011.12.039. [DOI] [PubMed] [Google Scholar]
- Shpilberg O.; Jackisch C. Subcutaneous administration of rituximab (MabThera) and trastuzumab (Herceptin) using hyaluronidase. Br. J. Cancer 2013, 109 (6), 1556–61. 10.1038/bjc.2013.371. [DOI] [PMC free article] [PubMed] [Google Scholar]
- Garidel P.; Kuhn A. B.; Schafer L. V.; Karow-Zwick A. R.; Blech M. High-concentration protein formulations: How high is high?. Eur. J. Pharm. Biopharm. 2017, 119, 353–360. 10.1016/j.ejpb.2017.06.029. [DOI] [PubMed] [Google Scholar]
- Turner M. R.; Balu-Iyer S. V. Challenges and Opportunities for the Subcutaneous Delivery of Therapeutic Proteins. J. Pharm. Sci. 2018, 107 (5), 1247–1260. 10.1016/j.xphs.2018.01.007. [DOI] [PMC free article] [PubMed] [Google Scholar]
- Robak T. The emerging therapeutic role of antibody mixtures. Expert Opin. Biol. Ther. 2013, 13 (7), 953–958. 10.1517/14712598.2013.799133. [DOI] [PubMed] [Google Scholar]
- Rasmussen S. K.; Naested H.; Muller C.; Tolstrup A. B.; Frandsen T. P. Recombinant antibody mixtures: Production strategies and cost considerations. Arch. Biochem. Biophys. 2012, 526 (2), 139–145. 10.1016/j.abb.2012.07.001. [DOI] [PubMed] [Google Scholar]
- Stradner A.; Sedgwick H.; Cardinaux F.; Poon W. C.; Egelhaaf S. U.; Schurtenberger P. Equilibrium cluster formation in concentrated protein solutions and colloids. Nature 2004, 432 (7016), 492–5. 10.1038/nature03109. [DOI] [PubMed] [Google Scholar]
- Yearley E. J.; Godfrin P. D.; Perevozchikova T.; Zhang H.; Falus P.; Porcar L.; Nagao M.; Curtis J. E.; Gawande P.; Taing R.; Zarraga I. E.; Wagner N. J.; Liu Y. Observation of small cluster formation in concentrated monoclonal antibody solutions and its implications to solution viscosity. Biophys. J. 2014, 106 (8), 1763–70. 10.1016/j.bpj.2014.02.036. [DOI] [PMC free article] [PubMed] [Google Scholar]
- Rao G.; Iyer V.; Kosloski M. P.; Pisal D. S.; Shin E.; Middaugh C. R.; Balu-Iyer S. V. Use of a Folding Model and In Situ Spectroscopic Techniques for Rational Formulation Development and Stability Testing of Monoclonal Antibody Therapeutics. J. Pharm. Sci. 2010, 99 (4), 1697–1706. 10.1002/jps.21938. [DOI] [PMC free article] [PubMed] [Google Scholar]
- Wuchner K.; Buchler J.; Spycher R.; Dalmonte P.; Volkin D. B. Development of a Microflow Digital Imaging Assay to Characterize Protein Particulates During Storage of a High Concentration IgG1Monoclonal Antibody Formulation. J. Pharm. Sci. 2010, 99 (8), 3343–3361. 10.1002/jps.22123. [DOI] [PubMed] [Google Scholar]
- Shire S. J.; Liu J.; Friess W.; Jörg S.; Mahler H.-C., High-Concentration Antibody Formulations. In Formulation and Process Development Strategies for Manufacturing Biopharmaceuticals; Jameel F., Hershenson S., Eds.; Wiley: Hoboken, NJ, 2010; Part II, Chap. 15. [Google Scholar]
- Fischer K.; Schmidt M. Pitfalls and novel applications of particle sizing by dynamic light scattering. Biomaterials 2016, 98, 79–91. 10.1016/j.biomaterials.2016.05.003. [DOI] [PubMed] [Google Scholar]
- Edwards J. M.; Derrick J. P.; van der Walle C. F.; Golovanov A. P. (19)F NMR as a Tool for Monitoring Individual Differentially Labeled Proteins in Complex Mixtures. Mol. Pharmaceutics 2018, 15 (7), 2785–2796. 10.1021/acs.molpharmaceut.8b00282. [DOI] [PubMed] [Google Scholar]
- Mehta V. D.; Kulkarni P. V.; Mason R. P.; Constantinescu A.; Antich P. P. Fluorinated Proteins as New F-19 Magnetic-Resonance-Imaging and Spectroscopy Agents. Abstr. Pap. Am. Chem. Soc. 1992, 204, 166-Medi. [DOI] [PubMed] [Google Scholar]
- Kheddo P.; Cliff M. J.; Uddin S.; van der Walle C. F.; Golovanov A. P. Characterizing monoclonal antibody formulations in arginine glutamate solutions using H-1 NMR spectroscopy. Mabs 2016, 8 (7), 1245–1258. 10.1080/19420862.2016.1214786. [DOI] [PMC free article] [PubMed] [Google Scholar]
- Kheddo P.; Bramham J. E.; Dearman R. J.; Uddin S.; van der Walle C. F.; Golovanov A. P. Investigating Liquid-Liquid Phase Separation of a Monoclonal Antibody Using Solution-State NMR Spectroscopy: Effect of Arg.Glu and Arg.HCl. Mol. Pharmaceutics 2017, 14 (8), 2852–2860. 10.1021/acs.molpharmaceut.7b00418. [DOI] [PubMed] [Google Scholar]
- Fawzi N. L.; Ying J. F.; Ghirlando R.; Torchia D. A.; Clore G. M. Atomic-resolution dynamics on the surface of amyloid-beta protofibrils probed by solution NMR. Nature 2011, 480 (7376), 268–U161. 10.1038/nature10577. [DOI] [PMC free article] [PubMed] [Google Scholar]
- Fawzi N. L.; Ying J. F.; Torchia D. A.; Clore G. M. Probing exchange kinetics and atomic resolution dynamics in high-molecular-weight complexes using dark-state exchange saturation transfer NMR spectroscopy. Nat. Protoc. 2012, 7 (8), 1523–1533. 10.1038/nprot.2012.077. [DOI] [PMC free article] [PubMed] [Google Scholar]
- Anthis N. J.; Clore G. M. Visualizing transient dark states by NMR spectroscopy. Q. Rev. Biophys. 2015, 48 (1), 35–116. 10.1017/S0033583514000122. [DOI] [PMC free article] [PubMed] [Google Scholar]
- Fawzi N. L.; Libich D. S.; Ying J. F.; Tugarinov V.; Clore G. M. Characterizing Methyl-Bearing Side Chain Contacts and Dynamics Mediating Amyloid beta Protofibril Interactions Using C-13(methyl)-DEST and Lifetime Line Broadening. Angew. Chem., Int. Ed. 2014, 53 (39), 10345–10349. 10.1002/anie.201405180. [DOI] [PMC free article] [PubMed] [Google Scholar]
- Dutta A.; Saxena K.; Schwalbe H.; Klein-Seetharaman J. Isotope Labeling in Mammalian Cells. Methods Mol. Biol. 2012, 831, 55–69. 10.1007/978-1-61779-480-3_4. [DOI] [PMC free article] [PubMed] [Google Scholar]
- Fawzi N. L.; Ying J. F.; Torchia D. A.; Clore G. M. Kinetics of Amyloid beta Monomer-to-Oligomer Exchange by NMR Relaxation. J. Am. Chem. Soc. 2010, 132 (29), 9948–9951. 10.1021/ja1048253. [DOI] [PMC free article] [PubMed] [Google Scholar]
- Kheddo P.; Tracka M.; Armer J.; Dearman R. J.; Uddin S.; van der Walle C. F.; Golovanov A. P. The effect of arginine glutamate on the stability of monoclonal antibodies in solution. Int. J. Pharm. 2014, 473 (1–2), 126–33. 10.1016/j.ijpharm.2014.06.053. [DOI] [PMC free article] [PubMed] [Google Scholar]
- Ranganathan A.; Gee S. J.; Hammock B. D. An immunoassay for the detection of triclosan-O-glucuronide, a primary human urinary metabolite of triclosan. Anal. Bioanal. Chem. 2015, 407 (24), 7263–73. 10.1007/s00216-015-8918-5. [DOI] [PMC free article] [PubMed] [Google Scholar]
- Ding Y. H.; Fan S. B.; Li S.; Feng B. Y.; Gao N.; Ye K.; He S. M.; Dong M. Q. Increasing the Depth of Mass-Spectrometry-Based Structural Analysis of Protein Complexes through the Use of Multiple Cross-Linkers. Anal. Chem. 2016, 88 (8), 4461–9. 10.1021/acs.analchem.6b00281. [DOI] [PubMed] [Google Scholar]
- Aguilar J. A.; Nilsson M.; Bodenhausen G.; Morris G. A. Spin echo NMR spectra without J modulation. Chem. Commun. 2012, 48 (6), 811–813. 10.1039/C1CC16699A. [DOI] [PubMed] [Google Scholar]
- Helgstrand M.; Hard T.; Allard P. Simulations of NMR pulse sequences during equilibrium and non-equilibrium chemical exchange. J. Biomol. NMR 2000, 18 (1), 49–63. 10.1023/A:1008309220156. [DOI] [PubMed] [Google Scholar]
- Korson L.; Drost-Hansen W.; Millero F. J. Viscosity of Water at Various Temperatures. J. Phys. Chem. 1969, 73 (1), 34–39. 10.1021/j100721a006. [DOI] [Google Scholar]
- Medina-Noyola M. Long-time self-diffusion in concentrated colloidal dispersions. Phys. Rev. Lett. 1988, 60 (26), 2705–2708. 10.1103/PhysRevLett.60.2705. [DOI] [PubMed] [Google Scholar]
- Vanblaaderen A.; Peetermans J.; Maret G.; Dhont J. K. G. Long-Time Self-Diffusion of Spherical Colloidal Particles Measured with Fluorescence Recovery after Photobleaching. J. Chem. Phys. 1992, 96 (6), 4591–4603. 10.1063/1.462795. [DOI] [Google Scholar]
- Andersson K. M.; Hovmoller S. The average atomic volume and density of proteins. Z. Kristallogr. - Cryst. Mater. 1998, 213 (7–8), 369–373. 10.1524/zkri.1998.213.7-8.369. [DOI] [Google Scholar]
- Golovanov A. P.; Hautbergue G. M.; Wilson S. A.; Lian L. Y. A simple method for improving protein solubility and long-term stability. J. Am. Chem. Soc. 2004, 126 (29), 8933–9. 10.1021/ja049297h. [DOI] [PubMed] [Google Scholar]
- Roberts D.; Keeling R.; Tracka M.; van der Walle C. F.; Uddin S.; Warwicker J.; Curtis R. The Role of Electrostatics in Protein-Protein Interactions of a Monoclonal Antibody. Mol. Pharmaceutics 2014, 11 (7), 2475–2489. 10.1021/mp5002334. [DOI] [PubMed] [Google Scholar]
- Roberts D.; Keeling R.; Tracka M.; van der Walle C. F.; Uddin S.; Warwicker J.; Curtis R. Specific Ion and Buffer Effects on Protein-Protein Interactions of a Monoclonal Antibody. Mol. Pharmaceutics 2015, 12 (1), 179–193. 10.1021/mp500533c. [DOI] [PubMed] [Google Scholar]
- Barnett G. V.; Razinkov V. I.; Kerwin B. A.; Laue T. M.; Woodka A. H.; Butler P. D.; Perevozchikova T.; Roberts C. J. Specific-Ion Effects on the Aggregation Mechanisms and Protein-Protein Interactions for Anti-streptavidin Immunoglobulin Gamma-1. J. Phys. Chem. B 2015, 119 (18), 5793–5804. 10.1021/acs.jpcb.5b01881. [DOI] [PubMed] [Google Scholar]
- Raut A. S.; Kalonia D. S. Opalescence in Monoclonal Antibody Solutions and Its Correlation with Intermolecular Interactions in Dilute and Concentrated Solutions. J. Pharm. Sci. 2015, 104 (4), 1263–1274. 10.1002/jps.24326. [DOI] [PubMed] [Google Scholar]
Associated Data
This section collects any data citations, data availability statements, or supplementary materials included in this article.


