Figure 1.

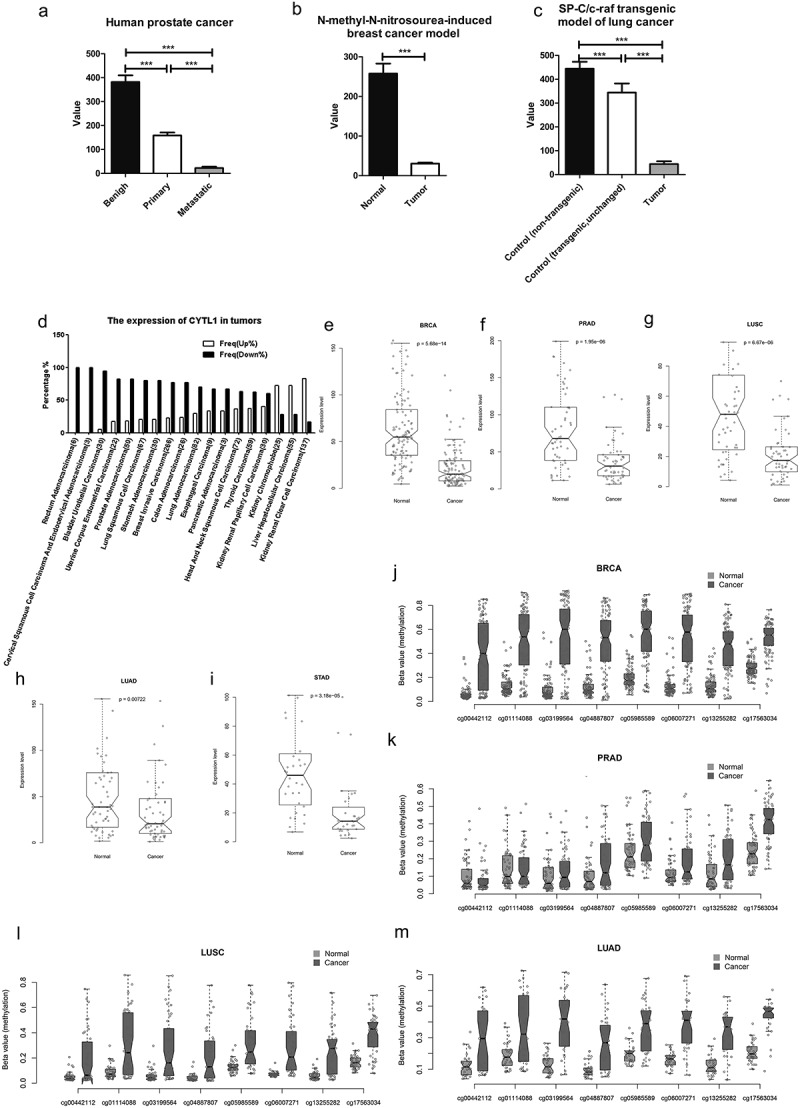
CYTL1 is downregulated in multiple types of tumors.
(a–c). Expression of CYTL1 in human prostate cancer (GDS1439/219837_s_at, a), the N-methyl-N-nitrosourea-induced rat breast cancer model (GDS1363/1375001_at, b) and the SP-C/c-raf transgenic mouse model of lung cancer (GDS3826/1456793_at, c) based on an analysis of the GEO database. The value in the y axis represents the expression level of CYTL1. The value within a GEO DataSet have been calculated in an equivalent manner and normalized using a wide variety of methods according to the original submitter-supplied sample records. (d). Expression of CYTL1 in various tumors based on an analysis of the TCGA database. % represents the proportion of tumor cases with upregulation or downregulation of CYTL1. (e–i). Expression of CYTL1 in breast invasive carcinoma (e), prostate adenocarcinoma (f), lung squamous cell carcinoma (g), lung adenocarcinoma (h) and stomach adenocarcinoma (i) based on an analysis of the GEO database. (j–m). Hypermethylation of CYTL in breast invasive carcinoma (j), prostate adenocarcinoma (k), lung squamous cell carcinoma (l) and lung adenocarcinoma (m) based on an analysis of the TCGA database. The beta value in the y axis is the ratio of the methylated probe intensity and the overall intensity (sum of methylated and unmethylated probe intensities) and represents the methylation levels.
