

ABSTRACT
Background: WNT1-Inducible Signaling Pathway Protein 1 (WISP1) is implicated in prostate cancer growth and metastasis and the regulation of inflammation in diverse benign diseases. The objectives of this study were to assess the prognostic value of WISP1, its association to inflammation and its relevance as a biomarker for immune checkpoint blockade (ICB) response.
Methods: Publicly available RNA-seq datasets were used to evaluate the prognostic value of WISP1 gene expression and its association with tumor-infiltrating lymphocytes, inflamed tumor microenvironment, and anti-PD-1 ICB response. A tissue microarray (TMA) including 285 radical prostatectomy specimens was used to confirm these associations in prostate cancer. The effect of recombinant WISP1 (rWISP1) on inflammatory cytokines was assessed in vitro.
Results: High levels of WISP1 correlated with BCR-free survival in prostate adenocarcinoma and overall survival in primary melanoma, low-grade glioma, and kidney papillary cell carcinoma. Some effects could be accounted for by higher WISP1 expression in advanced disease. High WISP1 expression in prostate adenocarcinoma was correlated with CD8+ cells density. In vitro, rWISP1 increased inflammatory cytokine production. High WISP1 gene expression in RNA-seq datasets was correlated with gene signatures of multiple immune cell types as well as an inflammatory cytokine, immune checkpoint, and epithelial-mesenchymal transition (EMT) gene expression. WISP1 mRNA expression was associated with primary resistance to ICB in datasets showing EMT.
Conclusions: Our results support an association between WISP1 expression and advanced disease, EMT and an inflamed tumor microenvironment in multiple solid tumors. The consequences of WISP1 expression on cancer immunotherapy remains to be addressed.
KEYWORDS: WNT-1 Inducible Signaling Pathway Protein 1 (WISP-1), immunotherapy, inflammation, epithelial-mesenchymal transition, prostate cancer, solid tumors, tumor-infiltrating lymphocytes, prognosis
Introduction
The immune system may cast light as well as a shadow in neoplastic evolution. In their landmark paper, Hanahan & Weinberg highlighted both avoidance of immune destruction and tumor-promoting inflammation as equally important cancer hallmarks.1 In the context of prostate cancer, inflammatory signals are particularly important in the pathogenesis of the disease. Indeed, cytokines such as IL-6 can stimulate the growth of androgen-independent cancer cells,2 and mRNA expression of the NF-κB pathway in prostate cancer tumors is associated with disease progression.3 Unlike most tumor types, high levels of CD8+ tumor-infiltrating lymphocytes (TILs) are also associated with shorter biochemical recurrence (BCR)-free survival.4,5 Furthermore, inflammatory signatures have been shown to contribute to immunotherapeutic resistance in melanoma patients6 and thus, may contribute to the limited success of immune checkpoint blockade in prostate cancer patients as well.7,8
WNT1-Inducible Signaling Pathway Protein 1 (WISP1/CCN4) is a 367 amino acid, 40 kDa protein that is located on chromosome 8q24.1-8q24.3. It is part of the CCN protein family (acronym derived from the first three family members discovered: CYR61, CTGF, and NOV). Except for WISP2, all CCN members share a similar biochemical structure, which includes a signal peptide, an Insulin Growth Factor (IGF) binding peptide, a Von Willebrand (vW) Factor C domain, a Thrombospondin type 1 (TSP1) repeat domain, and a C-terminal domain.9 The CCN family has been implicated in many cellular processes including mitosis stimulation, cell adhesion, apoptosis, extracellular matrix production, migration, growth arrest, and inflammation.10,11
Recent studies have suggested that WISP1 expression is associated with a poor cancer prognosis.9 In the specific context of prostate cancer, Ono et al. have previously shown the implication of WISP1 in tumor growth and bone metastasis in an immunocompromised mouse model.12 Prior studies also support a pro-inflammatory role for WISP1 in diverse settings, including obesity,13 osteoarthritis,14,15 inflammatory bowel disease,16,17 idiopathic pulmonary fibrosis,18 and sepsis- or mechanical ventilation-induced lung injury.19-21 Thus, the objective of this study was three-fold: 1) to assess the prognostic value of WISP1 in human prostate cancer and other solid tumor types; 2) to determine the association of WISP1 to the inflammatory landscape of prostate cancer and other solid tumors and; 3) to determine the association of WISP1 to immune checkpoint blockade response in publicly available sequencing datasets.
Results
WISP expression and prognosis
WISP1 gene expression was associated with decreased BCR-free survival in prostate cancer
Since WISP1 expression has been associated with prostate cancer progression,12 we first evaluated the prognostic impact of WISP1 in prostate adenocarcinoma using MSKCC22 and TCGA23 datasets.
In the MSKCC dataset, we observed that WISP1-high tumors were associated with a significant decreased in BCR-free survival (HR 5.83; p = 0.028; Figure 1A).
Figure 1.
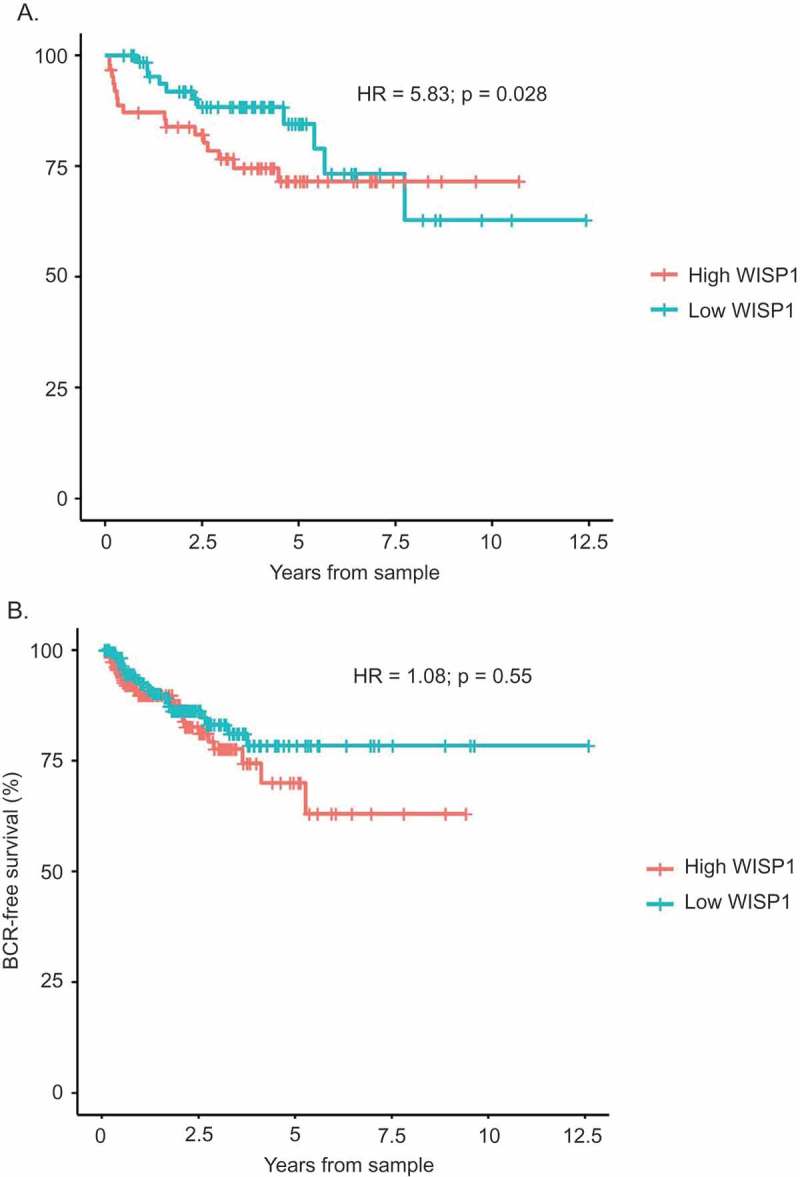
Biochemical Recurrence (BCR)-Free Survival of WISP1-high vs WISP1-low tumor samples of the MSKCC Prostate Oncogenome Project and the TCGA Prostate Adenocarcinoma Provisional Study. WISP1 mRNA expression levels were correlated to BCR-free survival using tumor samples from the MSKCC Prostate Oncogenome Project (Figure 1A; n = 131) and the TCGA Prostate Adenocarcinoma Provisional Study (Figure 1B; n = 363), using the Cox proportional hazard model.
Similar results were obtained in the TCGA datasets, where we observed a tendency for decreased BCR-free survival in the WISP1-high group (Figure 1B), although this did not reach statistical significance (HR = 1.08; p = 0.55). Overall survival analyses were not conducted due to a low number of events.
WISP1 protein expression was associated with decreased BCR-free survival
To further evaluate the prognostic impact of WISP1 in prostate cancer, we next analyzed WISP1 protein expression by quantitative IF in 285 independent cases of prostate cancer. Clinicopathological characteristics of this cohort are presented in Table 1. Expression levels in tumor and matched normal adjacent tissues were evaluated in duplicates. Co-analysis of WISP1, CD8 and CK 8–18 allowed for specific assessment in epithelial and stromal compartments (antibody specificity is shown in Supplementary Figure S1 and representative staining for both epithelium and stroma is shown in Supplementary Figure S2). Paired analysis of tumor and normal tissues revealed that WISP1 expression was not statistically different between the normal adjacent and the tumor tissues for both epithelium and stroma (Supplementary Figure S3A). However, total WISP1 expression (i.e., in both benign and tumor compartments) was significantly higher in the stroma when compared with the epithelium (p < 0.0001) (Supplementary Figure S3B).
Table 1.
Patient characteristics and clinicopathologic parameters of a prostate adenocarcinoma TMA (n = 285).
| Mean Age at diagnosis | 62.44 y |
| Mean Overall follow-up | 124 months |
| Mean PSA at diagnosis | 8.62 ng/mL |
| Mean time to biochemical recurrence | 80 months |
| Bone metastasis | |
| No | 258 |
| Yes | 27 |
| Death | |
| All | 45 |
| Prostate cancer-specific | 17 |
| Biochemical recurrence (> 0.2 ng/mL) | |
| No | 168 |
| Yes | 117 |
| Gleason score (surgery) | |
| ≤3 + 3 | 140 |
| 3 + 4 | 93 |
| 4 + 3 | 19 |
| ≥4 + 4 | 29 |
| pTNM Staging | |
| pTNM = 2 | 201 |
| pTNM = 3 | 75 |
| pTNM = 4 | 9 |
| Castration resistant | |
| No | 259 |
| Yes | 26 |
| Lymph node invasion | |
| No | 196 |
| Yes | 9 |
| Not available | 80 |
| Extraprostatic extensions | |
| No | 205 |
| Yes | 80 |
| Seminal vesicle involvement | |
| No | 269 |
| Yes | 16 |
| Surgical margin involvement | |
| No | 185 |
| Yes | 95 |
| Not available | 5 |
When the prognostic value of WISP1 was evaluated, high levels of WISP1 (i.e., above median) in the normal adjacent epithelium (Figure 2A) were significantly associated with shorter BCR-free survival (log-rank: 4.246, p = 0.039). BCR was defined as a PSA level >0.2 ng/mL after radical prostatectomy. In univariate Cox proportional hazard analyses (Table 2A), WISP1 was a statistically significant predictor of decreased BCR-free survival in prostate cancer patients (HR, 1.477; p = 0.042). However, WISP1 expression in normal prostate epithelium was not an independent negative prognostic factor of BCR-free survival according to the multivariate Cox proportional hazard analyses (HR, 1.381; p = 0.101) (Table 2B).
Figure 2.
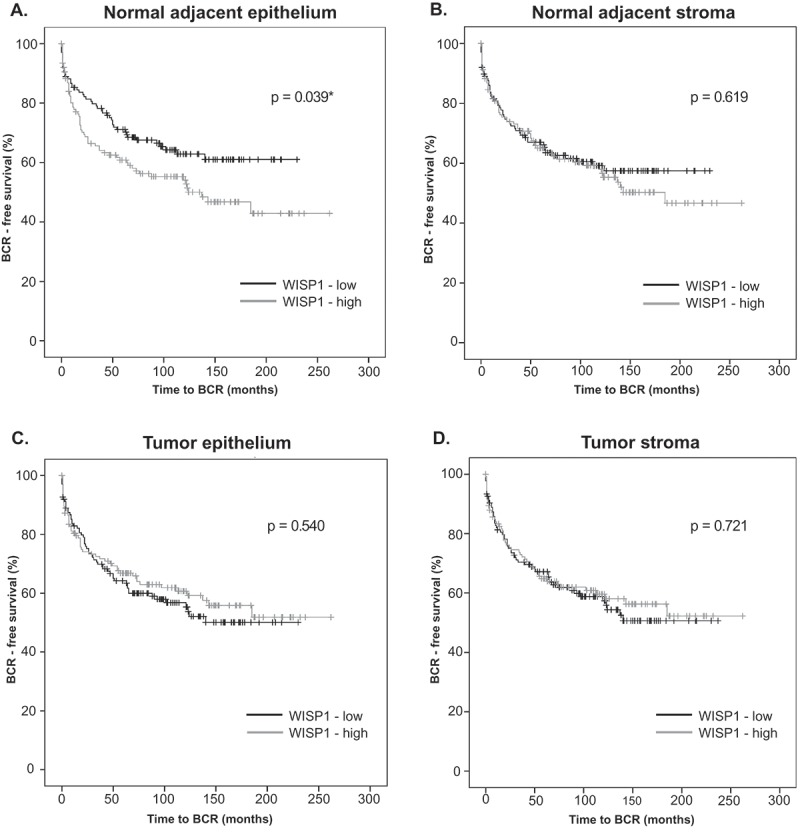
Correlation between WISP1 protein expression and BCR-free survival in a prostate adenocarcinoma TMA. WISP1 protein expression in normal adjacent prostate tissue (A, B) and tumor tissue (C, D) was evaluated by manual immunofluorescence in a prostate adenocarcinoma TMA (n = 285). Correlation between WISP1 expression levels (above or below median) and BCR-free survival (A, B, C, D) was evaluated by the log-rank test (p values are shown).
Table 2.
Univariate (A) and multivariate (B) Cox regression analyses of WISP1 for BCR-free survival.
| Factor | HR (95% CI) | P |
|---|---|---|
| A | ||
| cTNM | 0.991 (0.632–1.556) | 0,970 |
| pTNM | 2.730 (2.073–3.595) | 0.001 |
| Gleason score | 1.710 (1.434–2.039) | 0.001 |
| PSA pre-op (>10 ng/ml) | 1.062 (1.036–1.088) | 0.001 |
| Surgical margin | 3.464 (2.385–5.031) | 0.001 |
| Age | 0.997 (0.965–1.029) | 0.841 |
| WISP1 (normal adjacent epithelium) | 1.477 (1.014–2.150) | 0,042 |
| B | ||
| pTNM | 1.573 (1.111–2.228) | 0.011 |
| Gleason score | 1.418 (1.179–1.705) | 0.001 |
| PSA pre-op (>10 ng/ml) | 1.042 (1.011–1.075) | 0.008 |
| Surgical Margin | 2.597 (1.718–3.927) | 0.001 |
| WISP1 (normal adjacent epithelium) | 1.381 (0.938–2.033) | 0.101 |
Correlation between WISP1 expression levels (above or below median) and BCR-free survival in a prostate adenocarcinoma TMA (n = 285) was evaluated by Cox proportional hazard models using established prostate cancer biomarkers.
WISP1 expression was then correlated with overall survival, but no effect was observed in our cohort (Supplementary Figure S4). Of note, only a univariate Cox model could be computed because of the low number of events (i.e., only 17 prostate-cancer specific deaths were reported in our cohort). The low statistical power for overall survival effects is typical for prostate cancer, and BCR-free survival is usually the preferred endpoint for biomarker candidates in this disease.24
WISP1 protein expression was higher in advanced prostatic cancer disease
The fact that WISP1 protein expression was not an independent negative prognostic factor of BCR-free survival according to the multivariate Cox proportional hazard model prompted us to investigate interactions between WISP1 and other variables. Further analyses revealed that WISP1 expression was not correlated to either Gleason score or pre-operative PSA level (Supplementary Figures S5 and S6, respectively). However, we found a statistically significant interaction between WISP1 expression levels in the benign epithelium compartment and pTNM staging. As shown in Figure 3A, WISP1 levels were significantly higher in pTNM = 4 disease patients (Kruskall-Wallis test: p = 0.0254; Dunn’s multiple comparison test: p < 0.05 between pTNM stage 2 and 4 only). The association with cTNM disease was not evaluated since pTNM provides a superior estimation of prostatic cancer involvement, being based on the whole surgical specimen as opposed to a limited number of biopsy cores.
Figure 3.
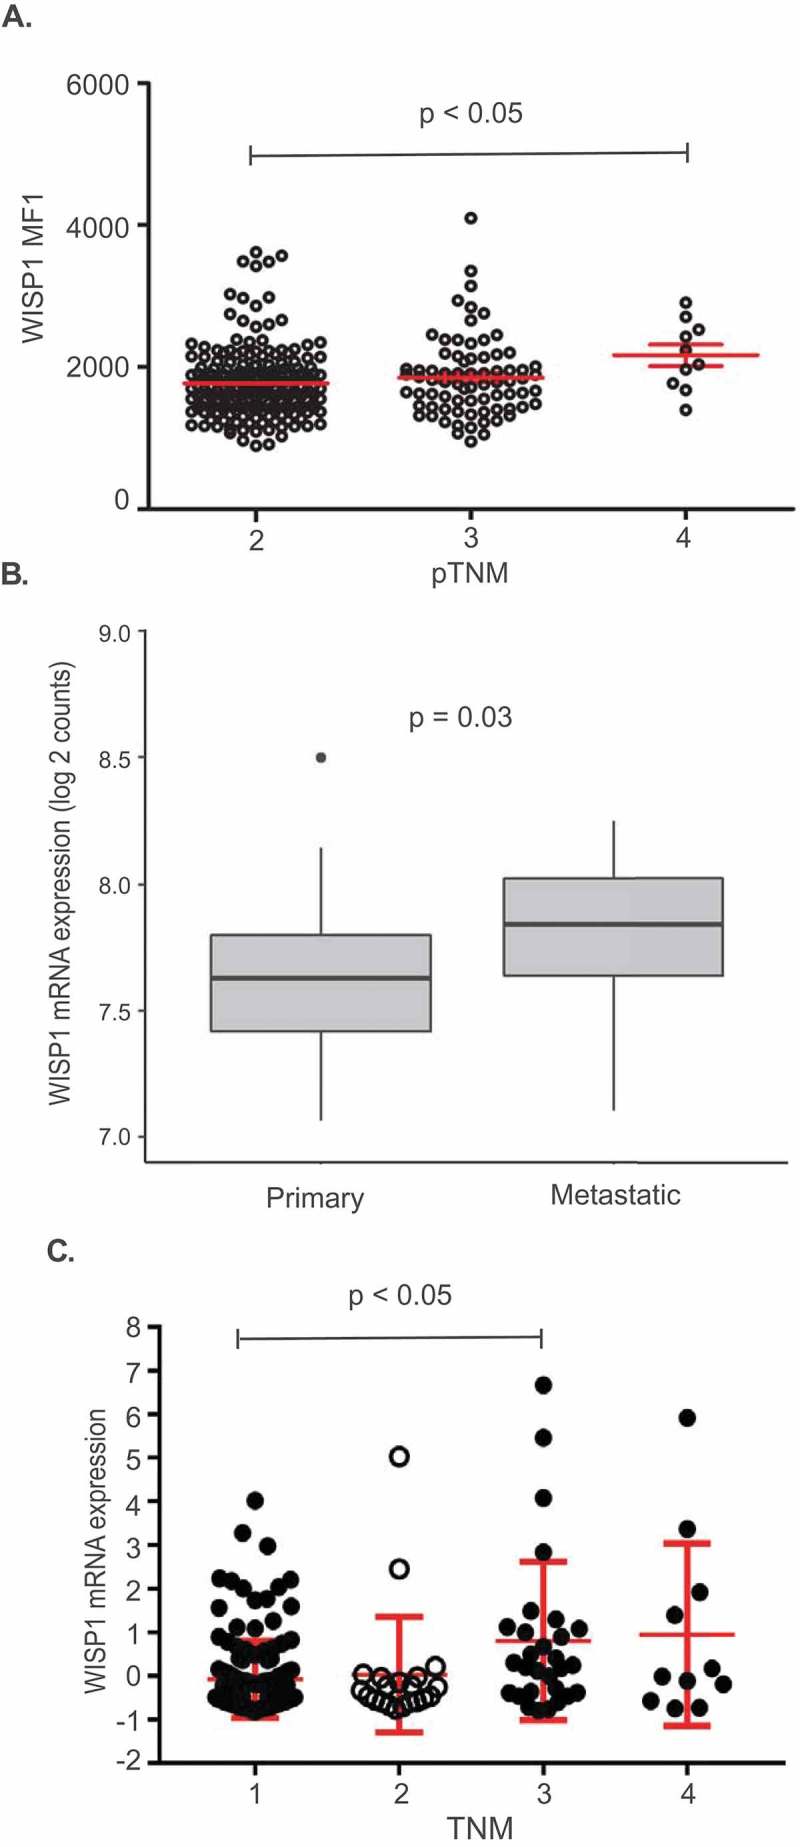
Interactions between WISP1 expression and disease stage. (A). Interaction between pTNM and WISP MFI in a prostate adenocarcinoma TMA (p-value for Dunn’s multiple comparison test is shown). (B). Comparison between WISP1 mRNA expression in primary vs metastatic tumor samples of the MSKCC Prostate Oncogenome Project (p-value for Mann–Whitney test is shown). (C). Interaction between TNM staging and WISP1 mRNA expression in the kidney papillary cell carcinoma (KIRP) TCGA dataset (p-value for Dunn’s multiple comparison test is shown).
The significance of the pTNM interaction was deemed uncertain at first because of the low number of patients with pTNM = 4 disease in our TMA (n = 9). Nonetheless, we reexamined the MSKCC dataset for interactions since it had also revealed a statistically significant correlation between WISP1 mRNA expression and decreased BCR-free survival. Cox analysis remained significant after adjustment for pTNM staging (HR = 5.59; p = 0.031). Interestingly, some available samples of the MSKCC cohort (which were not included in the BCR-free survival analyses) came from metastases (n = 37). When WISP1 mRNA expression in primary vs metastatic tissue was compared, we found that it was significantly higher in metastatic tissue (Figure 3B; p = 0.03).
Having found a biological association between WISP1 expression in advanced disease and metastatic tissue, we then asked whether WISP1 expression in primary tumors could predict the emergence of bone metastasis. No association with the development of bone metastases was observed (Supplementary Figure S7). However, the number of patients who developed metastases was low in our cohort (Table 1; n = 27). The predictive power of WISP1 in regards to the development of metastases could not be investigated in the TCGA and MSKCC datasets since the number of patients who presented with metastases was even lower (n = 3 and n = 10, respectively).
WISP gene expression was correlated with overall survival in primary melanoma, kidney papillary cell carcinoma and low-grade glioma
We then investigated if our findings could be extended to other solid tumor types. For this purpose, we evaluated the relationship between overall survival and WISP1 mRNA expression in multiple TCGA datasets. A Cox proportional hazard model including the following variables was used: gene expression, sex, age, histology and grade (when available).24 Our analyses first revealed significant associations between high WISP1 mRNA expression and decreased overall survival for five of the evaluated tumor types (Table 3): low grade glioma (HR = 1.870 p < 0.001), kidney papillary cell carcinoma (HR = 1.859; p < 0.001), bladder urothelial carcinoma (HR = 1.200; p = 0.024), ovarian serous cystadenocarcinoma (HR = 1.190; p = 0.03) and primary melanoma (Figure 4; HR = 1.25; p = 0.033). After adjusting for multiple comparisons, kidney papillary cell carcinoma (q = 0.006) and low-grade glioma (q < 0.001) analyses remained statistically significant. Melanoma was not adjusted for multiple comparisons since this TCGA dataset included both primary and metastatic samples, which were analyzed separately. Further analyses revealed an interaction with TNM staging in kidney papillary cell carcinoma (Figure 3C; Kruskal–Wallis: p = 0.0041; Dunn’s multiple comparison test: p < 0.05 between TNM stage 1 and 3 only). However, the Cox proportional hazard model remained significant after adjusting for TNM staging in the TCGA primary melanoma dataset (HR = 1.26; p = 0.028). Collectively, these results indicated that the negative prognostic value of WISP1 is not restricted to prostate cancer, and that some, but not all of these effects were associated to the fact that WISP1 expression may be higher in more advanced disease.
Table 3.
Cox regression analyses of WISP1 mRNA expression and overall survival in selected TCGA datasets.
| Cancer | Hazard Ratio | P value | FDR Corrected | Rank | Median expression | Mean expression |
|---|---|---|---|---|---|---|
| LGG | 1.870 | 1.20E-08 | 4.15E-07 | 486 | 6.22 | 33.3 |
| KIRP | 1.859 | 4.60E-04 | 6.02E-03 | 1257 | 23.68 | 43.67 |
| BLCA | 1.200 | 2.40E-02 | 1.59E-01 | 2474 | 62.19 | 155.73 |
| OV | 1.190 | 3.00E-02 | 6.09E-01 | 833 | 119.84 | 179.21 |
| HNSC | 0.885 | 7.60E-02 | 3.77E-01 | 3357 | 146.81 | 281.35 |
| SARC | 1.210 | 7.80E-02 | 3.01E-01 | 4201 | 278.07 | 810.71 |
| PAAD | 1.214 | 9.10E-02 | 2.56E-01 | 6118 | 354.9 | 445.34 |
| CESC | 1.202 | 1.60E-01 | 5.01E-01 | 5226 | 42.86 | 78.52 |
| LIHC | 1.133 | 1.70E-01 | 4.23E-01 | 6374 | 13.78 | 40.67 |
| STAD | 1.104 | 2.30E-01 | 6.10E-01 | 6373 | 157.85 | 216.29 |
| LUAD | 1.071 | 3.40E-01 | 5.82E-01 | 9810 | 145.84 | 210.59 |
| BRCA | 1.087 | 3.80E-01 | 7.22E-01 | 8748 | 242.34 | 323.88 |
| LUSC | 1.061 | 3.90E-01 | 8.22E-01 | 8048 | 196.07 | 319.98 |
| UCEC | 1.073 | 5.30E-01 | 9.95E-01 | 8816 | 32.33 | 54.08 |
| GBM | 1.057 | 5.70E-01 | 9.34E-01 | 10268 | 85.78 | 270.71 |
| COAD | 1.050 | 6.20E-01 | 8.74E-01 | 11632 | 101.28 | 136.97 |
| KIRC | 1.037 | 6.30E-01 | 7.35E-01 | 14288 | 139.79 | 185.24 |
| ESCA | 0.946 | 6.80E-01 | 9.84E-01 | 11597 | 99.23 | 180.64 |
Correlation between WISP1 mRNA expression levels and overall survival in selected TCGA datasets using a Cox proportional hazard model (LGG: Low Grade Glioma; KIRP: Kidney Renal Papillary Cell Carcinoma; BLCA: Bladder Urothelial Carcinoma; OV: Ovarian Serous Cystadenocarcinoma; HNSC: Head and Neck Squamous Cell Carcinoma. SARC: Sarcoma. PAAD: Pancreatic Adenocarcinoma; CESC: Cervical Squamous Cell Carcinoma and Endocervical Adenocarcinoma; LIHC: Liver Hepatocellular Carcinoma; STAD: Stomach Adenocarcinoma; LUAD: Lung Adenocarcinoma; BRCA: Breast Invasive Carcinoma; LUSC: Lung Squamous Cell Carcinoma; UCEC: Uterine Corpus Endometrial Carcinoma; GBM: Glioblastoma Multiforme; COAD: Colon Adenocarcinoma; KIRC: Kidney Clear Cell Carcinoma; ESCA: Esophageal Carcinoma).
Figure 4.
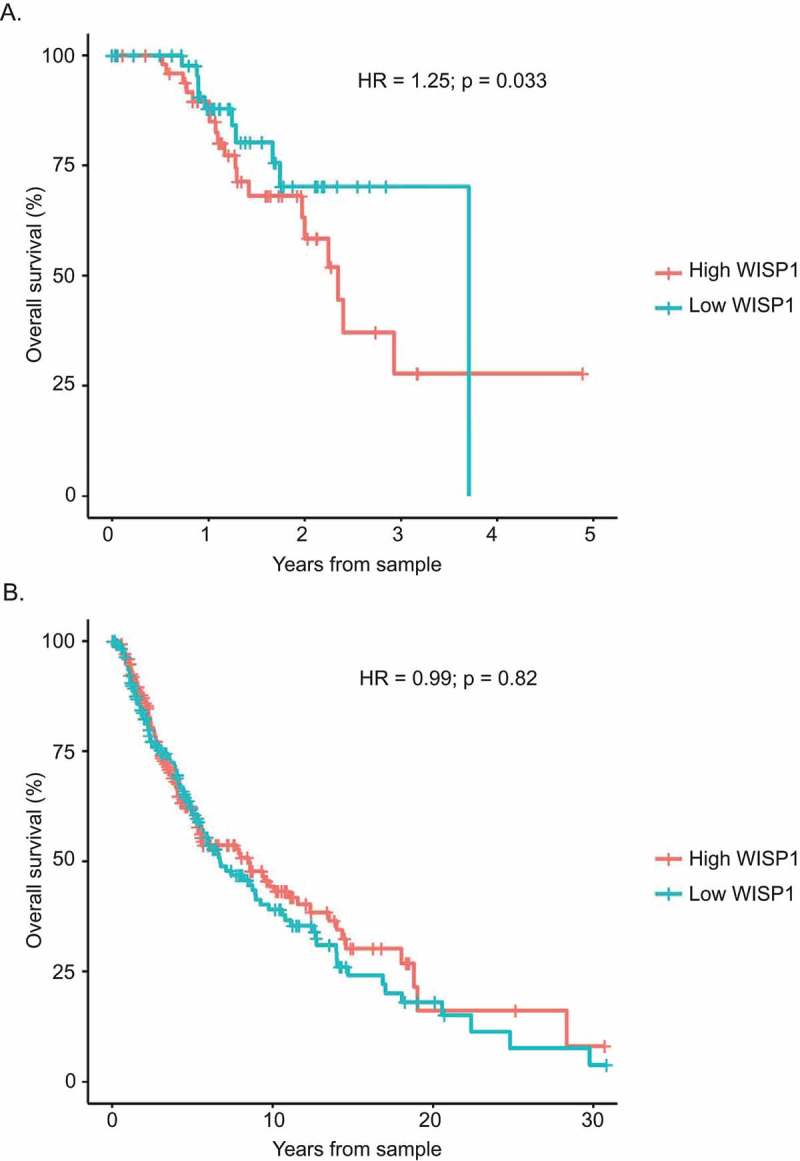
Correlation between overall survival and WISP1 mRNA expression in TCGA primary and metastatic melanoma datasets. (A). Cox proportional hazard survival analysis for TCGA primary melanoma. (B). Cox proportional hazard survival analysis for TCGA metastatic melanoma.
WISP expression and the inflammatory tumor microenvironment
WISP1 gene expression was associated with CD8 gene expression
Using the TCGA Prostate Adenocarcinoma Provisional database, the MSKCC Prostate Oncogenome project22 and the SU2C/PCF Dream Team project in metastatic prostate cancer dataset,25 we then investigated if WISP1 expression was associated with CD8 expression.26,27 First, we correlated CD8A and CD8B with WISP1 gene expression in the TCGA Prostate Adenocarcinoma Provisional RNA-seq dataset. We observed statistically significant correlations between WISP1 and CD8A (rho = 0.43; p < 0.001) and CD8B (rho = 015; p < 0.001) (Figure 5A, B). Correlations were also significant in the MSKCC dataset for CD8A (rho = 0.77; p < 0.001) and CD8B (rho = 0.72; p < 0.001) (Figure 5C, D) and the ones from the SU2C/PCF Dream Team cohort revealed strong trends (CD8A: rho = 0.17; p = 0.06, CD8B: rho = 0.18; p = 0.06) (Figure 5E, F).
Figure 5.
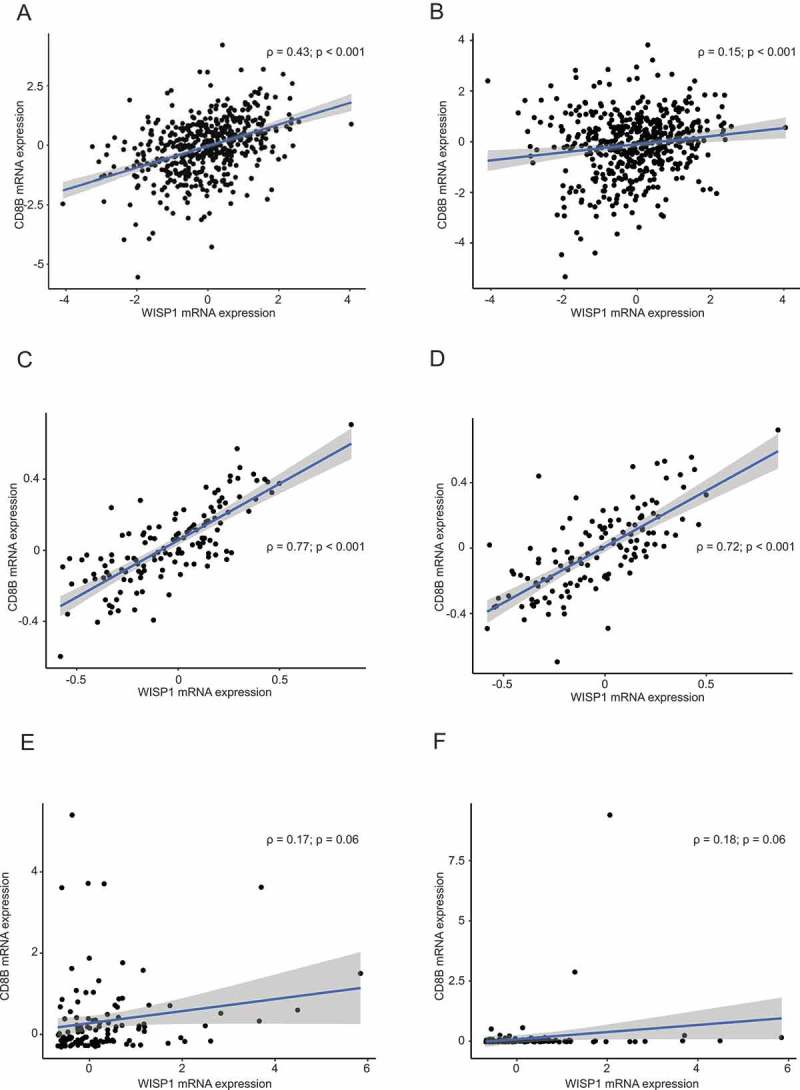
Correlation between WISP1 mRNA and CD8A/CD8B expression in the TCGA Prostate Adenocarcinoma Provisional Study, the MSKCC Prostate Oncogenome Project, and the SU2C/PCF Dream Team project in metastatic prostate cancer. Spearman correlations (rho and p values are shown) between WISP1 and CD8A mRNA expression in the TCGA Prostate Adenocarcinoma Provisional Study (Figure 5A, B), the MSKCC Prostate Oncogenome Project (Figure 5C, D), and the SU2C/PCF Dream Team project in metastatic prostate cancer (Figure 5E, 5F).
WISP1 protein expression was correlated to CD8 + T cell infiltration in prostate adenocarcinoma
We next sought to confirm the link between WISP1 protein expression and CD8+ cell infiltration in the prostate tumor microenvironment. The morphology of CD8+ cells was assessed by an independent pathologist and was judged to be consistent with lymphocytes (Supplementary Figure S2D). Mean WISP1 MFI, as measured by manual IF in our TMA cohort, was correlated to CD8+ cell density using Spearman correlation coefficients for each of the four compartments (benign/tumor epithelium and benign/tumor stroma). First, CD8+ cell density was significantly higher in the normal adjacent epithelium when compared with the tumor (Supplementary Figure S3C). Opposite findings were obtained when the stroma was evaluated: CD8+ cell density was significantly higher in the tumor when compared with the normal adjacent counterpart (Supplementary Figure S3C). Furthermore, we found statistically significant correlations between WISP1 protein expression and CD8+ cell density in all compartments except for the adjacent benign stroma (Table 4).
Table 4.
Spearman correlations between WISP1 expression and CD8+ cell density in normal adjacent prostate epithelium/stroma and tumor epithelium/stroma.
| Benign epithelium WISP1 expression | Tumor epithelium WISP1 expression |
Benign stroma WISP1 expression |
Tumor stroma WISP1 expression |
||
|---|---|---|---|---|---|
| Benign epithelium CD8+ cell density | ρ | 0.447 | 0.110 | 0.085 | 0.079 |
| P value | 0.001 | 0.071 | 0.161 | 0.197 | |
| n | 277 | 269 | 276 | 267 | |
| Tumor epithelium CD8+ cell density | ρ | 0.089 | 0.225 | −0.053 | 0.235 |
| P value | 0.147 | 0.001 | 0.386 | 0.001 | |
| n | 269 | 273 | 270 | 270 | |
| Benign stroma CD8+ cell density | ρ | 0.087 | 0.016 | 0.082 | −0.039 |
| P value | 0.148 | 0.797 | 0.175 | 0.523 | |
| n | 277 | 271 | 278 | 269 | |
| Tumor stroma CD8+ cell density | ρ | 0.097 | 0.151 | 0.068 | 0.262 |
| P value | 0.111 | 0.012 | 0.268 | 0.001 | |
| n | 270 | 273 | 271 | 271 | |
WISP1 protein expression and CD8+ cell density were evaluated by IF in a prostate adenocarcinoma TMA (n = 285).
Recombinant WISP1 increases the production of pro-inflammatory cytokines in mixed lymphocyte reactions (MLR)
To evaluate the pro-inflammatory role of WISP1, two-way MLR assays were conducted using increasing doses of recombinant WISP1 (rWISP1) protein, based on published literature.15,19 Our experiments revealed that rWISP1 produced a significant increase in IFN-γ (Figure 6A), TNF-α (Figure 6B) and IL-6 (Figure 6C) for at least the two highest doses (p < 0.05), thus demonstrating its pro-inflammatory role.
Figure 6.
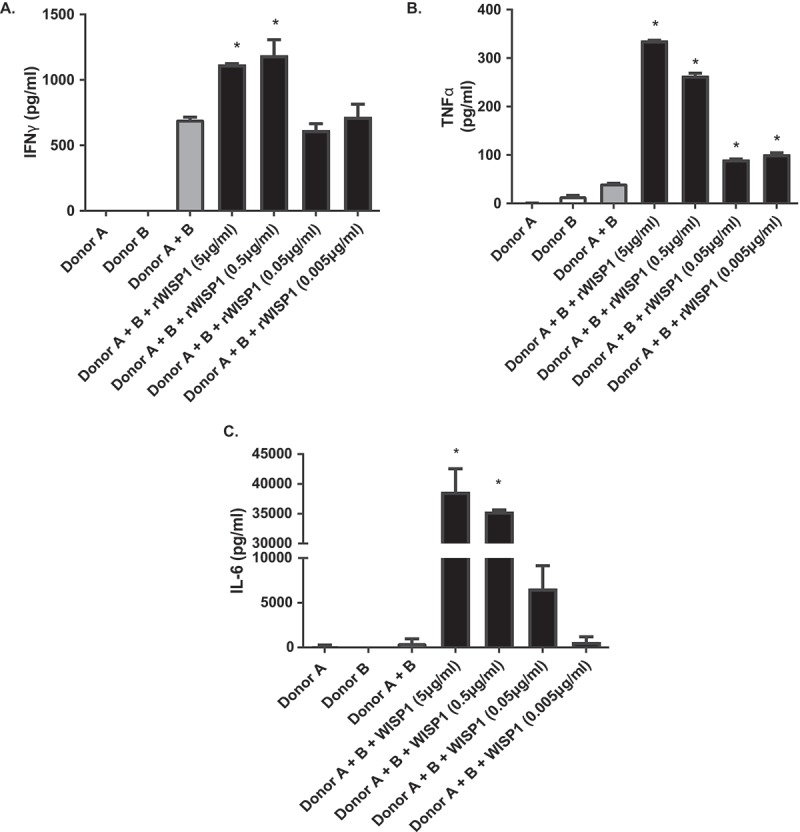
Inflammatory cytokine levels following recombinant WISP1 treatment in two-way mixed lymphocyte reaction assays. IFN-γ (A), TNF-α (B) and IL-6 concentrations (C), as measured by ELISA in supernatant from two-way mixed lymphocyte reaction assays from healthy volunteers. Data shown are representative of at least two different experiments, and multiple donor combinations were used. (*p < 0.05 as compared to donor A + B positive control).
WISP1 mRNA expression was linked to multiple inflammatory pathways and EMT in prostate adenocarcinoma
Following positive results linking WISP1 to CD8+ cell infiltration and pro-inflammatory cytokines, we next sought to explore the link of WISP1 mRNA expression to a broader inflammatory tumor microenvironment. For this purpose, we conducted a Gene Set Enrichment Analysis (GSEA) with the aforementioned three datasets (i.e., TCGA, MSKCC, and SU2C). Full GSEA results are shown in Supplementary Table 1. Figure 7A and 7B represent the overlap between the overexpressed and downregulated gene pathways, respectively, from the three datasets. Overall, the most overexpressed pathway was EMT, which was consistent with our findings associating WISP1 to advanced disease and metastasis. Otherwise, differentially expressed genes revealed that WISP1-high prostate tumors were mostly associated with the upregulation of multiple inflammatory pathways (Figure 7C). Indeed, out of the top 30 upregulated pathways, nearly half (14/30) were directly related to immune function (Supplementary Table 1). Other top overexpressed pathways (e.g., “CR_SIGNALING”) also heavily relied on immune genes. Moreover, the only downregulated pathway related to inflammation was the “Leucocyte down” (i.e., Leu_down) pathway, again reflecting a pro-inflammatory association. Among the gene sets with the highest NES score, many were related to T lymphocytes (i.e., “Hallmark interferon gamma response”, “Biocarta_nkt_pathway”, “Hallmark IL2-STAT5 signaling”, “CA-NFAT signaling”, “CTLA-4 pathway”, “TCRA pathway”, “T Cytotoxic pathway”, “IL2RB Pathway”, “TOB1 Pathway” and “T Signal Transduction Pathway”), and the first of the top 50 single genes correlated to WISP1 was IL7R, a receptor which plays a critical role in V(D)J recombination during lymphocyte development (Figure 7D). Taken together, these results yielded strong support for a pro-inflammatory role of WISP1 in the prostate cancer tumor microenvironment.
Figure 7.
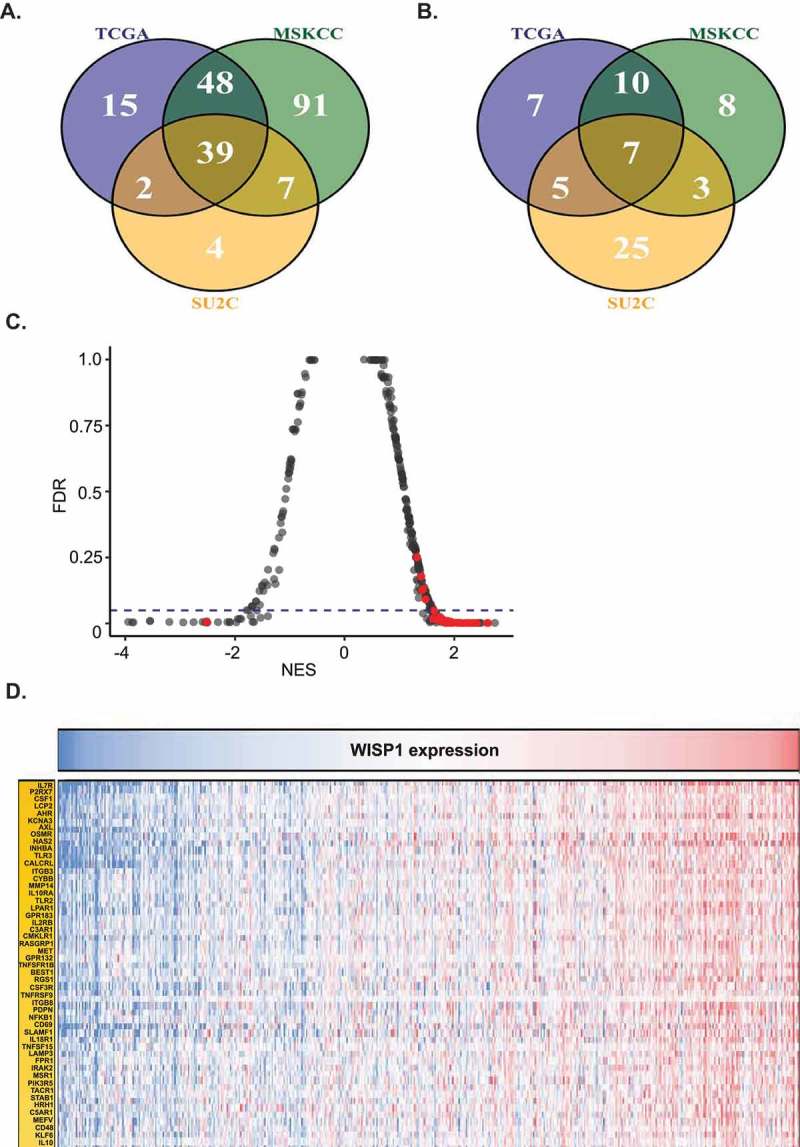
Gene Set Enrichment Analysis (GSEA) for WISP1-high vs WISP1-low patients in the TCGA Prostate Adenocarcinoma Provisional Study, the MSKCC Prostate Oncogenome Project, and the SU2C/PCF Dream Team project in metastatic prostate cancer. (A). Venn diagram showing overlapping upregulated pathways between the three datasets. (B). Venn diagram showing overlapping downregulated pathways between the three datasets. (C). Statistically significant gene pathways related to inflammation marked in red (p < 0.05). (D). Top 50 genes correlated to WISP1 across the three datasets.
WISP1 mRNA was associated with the infiltration of multiple immune cell types, inflammatory cytokines, CD8+ cell-related genes, immune checkpoint expression and EMT in multiple RNA-seq datasets
Using the TCGA RNA-seq databases, the inflammatory microenvironment associated with WISP1 was further investigated in other tumor types to determine if consistent correlations could be detected across multiple solid tumor types. Available datasets specific for prostate cancer were added as well (i.e., the MSKCC Prostate Oncogenome project22 and the SU2C/PCF Dream Team project in metastatic prostate cancer).25
Results from these analyses are shown in Figure 8. The statistical significance of these correlations was based on the conservative q values (<0.05) which were adjusted for over 20,000 comparisons. First, WISP1 mRNA expression significantly co-occurred with multiple TIMER immune cell type gene signatures in all tumor types except OV, CESC, GBM, and ESCA. In accordance with our in vitro data, all tumor types (with the exceptions of SARC and GBM) also showed statistically significant correlations between WISP1 gene expression and pro-inflammatory cytokines. Moreover, genes associated with CD8+ T lymphocytes were significantly related to WISP1 expression in all tumor types except HNSC, SARC, CESC, KIRC, and ESCA. Remarkably, WISP1 was also associated with the expression of multiple immune checkpoints (i.e., CD274 (PD-L1), CTLA-4, HAVCR2 (TIM3), and LAG3). Finally, the majority of EMT-related correlations were significant, and in the expected direction (i.e., downregulation of CDH1 and upregulation of CDH2, VIM, ZEB1, SNAI1, and TWIST1) for all tumor types.
Figure 8.
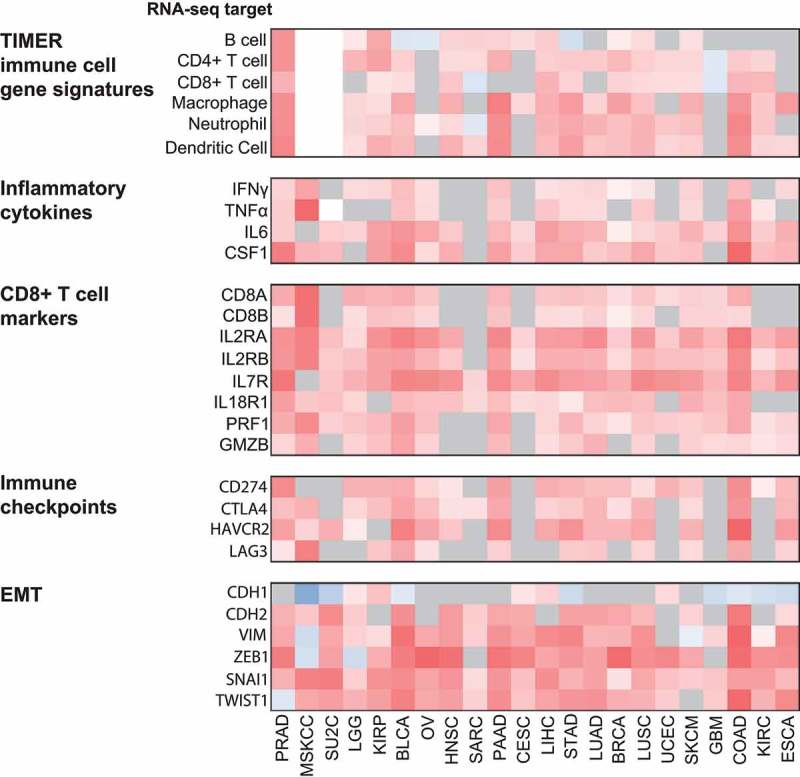
Correlation between WISP1 mRNA and TIMER immune cell gene signatures, inflammatory cytokines, CD8+ T lymphocyte markers, immune checkpoint genes and EMT in multiple RNA-seq datasets. Heatmap showing Spearman correlations between WISP1 mRNA expression and TIMER immune cell gene signatures, inflammatory cytokines, CD8+ T cell markers, immune checkpoints and EMT-related genes mRNA expression in selected TCGA tumor types. White areas represent unavailable data and gray areas represent nonsignificant correlations (q ≥ 0.05). PRAD: Prostate Adenocarcinoma; MSKCC: MSKCC Prostate Oncogenome Project; SU2C: SU2C/PCF Dream Team project in metastatic prostate cancer; LGG: Low Grade Glioma; KIRP: Kidney Renal Papillary Cell Carcinoma; BLCA: Bladder Urothelial Carcinoma; OV: Ovarian Serous Cystadenocarcinoma; HNSC: Head and Neck Squamous Cell Carcinoma. SARC: Sarcoma. PAAD: Pancreatic Adenocarcinoma; CESC: Cervical Squamous Cell Carcinoma and Endocervical Adenocarcinoma; LIHC: Liver Hepatocellular Carcinoma; STAD: Stomach Adenocarcinoma; LUAD: Lung Adenocarcinoma; BRCA: Breast Invasive Carcinoma; LUSC: Lung Squamous Cell Carcinoma; UCEC: Uterine Corpus Endometrial Carcinoma; GBM: Glioblastoma Multiforme; COAD: Colon Adenocarcinoma; KIRC: Kidney Clear Cell Carcinoma; ESCA: Esophageal Carcinoma.
Association of WISP1 mRNA to immune checkpoint blockade response in publicly available databases
To estimate if WISP1 may be a valuable target for patients treated with immunotherapy, we interrogated three public databases of patients treated with anti-PD-1 immune checkpoint blockade. In the Ascierto et al.28 dataset, whole genome expression profile from four pre-treatment responders and eight nonresponders with renal cell carcinoma were compared. These profiles revealed that WISP1 was significantly upregulated in nonresponders (p = 0.021). In the Hugo et al. dataset6 of melanoma patients, which contains 13 nonresponders and 15 responders to anti-PD-1 therapy, WISP1 was part of the differentially expressed genes that identified innately resistant tumors (p = 0.002). The Riaz et al. melanoma dataset did not highlight WISP1 as a differentially expressed gene in pre-treatment biopsies (the transcriptome analysis was available for 45 patients).29 However, WISP1 was significantly expressed in on-treatment biopsies from anti-PD-1 responders. Overall, these data suggest that WISP1 may constitute a predictive biomarker of anti-PD-1 immune checkpoint blockade.
Discussion
In this study, we identified that increased WISP1 expression is associated with shorter BCR-free survival in prostate adenocarcinoma. Moreover, a negative correlation between WISP1 mRNA expression and overall survival was also noted in several other solid tumor types including primary melanoma tumors, kidney papillary cell carcinoma and low-grade glioma. Further analyses revealed interactions with advanced/metastatic disease, inflammatory gene signatures, and CD8+ cell infiltration. In vitro MLR and bioinformatic analyses across multiple tumor types confirmed an association between WISP1 and infiltration of T cells and other immune cell type infiltration, inflammatory cytokines and immune checkpoint expression, as well as EMT. Most notably, WISP1 levels were found to be higher in non-responders to anti-PD-1 therapy, highlighting the relevance of WISP1 in tumor immunity.
Overall, prostate cancer WISP1 expression in our data was compatible with the existing literature. In their study of WISP1 in prostate cancer, Ono et al. showed that this protein was expressed to a greater extent in prostate cancer tissues when compared to normal controls.12 This group and others also found that WISP1 was mostly localized to the stromal tissues surrounding malignant cells.30 These findings were partially confirmed in our TMA: WISP1 expression within normal adjacent tissue and tumor was not significantly different, but higher levels of WISP1 expression were found within the stromal compartments when compared to epithelium compartments (Supplementary Figures S3A and S3B). Ono et al. also showed that serum levels of WISP1 were inversely correlated with PSA levels and Gleason score.12 However, these associations were not reproduced in our TMA. These differences can be accounted for by: 1) the fact that results from the Ono et al. study compared tissues and serum from normal subjects and prostate cancer patients, as opposed to matched adjacent benign and tumor tissues from the same patients; 2) the correlation between WISP1 and the Gleason score in the Ono et al. study were only observed between Gleason 9 and inferior scores, yet the vast majority of our samples had a Gleason score ≤3 + 3 or 3 + 4 (only 9 patients had a Gleason score of 9); 3) our results relied on a larger cohort (285 patients in our study vs 60 patients in the Ono et al. study) and; 4) different WISP1 measurement techniques were used (i.e., quantitative IF in our study vs IHC in the Ono et al. study) .
Our results indicated for the first time that WISP1 expression was correlated to a worse prognosis in a small subset of human solid tumors including prostate cancer, primary melanoma tumors, kidney papillary cell carcinoma and low-grade glioma. For two of these tumors (i.e., prostate and kidney), the negative association could be explained by the fact that WISP1 expression was higher in more advanced/metastatic tissue (Figure 3). This conclusion is consistent with our GSEA analysis, which showed that WISP1 mRNA expression is highly correlated to EMT (Supplementary Table 1), as well as previous literature linking WISP1 to EMT and tumor cell migration in vitro.31-33 Additionally, a report of colon adenocarcinoma also found higher WISP genes expression in more advanced disease.34 Our data are also in accordance with the animal data from Ono et al., who demonstrated that anti-WISP1 antibodies could reduce local and distant metastasis using human PC3 prostate cancer cell xenografts in an immunocompromised mouse model.12 However, we could not highlight a predictive value for WISP1 in primary prostatic tumors in regards to the future development of bone metastasis, most probably due to low statistical power, thereby reflecting the fact that the development of bone metastasis is a rare event across radical prostatectomy datasets.
Our TMA, in vitro and bioinformatic analyses all supported a pro-inflammatory role for WISP1, in accordance with multiple studies suggesting a pro-inflammatory role for WISP1 in diverse benign disease settings.13,14,16,18,19,21,35 In addition to the association with EMT, the fact that WISP1 protein expression was associated with CD8+ cell density may partially explain its negative prognostic impact. Indeed, tumor infiltrating lymphocytes (TILs) have been demonstrated to be an independent negative prognostic factor associated with prostate cancer.4 Supporting this association is our GSEA analysis, which highlighted multiple pathways related to T cell biology (Supplementary Table 1), and multiple TCGA RNA-seq datasets showing statistically significant correlations between WISP1 and the CD8A/CD8B gene expression (Figure 8). The negative prognosis associated with WISP1 in prostate adenocarcinoma could also be explained by the implication of WISP1 in well-characterized inflammatory pathways involved in prostate carcinogenesis, the most obvious being NF-κB.3 Indeed, NFKB1 was represented in the top 50 correlated genes in our GSEA analysis (Figure 7D), and an implication for WISP1 in the NF-κB pathway is also consistent with previous reports in other contexts.15,36
Mechanistic insights for the role of WISP1 in the immune microenvironment of malignant diseases remains sparse. Results from Ono et al. used an immunocompromised mouse model and could not account for most effects of the immune system in relationship with WISP1 activity.12 Although the prognostic impact of WISP1 appears limited to a few tumor types, the association between WISP1 and an inflamed tumor microenvironment was found across the majority of the datasets which we have tested and may represent the strongest data from our studies, especially considering the fact that WISP1 has been linked to a wide range of non-inflammatory functions overall.37 Indeed, WISP1 was consistently associated across tumor types not only to lymphocytes, but also to other immune cell types (i.e., B cells, antigen presenting cells and innate immune cells; Figure 8), inflammatory cytokine production and immune checkpoint expression (i.e., PD-L1, CTLA-4, TIM3, and LAG3). Such an inflammatory microenvironment is highly consistent with EMT, which has been linked to the expression of multiple immune checkpoints.38 Interestingly, contrasting roles for WISP1 emerge from published reports in cancer, which include both pro-inflammatory and immunosuppressive features. In a retrospective study, Klinke et al. described an association between WISP1 and immunosuppression in breast cancer.39 An immunosuppressive role for WISP1 has also been demonstrated by the same group in vitro using a melanoma model, although the lymphocyte cell line used in these experiments (i.e., 2D6) was specifically dependant on IL-12 stimulation and thus, may not reflect true in vivo dynamics.40 On the other hand, Wu et al. found that, in colon cancer specimens, WISP1 promoted cytokine–cytokine interactions and that WISP1 knockdown subsequently decreased CXCR4 and CCL18 levels,41 which supported a pro-inflammatory role for WISP1. These contrasting results could be explained by the fact that the activity of WISP1 may be context-dependent (e.g., acute vs chronic inflammation), and by the fact that WISP1 has been shown to interact with pro-inflammatory cytokines such as IL- 6,15 TNF-α42 and IL-18,43 but also immunosuppressive cytokines such as IL-1044 and the TGF-β superfamily45,46 in benign disease settings. These observations are certainly confirmed by our own data, showing that pro-inflammatory signals such as IFN-γ, TNF-α and IL-6 can be induced by rWISP1 (Figure 6), and that IL-2, IL-18R, IL-6, IL7, IFN-γ, CSF-1, and TNF-α were correlated to WISP1 mRNA expression, as were compensatory immunosuppressive signals such as TGF-β and IL-10 (Figure 7D, Figure 8 and Supplementary Table 1). However, little is known about WISP1-dependant cytokine production. In the context of benign disease, WISP1 seems required for the induction of IL-6 following TNF-α or TGF- β1 stimulation in human fibroblasts,18 and the α5β5 integrin receptor may be mediating WISP1 activity.15 Reddy et al. also showed that IL-18 induces WISP1 expression via PI3K/Akt/GSK3β/β-catenin and TCF-LEF.43 Additionally, Quiros and colleagues showed that macrophage-derived IL-10 resulted in cAMP response element-binding protein (CREB) activation and secretion of WISP1 in epithelial cells.44 In vitro assays also demonstrated that WISP1 overexpression enhanced TGF-β3-induced SMAD2/3 phosphorylation and chondrogenesis of human bone marrow stromal cells.45 Overall, most of the current literature supports an inflammatory role for WISP1 in contexts other than cancer, as is the case for other CCN family members.11 Our results support that pro-inflammatory functions of WISP1 seem to be conserved in malignant microenvironments as well, with similar findings across a majority of solid tumor types (Figure 8). Nonetheless, five different transcripts of WISP1 have been described, of which only one is non-coding, and the differential functions of these multiple transcripts remain unknown.
WISP1 involvement in EMT and an inflamed tumor microenvironment (specifically in terms of its association with multiple immune checkpoints) suggests a potential therapeutic role in regards to the recent success of immune checkpoint blockade immunotherapy. In a study by Hugo et al., anti-PD-1 innately resistant melanoma tumors were characterized by a transcriptomic signature (referred to as the IPRES signature) reflecting the regulation of EMT, cell adhesion, extracellular matrix remodeling, angiogenesis, and wound healing. WISP1 was upregulated in these tumors, which is consistent with previously published WISP1 functions,31,44,47,48 as well as our own GSEA analysis, where EMT ranked as the top upregulated pathway (Supplementary Table 1). However, the Riaz et al. cohort, which included melanoma patients as well, did not identify WISP1 overexpression as a feature of innately resistant tumors.29 This may be explained in part by different methodologies. For instance, responders and nonresponders were defined using the irRECIST criteria in the Hugo publication, as opposed to the RECIST v1.1 criteria in the Riaz cohort. But most interestingly, the previously identified EMT-related IPRES signature was not found in the nonresponders of the Riaz cohort, which highlights that pre-treatment tumors were inherently different biologically between the two cohorts, and that WISP1-associated resistance may well be part of a larger EMT program. In fact, in the Riaz cohort, WISP1 was significantly higher in on-treatment samples of anti-PD-1 responders, most probably reflecting the pro-inflammatory activity of WISP1 (i.e., before any EMT-related programming may lead to resistance). As for the Ascierto et al.28 dataset, genome expression profiles of anti-PD-1 resistant renal cell tumors featured genes related to metabolic and solute transport. Interestingly, WISP1 was again upregulated in these resistant tumors and may support the novel metabolic functions for WISP1 reflected in the recent literature, linking the activity of this protein to obesity and gestational diabetes mellitus.13,49 Taken together, these results indicate that WISP1 may be a relevant biomarker of anti-PD-1 resistance in tumors with established EMT (i.e., the Hugo cohort) or specific metabolic features (i.e., the Ascierto cohort). Furthermore, WISP1 may be useful as an on-treatment pharmacologic biomarker in tumors which do not harbor baseline EMT features (i.e., the Riaz cohort). This being said, the number of samples in these cohorts remains small, and whether these findings can be transposed across solid tumor types other than melanoma and renal cell carcinoma remains unknown. Nonetheless, the fact that some groups found that WISP1 was an attractive target to reverse EMT-associated radioresistance in esophageal squamous cell carcinoma holds promise for WISP1 as a relevant therapeutic target in the context of EMT-related immune checkpoint blockade resistance.50
In conclusion, our report paves the way for future mechanistic studies to elucidate the relationship between WISP1 and inflammation in the field of immuno-oncology. Overall, our results demonstrated: 1) a limited negative prognostic association for WISP1 in the context of prostate cancer, primary melanoma, kidney papillary cell carcinoma and low grade glioma, which could be accounted for by the fact that, in some of these tumors, WISP1 expression was higher in more advanced disease and metastasis; 2) an association between WISP1 expression, an inflamed tumor microenvironment and EMT, which is conserved across a majority of solid tumor types and; 3) a potential role for immunomodulating molecules such as WISP1 as a biomarker/therapeutic target for the enhancement of immune checkpoint blockade cancer immunotherapy.
Methods
Bioinformatic analyses
Bioinformatic analyses of the TCGA Prostate Cancer Adenocarcinoma Provisional Study were performed on tumor samples (n = 496). Briefly, level 3 log2 (x + 1) transformed RSEM normalized gene expression RNASeqV2 and clinical annotations were downloaded from cBioPortal (http://www.cbioportal.org).23,51 Survival analysis was performed by the Cox proportional hazards model to evaluate the correlation between WISP1 expression level and BCR, and statistical significance was defined as a p-value below 0.05. Kaplan–Meier curves were also drawn for the data, using a median cutoff to split patients into two groups by WISP1 expression. CD8A and CD8B expression were used to estimate CD8+ cell density in the TCGA data set, based on the work by Danaher et al.27 We calculated the Spearman correlation between CD8A/B expression and WISP1 expression. Gene Set Enrichment Analysis was also conducted to identify pathways correlating with WISP1 expression.52 The Spearman correlations between WISP1 and all other protein-coding genes were calculated, and these were input as a ranked list in the fgsea R package to identify pathways with large fractions of strongly positively (or negatively) correlated genes with WISP1.53 Hallmarks and canonical pathways from the Molecular Signatures Database were analyzed. Ten thousand permutations were used to estimate statistical significance, and a q-value (false-discovery corrected p-value) below 0.05 was considered statistically significant.
WISP1 mRNA expression from the following TCGA datasets was downloaded from cBioPortal (http://www.cbioportal.org):23,51 PRAD: Prostate Adenocarcinoma, LGG: Low Grade Glioma; KIRP: Kidney Renal Papillary Cell Carcinoma; BLCA: Bladder Urothelial Carcinoma; OV: Ovarian Serous Cystadenocarcinoma; HNSC: Head and Neck Squamous Cell Carcinoma. SARC: Sarcoma. PAAD: Pancreatic Adenocarcinoma; CESC: Cervical Squamous Cell Carcinoma and Endocervical Adenocarcinoma; LIHC: Liver Hepatocellular Carcinoma; STAD: Stomach Adenocarcinoma; LUAD: Lung Adenocarcinoma; BRCA: Breast Invasive Carcinoma; LUSC: Lung Squamous Cell Carcinoma; UCEC: Uterine Corpus Endometrial Carcinoma; GBM: Glioblastoma Multiforme; COAD: Colon Adenocarcinoma; KIRC: Kidney Clear Cell Carcinoma and; ESCA: Esophageal Carcinoma. Additional prostate cancer data from the MSKCC Prostate Oncogenome Project22 and the SU2C/PCF Dream Team project in metastatic prostate cancer25 were downloaded from cBioPortal.
Spearman correlations were calculated to evaluate WISP1 mRNA co-occurrence with inflammatory cytokines (IFN-γ, TNF-α, IL-6, CSF-1), T cell markers (CD8A, CD8B, IL2RA, IL2RB, IL7R, IL18R1, PRF1, GZMB), immune checkpoints (CD274, CTLA-4, HAVCR2, LAG3) and EMT (CDH1, CDH2, VIM, ZEB1, SNAI1 and TWIST1). Statistical significance for these correlations was based on q values which were adjusted for over 20,000 comparisons (a q value <0.05 was considered significant). Purity-corrected partial Spearman correlations between WISP1 mRNA expression and different immune cell types were based on the Tumor Immune Estimation Resource (TIMER) immune cell gene signatures54,55 and were obtained from the TIMER manuscript’s Supplementary Materials. Of note, TIMER signatures were available only for TCGA datasets.
Finally, Cox proportional hazards analyses to detect associations between WISP1 mRNA expression and overall survival in the above-mentioned TCGA datasets were obtained from the OncoLnc website (www.oncolnc.org)24. These analyses were corrected for age, gender, and grade or histology (when available). We conducted a separate Cox analysis for the SKCM (skin cutaneous melanoma) TCGA dataset, which also corrected for tissue type (primary or metastatic).
In the MSKCC dataset, there were 27 recurrences in 131 patients, and this dataset did not include any normal tissue. The additional samples coming from metastases were excluded from the analysis. Moreover, overall survival analysis was not conducted since only three patients had prostate-cancer specific deaths.
Of the 496 patients in the TCGA prostate adenocarcinoma dataset with tumor samples, 95 had a missing or ambiguous biochemical recurrence status. Thus, recurrence analysis was conducted with the remaining 401 tumor samples, with a total of 52 recurrences.
Patients and prostate adenocarcinoma tissue microarray (TMA)
For the construction of the TMA, prostate adenocarcinoma specimens were obtained from radical prostatectomy of 300 patients treated at the Centre Hospitalier de l’Université de Montréal (CHUM) between 1993 and 2006. Each patient was given written consent to the inclusion of material pertaining to themselves, and were fully anonymized. After pathologist’s review, 15 patients were excluded from the analysis. A total of 285 patients were evaluable, arrayed on 6 TMA blocks. Cores (0.6 mm) of benign prostate tissues adjacent to the tumor and malignant tissues were spotted in duplicates. A pathologist reviewed each core and misclassified cores were reclassified. Patients’ clinicopathologic characteristics are detailed in Table 1.
Manual immunofluorescence (IF) of the TMA
Multicolor manual immunofluorescence (IF) was performed to simultaneously stain WISP1, CD8 and cytokeratins (CK) 8 and 18. TMA slides were deparaffinized and rehydrated with xylene 100% and alcohols (90%, 70% and 50% successively). Then, endogenous peroxidases were blocked using diluted hydrogen peroxide and an antigen retrieval step was performed at 96°C with the Dako Target Retrieval Solution (S1699) for 40 minutes. Slides were cooled down for 15 minutes until the temperature reached 65 °C, and were then washed for 5 minutes with cold water. Tissue sections were blocked for 30 minutes at room temperature with Dako Serum-Free Protein Blocking buffer (X0909). The following primary antibodies were incubated overnight at 4°C: anti-WISP1 (4A12E1 previously validated12 mouse monoclonal IgG2b purified clone; 1:500 dilution), anti-CD8 (Dako mouse monoclonal IgG1, 1:100 dilution; M710301-2) and anti-CK 8–18 for epithelial staining (Dako rabbit monoclonal anti-CK 8–18, clone EP17/30 (IR094), 1:2 dilution). Slides were washed three times the following day before being stained with the following secondary antibodies for 2 hours, at room temperature: anti-mouse coupled to Alexa Fluor 594 IgG2b (for anti-WISP1; 1:400 dilution; Life Technologies; A-21145); anti-mouse coupled to Alexa Fluor 647 IgG1 (for anti-CD8; dilution 1:400; Life Technologies; A-21240); anti-rabbit coupled to Alexa Fluor 750 H + L (for anti-CK 8–18; 1:400 dilution; Life Technologies; A-21039). During the last 10 minutes of the 2-hour staining, DAPI (1:10 000 dilution) staining was used for nuclear imaging. Slides were left to dry for 30 minutes, and were then mounted with #1.5 coverslips using Prolong Gold (Thermo Fisher; P36930). Following an overnight rest at 4°C, the slides were imaged with the VS-110 scanner (Olympus) for each color channel (anti-WISP1: TRITC channel; anti-CD8: Cy5 channel; anti-CK 8–18: Cy 7 channel).
IF staining quantification
Slides were visualized with the OlyVIA software (Olympus). Scanned images were imported into the VisioMorph software (Visiopharm) and each TMA core was separated and automatically labeled with their respective patient number and corresponding tissue (benign/tumor). For IF, expression levels were determined by the mean fluorescence intensity (MFI) of WISP1 in stromal as well as epithelial cytoplasmic and nuclear (DAPI) areas in each core. The CK 8–18 staining was used to create an epithelial/stromal mask allowing for the distinction between stromal and epithelial areas in each core (Supplementary Figure S2). The total fluorescence intensity of the WISP1 staining under each mask was measured. The MFI of WISP1 staining in epithelial versus stromal compartments was obtained by dividing the total WISP1 fluorescence intensity measurement by the area of its respective compartments. The mean MFI values of duplicate cores for each case were calculated. The intraclass correlation between the duplicate cores for WISP1 was 0.669 (p < 0.001) for the epithelium and 0.475 (p < 0.001) for the stroma. Although still statistically significant, the lower correlation between the duplicate cores of the stroma can be explained by the higher diversity of the microenvironment.
For the estimation of CD8+ cell density, 10% of all available cores were reviewed by an independent pathologist to confirm that the morphology of the positive was compatible with lymphocytes. Then, CD8+ cells were counted with the VisioMorph software (Visiopharm) in both stromal and epithelial areas in each core. Cells were included in the epithelial compartment if 50% or more of their total surface was included in this area. Otherwise, the cells were considered to be part of the stromal compartment. The percentage of the core occupied by the stroma and the epithelium compartment was estimated for each core. CD8+ cell density was then determined for each compartment (epithelium and stroma) by dividing cell count by the percentage of the core occupied by the compartment. Mean CD8+ cell density of duplicates was calculated and used for analysis.
WISP1 monoclonal antibody optimization
Recombinant WISP1 protein was used as an immunogen in a BSLB/c strain of mouse coupled with a myeloma type SP2/0. Ten hybridoma cell lines were shown to produce monoclonal antibody towards WISP1 judged by indirect ELISA. Supernatant from the top five producers was further tested using Western blotting using purified WISP1 and immunohistochemistry of sections of demineralized mouse bone known to produce WISP1. One clone (4A12E1) showed the highest sensitivity and specificity and was expanded and supernatant affinity purified. Further analysis of specificity in human samples was performed by Pierre-Olivier Gaudreau. HEK 293 human cells (ATCC; CRL-1573) were transfected with a WISP1 lentivirus (Gene Copoeia; EX-M0764-Lv225) or a control GFP lentivirus (this plasmid was a gift from Dr. Anne-Marie Mes-Masson at the CHUM Research Center). Of note, HEK 293 wild type cells are negative for WISP1 expression (https://www.proteinatlas.org/ENSG00000104415-WISP1/celltransfected). The specificity of the antibody, as determined by the positivity of control lentivirus versus WISP-1 lentivirus transfected cells, was evaluated both by Western Blot and by IF with in vitro cytology. Briefly, cell culture was conducted using DMEM media supplemented with 5% Fetal Bovine Serum. Cells were collected when confluence reached 70%. Cells were first washed with PBS and NaV (PTP inhibitor; 1:100 dilution) for 20 minutes on ice. They were then transferred to Eppendorf tubes using a cell scraper and centrifuged at 500g for 5 minutes at 4°C. Cell lysis was conducted using RIPA buffer (Thermo Scientific; 89900) and phosphatase and protease inhibitors (Halt cocktail, Thermo Fisher; 78440) for 20 minutes on ice (in a volume which was a least 5 volumes of the cell pellet), and the supernatant was collected after a 15-minute centrifugation at 20,000g. Protein was quantified using the Bradford method. For Western Blotting, a total of 20μg of protein per well was used, and samples were prepared for a final volume of 30μl using 3μl of DTT, 7.5 μl of 4X Laemlli Buffer (BioRad; 161–0747), and 19.5 μl of protein. For the staining procedure, the anti-WISP1 antibody was diluted 1:5000 and the β-actin control antibody (Cell Signaling; 4970) was diluted 1:3000. Images were scanned on an Odyssey Li-Cor Biosciences system and the Image Studio (version 3.1) software using the specific secondary antibodies: IRDye 800CW anti-mouse (Li-Cor Biosciences, 926–32210) for WISP1 and IRDye 680RD anti-rabbit (Li-Cor Biosciences; 926–68071) for ß-actin. Human recombinant WISP protein (i.e., the positive control) was obtained from Genscript (Z03204-25). For in vitro cytology, cells were cultured with Marienfeld Lab. Glassware slides (0117580) and manual immunofluorescence staining using the anti-WISP1 antibody was conducted as described in the previous section. The specificity of the WISP1 antibody was then evaluated on human tissues. Because cardiac tissue is the only human tissue with low expression of WISP1 (https://www.proteinatlas.org/ENSG00000104415-WISP1/tissue), it was selected as a negative control when compared with the staining of prostatic tissue. Manual IF on these tissues was conducted as described above. Antibody optimization procedures are shown in Supplementary Figure S1.
Two-way Mixed Lymphocyte Reaction (MLR) assays
Heparinized peripheral blood samples were collected from two healthy volunteers and peripheral blood mononuclear cells (PBMCs) were isolated on a density gradient using lymphocyte separation media (Wisent). Cells were cultured in RPM1 media supplemented with 10% human AB serum, glutamax (Wisent), penicillin, streptomycin and gentamycin (Wisent) in 96-well flat bottom plates at a density of 200,000 cells per well under the following conditions (5 wells per condition): 1) donor 1 PBMCs alone (negative control); 2) donor 2 PBMCs alone (negative control); 3) combined donor 1 and 2 PBMCs with 10 µl per well of 0.01 mM acetic acid (control for recombinant WISP1 treatment); 4) donor 1 and 2 PBMCs with 5µg/mL recombinant human WISP1 protein (Peprotech; 120–18); 5) donor 1 and 2 PBMCs with 0.5µg/mL recombinant WISP1 protein; 6) donor 1 and 2 PBMCs with 0.05µg/mL recombinant human WISP1 protein and; 7) donor 1 and 2 PBMCs with 0.005µg/mL recombinant human WISP1 protein. Supernatants were harvested on day 3 for cytokine quantitation (see the following section for further details).
Enzyme-linked immunosorbent assays (ELISAs) for inflammatory cytokines
Supernatants from the MLR experiments were harvested on day 3 to quantify cytokine levels. For IFN-γ, plates were incubated overnight at 4°C with the Endogen M-700A-E primary IFN-γ antibody. The plate was washed with PBS/Tween 20 (0.5%) the following day before blocking for 30 minutes using a PBS/5% FBS solution. Standard scaling was prepared using Endogen R-IFNG-50 human recombinant IFN-γ. Following washing, the plate was incubated for 90 minutes with the Endogen M-701-B biotinylated IFN-γ secondary antibody. Poly HRP-streptavidin (1:4000 dilution) was added for 30 minutes. Finally, TMB solution (Dako; S1600) was added for 5–10 minutes and the reaction was stopped with an HCl 2N solution. For IL-6 and TNF-α, Human Quantikine ELISA Kits from R&D Systems were used (S6050 and STA00C), and the respective protocols were followed according to the manufacturer’s instructions. Every reaction was performed in duplicates. Optical density was read using the VERSAMax Microplate Reader (Molecular Devices) at 570nm (to eliminate background) and 450nm, using the Soft Max Pro 4.7 software.
Statistical analyses
The GraphPad Prism (version 6) software was used for mean and median comparisons. To compare WISP1 expression in the tumor and benign adjacent compartments, a Kruskal–Wallis test with Dunn’s multiple comparison test were used. The association of WISP1 with the Gleason score groups was also evaluated with the Kruskal–Wallis test with Dunn’s multiple comparisons, and the association with pre-operative PSA level was evaluated with a two-tailed Spearman correlation. The SPSS software (version 24; SPSS Inc.) was used for Spearman correlations, Cox proportional hazard models and Kaplan–Meier analyses. WISP1 MFI and CD8+ cell density were correlated using a two-tailed Spearman correlation test. BCR was defined as a PSA level >0.2 ng/mL after radical prostatectomy. BCR-free survival was determined using Cox proportional hazard models for the TCGA and TMA. Additional Kaplan–Meier estimators were used for the TMA data for both BCR-free survival and metastasis-free survival (statistical significance was calculated by the log-rank test in this case). For the TMA analysis, the median values of WISP1 expression were used as cutoffs because the receiver-operating characteristics (ROC) curves were not informative (data not shown). Two groups of patients were generated to compare BCR-free survival: patients with values lower than the median were considered as having low WISP1 expression, and vice versa.
Public databases inquiry for anti-PD-1 resistance
To estimate if WISP1 may be a valuable target for patients treated with immunotherapy, three public databases of patients treated with anti-PD-1 immune checkpoint blockade were interrogated. The Ascierto et al.28 mRNA gene expression profile dataset was accessed through the corresponding NCBI website (http://www.ncbi.nlm.nih.gov/geo/query/acc.cgi?acc.GSE67501) and pre-treatment whole genome expression profile from four responders and eight nonresponders with renal cell carcinoma were compared. The Hugo et al. mRNA gene expression profile dataset6 contains 13 nonresponders and 15 responders to anti-PD-1 therapy in melanoma patients. As described in the original study, a gene was defined as differentially expressed between the responding and non-responding tumor groups when its median expression differed by at least twofold between the groups with a nominal two-sided Mann–Whitney (p-value ≤0.1). Table S2A of the reference paper was consulted to determine if WISP1 was part of that initial list of genes. The Riaz et al. mRNA gene expression profile dataset29 includes a total of 45 patients. Differential gene expression analysis was conducted with a generalized linear model and the Wald statistical test, and differentially expressed genes were considered for further analysis with a q-value <0.20. The clustering of DEGs was conducted with hierarchal clustering (i.e., Euclidean distance followed by the Ward agglomeration algorithm) to segregate upregulated and downregulated genes. Differentially expressed genes between responders and nonresponders in pre-therapy and on-therapy samples were accessed as part of the supplementary material (Table S6A) provided with the original manuscript.
Health and safety
All mandatory laboratory health and safety procedures have been complied with in the course of conducting this experimental work.
Funding Statement
This work was supported by the Canadian Institutes of Health Research [364476]; Fonds de Recherche du Québec - Santé [32667]; National Institute of Dental and Craniofacial Research [Z01 DE000379-21].
Acknowledgments
This work was supported by an operating grant to J. Stagg from the Canadian Institutes of Health Research (project grant number: 364476). PO Gaudreau was supported by the Fonds de Recherche Québec–Santé’s (FRQS) Resident Physician Health Research Career Training Program (32667). This work was also supported in part by a grant to M. Young from the National Institute of Dental and Craniofacial Research, NIH (grant number: Z01 DE000379-21). We also thank the molecular pathology core facility of the CRCHUM for use of the Ventana platform, the scanning of TMA slides and the use of the VisioMorph software.
Disclosure of Potential Conflicts of Interest
No potential conflicts of interest were disclosed.
Supplementary material
Supplemental data for this article can be accessed on the publisher’s website.
References
- 1.Hanahan D, Weinberg RA.. Hallmarks of cancer: the next generation. Cell. 2011;144(5):646–674. doi: 10.1016/j.cell.2011.02.013. [DOI] [PubMed] [Google Scholar]
- 2.Giri D, Ozen M, Ittmann M.. Interleukin-6 is an autocrine growth factor in human prostate cancer. Am J Pathol. 2001;159(6):2159–2165. doi: 10.1016/S0002-9440(10)63067-2. [DOI] [PMC free article] [PubMed] [Google Scholar]
- 3.Jin R, Yi Y, Yull FE, Blackwell TS, Clark PE, Koyama T, Smith JA Jr., Matusik RJ. NF-kappaB gene signature predicts prostate cancer progression. Cancer Res. 2014;74(10):2763–2772. doi: 10.1158/0008-5472.CAN-13-2543. [DOI] [PMC free article] [PubMed] [Google Scholar]
- 4.Ness N, Andersen S, Valkov A, Nordby Y, Donnem T, Al-Saad S, Busund LT, Bremnes RM, Richardsen E. Infiltration of CD8+ lymphocytes is an independent prognostic factor of biochemical failure-free survival in prostate cancer. Prostate. 2014;74(14):1452–1461. doi: 10.1002/pros.22862. [DOI] [PubMed] [Google Scholar]
- 5.Leclerc BG, Charlebois R, Chouinard G, Allard B, Pommey S, Saad F, Stagg J. CD73 expression is an independent prognostic factor in prostate cancer. Clin Cancer Res. 2016;22(1):158–166. doi: 10.1158/1078-0432.CCR-15-1181. [DOI] [PubMed] [Google Scholar]
- 6.Hugo W, Zaretsky JM, Sun L, Song C, Moreno BH, Hu-Lieskovan S, Berent-Maoz B, Pang J, Chmielowski B, Cherry G, et al. Genomic and transcriptomic features of response to Anti-PD-1 therapy in metastatic melanoma. Cell. 2016;165(1):35–44. doi: 10.1016/j.cell.2016.02.065. [DOI] [PMC free article] [PubMed] [Google Scholar]
- 7.Kwon ED, Drake CG, Scher HI, Fizazi K, Bossi A, van Den Eertwegh AJ, Krainer M, Houede N, Santos R Mahammedi H, et al. Ipilimumab versus placebo after radiotherapy in patients with metastatic castration-resistant prostate cancer that had progressed after docetaxel chemotherapy (CA184-043): a multicentre, randomised, double-blind, phase 3 trial. Lancet Oncol. 2014;15(7):700–712. doi: 10.1016/S1470-2045(14)70189-5. [DOI] [PMC free article] [PubMed] [Google Scholar]
- 8.Beer TM, Kwon ED, Drake CG, Fizazi K, Logothetis C, Gravis G, Ganju V, Polikoff J, Saad F Humanski P, et al. Randomized, double-blind, phase III trial of ipilimumab versus placebo in asymptomatic or minimally symptomatic patients with metastatic chemotherapy-naive castration-resistant prostate cancer. J Clin Oncol. 2017;35(1):40–47. doi: 10.1200/JCO.2016.69.1584. [DOI] [PubMed] [Google Scholar]
- 9.Gurbuz I, Chiquet-Ehrismann R. CCN4/WISP1 (WNT1 inducible signaling pathway protein 1): a focus on its role in cancer. Int J Biochem Cell Biol. 2015;62:142–146. doi: 10.1016/j.biocel.2015.03.007. [DOI] [PubMed] [Google Scholar]
- 10.Li J, Ye L, Owen S, Weeks HP, Zhang Z, Jiang WG. Emerging role of CCN family proteins in tumorigenesis and cancer metastasis (Review). Int J Mol Med. 2015;36(6):1451–1463. doi: 10.3892/ijmm.2015.2390. [DOI] [PMC free article] [PubMed] [Google Scholar]
- 11.Kular L, Pakradouni J, Kitabgi P, Laurent M, Martinerie C. The CCN family: a new class of inflammation modulators? Biochimie. 2011;93(3):377–388. doi: 10.1016/j.biochi.2010.11.010. [DOI] [PubMed] [Google Scholar]
- 12.Ono M, Inkson CA, Sonn R, Kilts TM, de Castro LF, Maeda A, Fisher LW, Robey PG, Berendsen AD, Li L, et al. WISP1/CCN4: a potential target for inhibiting prostate cancer growth and spread to bone. PLoS One. 2013;8(8):e71709. doi: 10.1371/journal.pone.0071709. [DOI] [PMC free article] [PubMed] [Google Scholar]
- 13.Murahovschi V, Pivovarova O, Ilkavets I, Dmitrieva RM, Docke S, Keyhani-Nejad F, Gogebakan O, Osterhoff M, Kemper M Hornemann S X, et al. WISP1 is a novel adipokine linked to inflammation in obesity. Diabetes. 2015;64(3):856–866. doi: 10.2337/db14-0444. [DOI] [PubMed] [Google Scholar]
- 14.van Den Bosch MH, Blom AB, Kram V, Maeda A, Sikka S, Gabet Y, Kilts TM, van Den Berg WB, van Lent PL, van der Kraan PM, et al. WISP1/CCN4 aggravates cartilage degeneration in experimental osteoarthritis. Osteoarthr Cartil. 2017;25:1900–1911. doi: 10.1016/j.joca.2017.07.012. [DOI] [PubMed] [Google Scholar]
- 15.Hou CH, Tang CH, Hsu CJ, Hou SM, Liu JF. CCN4 induces IL-6 production through alphavbeta5 receptor, PI3K, Akt, and NF-kappaB singling pathway in human synovial fibroblasts. Arthritis Res Ther. 2013;15(1):R19. doi: 10.1186/ar4151. [DOI] [PMC free article] [PubMed] [Google Scholar]
- 16.Zhang Q, Zhang C, Li X, Yu Y, Liang K, Shan X, Zhao K, Niu Q, Tian Z. WISP1 is increased in intestinal mucosa and contributes to inflammatory cascades in inflammatory bowel disease. Dis Markers. 2016;2016:3547096. doi: 10.1155/2016/3547096. [DOI] [PMC free article] [PubMed] [Google Scholar]
- 17.Wang H, Zhang R, Wen S, McCafferty DM, Beck PL, MacNaughton WK. Nitric oxide increases Wnt-induced secreted protein-1 (WISP-1/CCN4) expression and function in colitis. J Mol Med (Berl). 2009;87(4):435–445. doi: 10.1007/s00109-009-0445-4. [DOI] [PubMed] [Google Scholar]
- 18.Klee S, Lehmann M, Wagner DE, Baarsma HA, Konigshoff M. WISP1 mediates IL-6-dependent proliferation in primary human lung fibroblasts. Sci Rep. 2016;6:20547. doi: 10.1038/srep20547. [DOI] [PMC free article] [PubMed] [Google Scholar]
- 19.Chen Z, Ding X, Jin S, Pitt B, Zhang L, Billiar T, Li Q. WISP1-alphavbeta3 integrin signaling positively regulates TLR-triggered inflammation response in sepsis induced lung injury. Sci Rep. 2016;6:28841. doi: 10.1038/srep28841. [DOI] [PMC free article] [PubMed] [Google Scholar]
- 20.Jin S, Chen Z, Ding X, Zhao X, Jiang X, Tong Y, Billiar TR, Li Q. Mechanical ventilation augments poly(I:C)Induced Lung Injury Via A WISP1-Integrin beta3 dependent pathway in mice. Mol Med. 2016. doi: 10.2119/molmed.2015.00233. [DOI] [PMC free article] [PubMed] [Google Scholar]
- 21.Li HH, Li Q, Liu P, Liu Y, Li J, Wasserloos K, Chao W, You M, Oury TD Chhinder S, et al. WNT1-inducible signaling pathway protein 1 contributes to ventilator-induced lung injury. Am J Respir Cell Mol Biol. 2012;47(4):528–535. doi: 10.1165/rcmb.2012-0127OC. [DOI] [PMC free article] [PubMed] [Google Scholar]
- 22.Taylor BS, Schultz N, Hieronymus H, Gopalan A, Xiao Y, Carver BS, Arora VK, Kaushik P, Cerami E Reva B, et al. Integrative genomic profiling of human prostate cancer. Cancer Cell. 2010;18(1):11–22. doi: 10.1016/j.ccr.2010.05.026. [DOI] [PMC free article] [PubMed] [Google Scholar]
- 23.Cerami E, Gao J, Dogrusoz U, Gross BE, Sumer SO, Aksoy BA, Jacobsen A, Byrne CJ, Heuer ML Larsson E, et al. The cBio cancer genomics portal: an open platform for exploring multidimensional cancer genomics data. Cancer Discov. 2012;2(5):401–404. doi: 10.1158/2159-8290.CD-12-0095. [DOI] [PMC free article] [PubMed] [Google Scholar]
- 24.Anaya J. OncoLnc: linking TCGA survival data to mRNAs, miRNAs, and lncRNAs. PeerJ Comput Sci. 2016;2:e67. doi: 10.7717/peerj-cs.67. [DOI] [Google Scholar]
- 25.Robinson D, Van Allen EM, Wu YM, Schultz N, Lonigro RJ, Mosquera JM, Montgomery B, Taplin ME, Pritchard CC Attard G, et al. Integrative clinical genomics of advanced prostate cancer. Cell. 2015;162(2):454. doi: 10.1016/j.cell.2015.06.053. [DOI] [PubMed] [Google Scholar]
- 26.Becht E, Giraldo NA, Lacroix L, Buttard B, Elarouci N, Petitprez F, Selves J, Laurent-Puig P, Sautes-Fridman C WH Fridman, et al. Estimating the population abundance of tissue-infiltrating immune and stromal cell populations using gene expression. Genome Biol. 2016;17(1):218. doi: 10.1186/s13059-016-1070-5. [DOI] [PMC free article] [PubMed] [Google Scholar]
- 27.Danaher P, Warren S, Dennis L, D’Amico L, White A, Ml D, Ma G, Odunsi K, Beechem J, Fling SP. Gene expression markers of tumor infiltrating leukocytes. J Immunother Cancer. 2017;5:18. doi: 10.1186/s40425-017-0215-8. [DOI] [PMC free article] [PubMed] [Google Scholar]
- 28.Ascierto ML, Makohon-Moore A, Lipson EJ, Taube JM, McMiller TL, Berger AE, Fan J, Kaunitz GJ, Cottrell TR ZA Kohutek, et al. Transcriptional mechanisms of resistance to Anti-PD-1 therapy. Clin Cancer Res. 2017;23(12):3168–3180. doi: 10.1158/1078-0432.CCR-17-0270. [DOI] [PMC free article] [PubMed] [Google Scholar]
- 29.Riaz N, Havel JJ, Makarov V, Desrichard A, Urba WJ, Sims JS, Hodi FS, Martin-Algarra S, Mandal R WH Sharfman, et al. Tumor and microenvironment evolution during immunotherapy with nivolumab. Cell. 2017;171(4):934–949 e16. doi: 10.1016/j.cell.2017.09.028. [DOI] [PMC free article] [PubMed] [Google Scholar]
- 30.Bauer M, Su G, Casper C, He R, Rehrauer W, Friedl A. Heterogeneity of gene expression in stromal fibroblasts of human breast carcinomas and normal breast. Oncogene. 2010;29(12):1732–1740. doi: 10.1038/onc.2009.463. [DOI] [PMC free article] [PubMed] [Google Scholar]
- 31.Chiang KC, Yeh CN, Chung LC, Feng TH, Sun CC, Chen MF, Jan YY, Yeh TS, Chen SC, Juang HH. WNT-1 inducible signaling pathway protein-1 enhances growth and tumorigenesis in human breast cancer. Sci Rep. 2015;5:8686. doi: 10.1038/srep08686. [DOI] [PMC free article] [PubMed] [Google Scholar]
- 32.Heise RL, Stober V, Cheluvaraju C, Hollingsworth JW, Garantziotis S. Mechanical stretch induces epithelial-mesenchymal transition in alveolar epithelia via hyaluronan activation of innate immunity. J Biol Chem. 2011;286(20):17435–17444. doi: 10.1074/jbc.M110.137273. [DOI] [PMC free article] [PubMed] [Google Scholar]
- 33.Chuang JY, Chang AC, Chiang IP, Tsai MH, Tang CH. Apoptosis signal-regulating kinase 1 is involved in WISP-1-promoted cell motility in human oral squamous cell carcinoma cells. PLoS One. 2013;8(10):e78022. doi: 10.1371/journal.pone.0078022. [DOI] [PMC free article] [PubMed] [Google Scholar]
- 34.Pennica D, Ta S, Jw W, Ma R, Da L, Lee J, Brush J, LA T, Deuel B, Lew M, et al. WISP genes are members of the connective tissue growth factor family that are up-regulated in wnt-1-transformed cells and aberrantly expressed in human colon tumors. Proc Natl Acad Sci U S A. 1998;95(25):14717–14722. [DOI] [PMC free article] [PubMed] [Google Scholar]
- 35.Tong Y, Ding XB, Chen ZX, Jin SQ, Zhao X, Wang X, Mei SY, Jiang X, Wang L, Li Q. WISP1 mediates hepatic warm ischemia reperfusion injury via TLR4 signaling in mice. Sci Rep. 2016;6:20141. doi: 10.1038/srep20141. [DOI] [PMC free article] [PubMed] [Google Scholar]
- 36.Wu CL, Tsai HC, Chen ZW, Wu CM, Li TM, Fong YC, Tang CH. Ras activation mediates WISP-1-induced increases in cell motility and matrix metalloproteinase expression in human osteosarcoma. Cell Signal. 2013;25(12):2812–2822. doi: 10.1016/j.cellsig.2013.09.005. [DOI] [PubMed] [Google Scholar]
- 37.Maiese K. WISP1: clinical insights for a proliferative and restorative member of the CCN family. Curr Neurovasc Res. 2014;11:378–389. [DOI] [PMC free article] [PubMed] [Google Scholar]
- 38.Mak MP, Tong P, Diao L, Cardnell RJ, Gibbons DL, William WN, Skoulidis F, Parra ER, Rodriguez-Canales J, Wistuba II, et al. A patient-derived, Pan-cancer EMT signature identifies global molecular alterations and immune target enrichment following epithelial-to-mesenchymal transition. Clin Cancer Res. 2016;22(3):609–620. doi: 10.1158/1078-0432.CCR-15-0876. [DOI] [PMC free article] [PubMed] [Google Scholar]
- 39.Klinke DJ., 2nd. Induction of Wnt-inducible signaling protein-1 correlates with invasive breast cancer oncogenesis and reduced type 1 cell-mediated cytotoxic immunity: a retrospective study. PLoS Comput Biol. 2014;10(1):e1003409. doi: 10.1371/journal.pcbi.1003409. [DOI] [PMC free article] [PubMed] [Google Scholar]
- 40.Kulkarni YM, Chambers E, McGray AJ, Ware JS, Bramson JL, Klinke DJ 2nd.. A quantitative systems approach to identify paracrine mechanisms that locally suppress immune response to Interleukin-12 in the B16 melanoma model. Integr Biol (Camb). 2012;4(8):925–936. doi: 10.1039/c2ib20053h. [DOI] [PMC free article] [PubMed] [Google Scholar]
- 41.Wu J, Long Z, Cai H, Du C, Liu X, Yu S, Wang Y. High expression of WISP1 in colon cancer is associated with apoptosis, invasion and poor prognosis. Oncotarget. 2016;7(31):49834–49847. doi: 10.18632/oncotarget.10486. [DOI] [PMC free article] [PubMed] [Google Scholar]
- 42.Venkatachalam K, Venkatesan B, Valente AJ, Melby PC, Nandish S, Reusch JE, Clark RA, Chandrasekar B. WISP1, a pro-mitogenic, pro-survival factor, mediates tumor necrosis factor-alpha (TNF-alpha)-stimulated cardiac fibroblast proliferation but inhibits TNF-alpha-induced cardiomyocyte death. J Biol Chem. 2009;284(21):14414–14427. doi: 10.1074/jbc.M809757200. [DOI] [PMC free article] [PubMed] [Google Scholar]
- 43.Reddy VS, Valente AJ, Delafontaine P, Chandrasekar B. Interleukin-18/WNT1-inducible signaling pathway protein-1 signaling mediates human saphenous vein smooth muscle cell proliferation. J Cell Physiol. 2011;226(12):3303–3315. doi: 10.1002/jcp.22676. [DOI] [PMC free article] [PubMed] [Google Scholar]
- 44.Quiros M, Nishio H, Pa N, Siuda D, Jc B, Azcutia V, Hilgarth R, Mn O, Garcia-Hernandez V, Leoni G, et al. Macrophage-derived IL-10 mediates mucosal repair by epithelial WISP-1 signaling. J Clin Invest. 2017;127(9):3510–3520. doi: 10.1172/JCI90229. [DOI] [PMC free article] [PubMed] [Google Scholar]
- 45.Yoshioka Y, Ono M, Maeda A, Kilts TM, Hara ES, Khattab H, Ueda J, Aoyama E, Oohashi T Takigawa M, et al. CCN4/WISP-1 positively regulates chondrogenesis by controlling TGF-beta3 function. Bone. 2016;83:162–170. doi: 10.1016/j.bone.2015.11.007. [DOI] [PMC free article] [PubMed] [Google Scholar]
- 46.van Den Bosch MH, Gleissl TA, Blom AB, van Den Berg WB, van Lent PL, van der Kraan PM. Wnts talking with the TGF-beta superfamily: WISPers about modulation of osteoarthritis. Rheumatology (Oxford). 2016;55(9):1536–1547. doi: 10.1093/rheumatology/kev402. [DOI] [PubMed] [Google Scholar]
- 47.Tsai HC, Tzeng HE, Huang CY, Huang YL, Tsai CH, Wang SW, Wang PC, Chang AC, Fong YC, Tang CH. WISP-1 positively regulates angiogenesis by controlling VEGF-A expression in human osteosarcoma. Cell Death Dis. 2017;8(4):e2750. doi: 10.1038/cddis.2017.518. [DOI] [PMC free article] [PubMed] [Google Scholar]
- 48.Chuang JY, Chen PC, Tsao CW, Chang AC, Lein MY, Lin CC, Wang SW, Lin CW, Tang CH. WISP-1 a novel angiogenic regulator of the CCN family promotes oral squamous cell carcinoma angiogenesis through VEGF-A expression. Oncotarget. 2015;6(6):4239–4252. doi: 10.18632/oncotarget.2978. [DOI] [PMC free article] [PubMed] [Google Scholar]
- 49.Sahin Ersoy G, Altun Ensari T, Subas S, Giray B, Simsek EE, Cevik O. WISP1 is a novel adipokine linked to metabolic parameters in gestational diabetes mellitus. J Matern Fetal Neonatal Med. 2017;30(8):942–946. doi: 10.1080/14767058.2016.1192118. [DOI] [PubMed] [Google Scholar]
- 50.Zhang H, Luo H, Jiang Z, Yue J, Hou Q, Xie R, Wu S. Fractionated irradiation-induced EMT-like phenotype conferred radioresistance in esophageal squamous cell carcinoma. J Radiat Res. 2016;57(4):370–380. doi: 10.1093/jrr/rrw030. [DOI] [PMC free article] [PubMed] [Google Scholar] [Retracted]
- 51.Gao J, Aksoy BA, Dogrusoz U, Dresdner G, Gross B, Sumer SO, Sun Y, Jacobsen A, Sinha R, Larsson E, et al. Integrative analysis of complex cancer genomics and clinical profiles using the cBioPortal. Sci Signal. 2013;6(269):pl1. doi: 10.1126/scisignal.2004088. [DOI] [PMC free article] [PubMed] [Google Scholar]
- 52.Subramanian A, Tamayo P, Mootha VK, Mukherjee S, Ebert BL, Gillette MA, Paulovich A, Pomeroy SL, Glub TR, ES Lander, et al. Gene set enrichment analysis: a knowledge-based approach for interpreting genome-wide expression profiles. Proc Natl Acad Sci U S A. 2005;102(43):15545–15550. doi: 10.1073/pnas.0506580102. [DOI] [PMC free article] [PubMed] [Google Scholar]
- 53.Sergushichev A. An algorithm for fast preranked gene set enrichment analysis using cumulative statistic calculation. bioRxiv. 2016;060012:1–9. [Google Scholar]
- 54.Li T, Fan J, Wang B, Traugh N, Chen Q, Liu JS, Li B, Liu XSTIMER. A web server for comprehensive analysis of tumor-infiltrating immune cells. Cancer Res. 2017;77(21):e108–e110. doi: 10.1158/0008-5472.CAN-17-0307. [DOI] [PMC free article] [PubMed] [Google Scholar]
- 55.Li B, Severson E, Pignon JC, Zhao H, Li T, Novak J, Jiang P, Shen H, Aster JC Rodig S, et al. Comprehensive analyses of tumor immunity: implications for cancer immunotherapy. Genome Biol. 2016;17(1):174. doi: 10.1186/s13059-016-1028-7. [DOI] [PMC free article] [PubMed] [Google Scholar]
Associated Data
This section collects any data citations, data availability statements, or supplementary materials included in this article.