

Abstract
Background
Abdominal and thoracic CT provide a valuable opportunity for osteoporosis screening regardless of the clinical indication for imaging.
Purpose
To establish reference normative ranges for first lumbar vertebra (L1) trabecular attenuation values across all adult ages to measure bone mineral density (BMD) at routine CT.
Materials and Methods
Reference data were constructed from 20 374 abdominal and/or thoracic CT examinations performed at 120 kV. Data were derived from adults (mean age, 60 years ± 12 [standard deviation]; 56.1% [11 428 of 20 374] women). CT examinations were performed with (n = 4263) or without (n = 16 111) intravenous contrast agent administration for a variety of unrelated clinical indications between 2000 and 2018. L1 Hounsfield unit measurement was obtained either with a customized automated tool (n = 11 270) or manually by individual readers (n = 9104). The effects of patient age, sex, contrast agent, and manual region-of-interest versus fully automated L1 Hounsfield unit measurement were assessed using multivariable logistic regression analysis.
Results
Mean L1 attenuation decreased linearly with age at a rate of 2.5 HU per year, averaging 226 HU ± 44 for patients younger than 30 years and 89 HU ± 38 for patients 90 years or older. Women had a higher mean L1 attenuation compared with men (P < .008) until menopause, after which both groups had similar values. Administration of intravenous contrast agent resulted in negligible differences in mean L1 attenuation values except in patients younger than 40 years. The fully automated method resulted in measurements that were average 21 HU higher compared with manual measurement (P < .004); at intrapatient subanalysis, this difference was related to the level of transverse measurement used (midvertebra vs off-midline level).
Conclusion
Normative ranges of L1 vertebra trabecular attenuation were established across all adult ages, and these can serve as a quick reference at routine CT to identify adults with low bone mineral density who are at risk for osteoporosis.
© RSNA, 2019
Online supplemental material is available for this article.
See also the editorial by Smith in this issue.
Summary
Our study provides normative values of L1 vertebra trabecular attenuation, which can serve as a quick reference for opportunistic osteoporosis screening at routine CT to identify adults with low bone mineral density who are at risk for osteoporosis, and who could potentially benefit from further evaluation and possible intervention.
Key Points
■ Population-based age-related bone density loss measured by L1 trabecular attenuation at CT is fairly constant and predictable, averaging 2.5 HU per year.
■ Beyond menopause, women and men have similar mean L1 trabecular attenuation values.
Introduction
The prevalence of osteoporosis and the associated economic burden related to complicating fragility fractures is projected to increase worldwide because of the rapidly growing elderly population (1,2). The most widely used screening tool for fracture risk involves the combination of clinical risk factor assessment and the use of dual-energy x-ray absorptiometry (DXA) to measure bone mineral density (BMD). However, despite the known morbidity related to osteoporotic fractures and availability of screening guidelines, osteoporosis is an underdiagnosed and undertreated condition (3–5).
Routine CT of the chest and/or abdomen performed for other clinical indications is an opportunity for opportunistic screening of osteoporosis to improve screening rates at no additional cost, time, or radiation exposure to patients (6–8). Routine sagittal reconstruction of the CT data allows for the facile detection of vertebral compression fractures, which may be an incidental finding (9). We have previously shown that anterior trabecular CT attenuation values of the L1 vertebra measured in Hounsfield units and by using a rapid region-of-interest (ROI) approach not only correlates with T-scores from DXA (8), but also are statistically significantly lower in patients with vertebral compression fractures (10). Importantly, both men and women with low Hounsfield unit values were at statistically significantly higher risk for future fragility fractures in a retrospective elderly cohort (11). CT-based L1 trabecular attenuation can be manually measured by using a simple ROI approach with excellent interobserver agreement (12–14) or measured with a validated fully automated CT tool (15). Whereas the third National Health and Nutrition Examination Survey study was established as the normative reference standard for describing osteoporosis with DXA to determine T-scores (16,17), to our knowledge there is no such reference standard for L1 trabecular attenuation values derived from CT examinations.
The purpose of our study is to construct a CT-based reference standard for BMD measured by L1 trabecular attenuation in adults. Establishing normative ranges across the adult age spectrum would provide a useful reference for opportunistic osteoporosis screening, and would help identify adults at risk for osteoporosis who could potentially benefit from further evaluation and intervention.
Materials and Methods
Patient Cohort
Our retrospective study was conducted at a single academic medical center and approved by the institutional review board. The need for informed consent was waived for this retrospective Health Insurance Portability and Accountability Act– compliant study.
Our study cohort included data from over 20 000 body CT examinations derived from men and women aged 18–100 years who were patients at our institution for a wide variety of unrelated indications between April 2000 and January 2018. Our primary goal was to achieve a large representative sample and include a broad range of patient ages and conditions. The final cohort included a convenience sample of both asymptomatic outpatients and a wide variety of symptomatic patients who underwent imaging for a multitude of conditions and indications. Some of the subcohorts were derived from previous related studies that focused on issues other than the current goal of normative L1 Hounsfield unit data accumulation (8,10,11,14,18,19). In general, each subcohort represented its own consecutive series, except for any exclusions, which were then combined into the final cohort. Beyond this, additional ad hoc age-specific patient inclusion focused on remaining data gaps in terms of patient age so that each age category (eg, <30 years, ≥90 years, and each 5-year interval in between) included more than 250 CT-based L1 Hounsfield unit measurements, which we set as an arbitrary minimum. In general, our patient population was largely white (∼90%), precluding substantive subanalysis on the basis of ethnic groups.
CT Examinations
CT examinations were performed at our medical center and analyzed as previously described (8,10,11). Briefly, chest and/or abdominal CT examinations were performed by using a variety of multidetector CT scanners from a single vendor (GE Healthcare, Waukesha, Wis) at a constant peak voltage of 120 kV with variable tube current values that were protocol specific but clinically appropriate for achieving a diagnostic examination for the given indication. The modulated range was 40–600 mA, and the noise index ranged from 14 to 60 on the basis of the specific indication. CT examinations performed at voltage settings other than 120 kV were excluded. We included examinations either with or without intravenous and oral contrast agent (the use of intravenous contrast agent was recorded). Scanning was typically performed at the portal venous phase. Weight-based intravenous contrast agent with an injection rate of 3 mL/sec was standard. The CT scanners were calibrated daily for quality control throughout the study period by using an American College of Radiology–accredited phantom to ensure reproducible attenuation numbers.
Image Analysis
L1 trabecular attenuation values were measured from CT images either manually or by using a customized fully automated tool. The L1 vertebral level was determined to be an optimal target for opportunistic screening because it is easily identifiable and defined as the first non-rib-bearing vertebra, it is included on all abdominal and chest CT examinations, it typically has fewer degenerative changes, and it has the closest correlation with BMD measured at DXA compared with other vertebral levels (8).
For manual measurements, an ovoid ROI was placed in the anterior aspect of the L1 trabecular space on a single transverse (axial) CT image to measure mean attenuation (in Hounsfield units), as shown in Figure 1. This manual measurement, performed by seven different readers with widely varying experience in CT interpretation (ie, ranging from medical students to experienced senior staff radiologists), requires little training and has shown good interobserver agreement (14). Cortical bone, focal abnormalities or lesions, and artifacts were deliberately avoided at all examinations, and the patient was excluded if a reliable L1 trabecular measurement was not feasible. We also avoided the midvertebral level where a zone of higher density is often visible on the sagittal view (20), typically selecting a representative trabecular level centered between this midline zone and the superior endplate (Fig 2). L1 Hounsfield unit measurement was performed on a standard picture archiving and communication system workstation (McKesson, San Francisco, Calif) by a number of trained reviewers ranging from trainees to experienced faculty. This technique has shown (14) good interobserver agreement. If the L1 level was unsuitable for measurement (eg, because of a compression fracture or focal abnormality), the L2 or T12 levels can serve as acceptable substitutes in practice, but such examinations were excluded for our study. Patients were also excluded for diffuse involvement by osseous metastatic disease, confounding metabolic bone disease, or acute high-impact trauma. For the purposes of opportunistic screening, anterior trabecular ROI placement on the sagittal view is also acceptable (18) because this view also facilitates vertebral fracture detection. However, we only used the axial (transverse) plane for L1 measurements for our study.
Figure 1:

Examples of age-related bone loss by trabecular L1 attenuation assessment at CT. Transverse (axial) CT scans at the L1 level (top row) in adult patients of varying ages (age and sex denoted at the bottom). Magnified views of the L1 vertebra are shown in soft tissue (second row from top) and bone (third row from top). Standard placement of the region of interest (ROI) for trabecular attenuation measurement and the mean Hounsfield unit value within the ROI are shown in the third row from the top. Sagittal reconstructions with soft tissue and bone windows are shown (bottom row; including sagittal L1 ROI placement for the first patient, left). As is typical, trabecular attenuation values progressively decreased with increasing patient age. The loss of bone mineral density is more apparent on soft tissue images (top two rows). F = female, M = male.
Figure 2:

Example from manual-automated subanalysis. Unenhanced sagittal CT images centered on the lumbar spine from a 66-year-old man in, A, soft tissue and, B, bone windows show the L1 level (arrows). Note the higher band of trabecular density at the midvertebral level. C, Magnified view of L1 shows the level of axial manual region-of-interest (ROI) placement for the subanalysis comparison with the automated technique; the yellow midline placement matches the automated level, whereas the white line reflects the standard manual level. The manual sagittal ROI placement is shown in B. The 20-HU increase observed in this subanalysis with the automated technique can be explained by the different level for ROI placement.
An earlier version of the fully automated trabecular BMD measurement tool was previously described (15), and we slightly revised it for our study. The computer algorithm automatically segmented the spine on the basis of thresholding, region growing, watershed, and directed graph search. The spinal column was then partitioned into individual vertebrae by using curved planar reformation and dynamic programming. The L1 level was isolated by first identifying T12 as the vertebra that contains the lowest rib. By default, we considered the first non-rib-bearing vertebra to represent L1 (the actual level used among T12–L2 is likely inconsequential). The cortex was removed with adaptive morphologic erosion so that only trabecular bone was included in the BMD measurement. The revised automated tool placed the ROI in the middle axial segment at the anterior third of the vertebral body to simulate manual measurement and avoid the venous plexus. The size of the ROI was preset to be half of the width and a fourth of the anteroposterior length. This automated tool was a robust measure and, in our experience, the success rate was greater than 99% (19).
One important potential difference between the automated and manual ROI methods in our study was the specific craniocaudal level used for ROI placement (ie, the midvertebral level for the former, but off midline for the latter). To evaluate for associated differences in mean Hounsfield unit measurements, we performed a subanalysis of 100 consecutive unenhanced CT examinations from the automated cohort, whereby several manual ROI Hounsfield unit measurements were obtained as shown in Figure 2, wherein the radiologists were blinded to the automated result.
Statistical Analysis
Continuous variables were reported with mean, median, and standard deviation. Categorical variables were reported by using counts and percentages. The data were analyzed by using software (SPSS Statistics 23, IBM, Armonk, NY; R Core Team 2015, R Foundation for Statistical Computing, Vienna, Austria, https://www.Rproject.org/; and Excel, Microsoft, Redmond, Wash). The rms package in R was used for multivariate linear regression analysis (Frank E Harrell Jr [2018], https://CRAN.R-project.org/package=rms). Mann-Whitney U tests were used to assess differences in means of continuous variables. Two-sided P values less than .05 were considered to indicate statistical significance (21). All error ranges in graphs were reported ± standard deviation (Figs 3, 4). A linear regression model was used with R (R Foundation for Statistical Computing) to derive the decline in Hounsfield units as a function of patient age. In addition, a multivariable linear regression analysis was performed to control for the covariates of sex, intravenous contrast agent, and manual versus automated technique when assessing the effect of patient age by using the ordinary least squares method. In the multivariate analysis, the age variable was transformed by using a restricted cubic spline function with five knots to allow for nonlinear association between attenuation and age to be estimated.
Figure 3:

Plot shows normative reference values for trabecular L1 attenuation values for opportunistic osteoporosis screening. The median and the mean ± standard deviation (SD) values for L1 trabecular attenuation in Hounsfield units are shown for each age group (x-axis). The plot of the mean Hounsfield units (red dots) shows that age-related L1 trabecular bone loss is fairly linear. The normative reference ranges can serve as a quick reference while performing CT examination for other clinical indications. Error bars indicate standard deviations, which are fairly uniform across the age spectrum.
Figure 4:

Variations in mean L1 trabecular attenuation values according to sex, presence of intravenous (IV) contrast agent, and method of measurement (manual vs automated [auto]). Mean L1 trabecular attenuation is higher for women until postmenopausal age, when values for men and women are strikingly similar (top). The effect of intravenous contrast agent is most notable for patients younger than 40 years. For older adults, the effect of intravenous contrast agent may not be clinically relevant for opportunistic bone mineral density screening (middle). The fully automated technique for L1 trabecular attenuation yields higher values compared with manual region-of-interest placement (average, ∼20 HU) (bottom). Age groups are on the x-axis and error bars indicate standard deviations. * P < .01; ** P < .005.
Results
The normative L1 Hounsfield unit reference standards were constructed from 20 374 CT examinations in patients aged 18–100 years (mean age, 60 years ± 12 [standard deviation]; median age, 59 years) performed for a wide range of clinical indications other than bone health evaluation. The cohort included men (43.9% [8946 of 20 374]) and women (56.1% [11 428 of 20 374]). For the entire cohort, CT examinations were performed either with (20.9% [4263 of 20 374]) or without intravenous contrast agent. L1 trabecular attenuation was measured either manually (44.7% [9104 of 20 374]) or by a fully automated method of selecting the ROI. Each CT examination was stratified by age groups in 5-year intervals from younger than 30 years to 90 years or older. Each age group contained at least 250 data points (range, 252–5059) where at least 165 L1 trabecular attenuation values were manually measured (range, 165–1528). The majority (86.5% [17 628 of 20 374]) of CT examinations were in patients aged 50–80 years. The frequency distribution of all CT examinations stratified by age, sex, use of intravenous contrast agent, and method of selecting the ROI are in Figure E1 [online].
The mean L1 trabecular attenuation value of the entire cohort was 160 HU ± 49, whereas patients younger than 30 years had a mean L1 trabecular attenuation value of 226 HU ± 44 and patients 90 years or older had a mean L1 trabecular attenuation value of 89 HU ± 38. Mean L1 trabecular attenuation values (at 120 kV) of the entire cohort according to age groups are summarized in Figure 3. The mean L1 Hounsfield unit values showed a linear decrease with age at a rate of 2.5 HU per year (R2 = 0.99 by using best fit to age group mean). The standard deviation from the mean L1 Hounsfield unit values showed limited variation among the different age groups. Multivariable regression analysis confirmed that age was clearly the dominant determinate of Hounsfield unit decrease after controlling for the covariates of sex, intravenous contrast agent, and manual versus automated methods, and that the association between age and attenuation was nonlinear (Table E1, E2 [online]; Fig E2 [online]).
We further stratified the L1 trabecular measurements by sex because there are sex differences in BMD as measured at DXA, that BMD in women declines more rapidly after menopause, and that women in general experience higher rates of fragility fractures (1,2). Our data showed that women had a higher L1 trabecular attenuation compared with men until age 54 years (P < .01), after which both groups had similar L1 Hounsfield unit values (P = .02–.99) (Fig 4). Furthermore, we evaluated whether the administration of intravenous contrast agent at CT substantially affected the trabecular BMD measurements. Stratification according to the use of intravenous contrast agent resulted in generally negligible differences in L1 attenuation values except in patient cohorts younger than 40 years (Fig 4). Statistically significant and likely relevant differences between the noncontrast and the intravenous contrast agent groups were only observed in patients younger than 34 years and in the 50–54 years and 60–64 years age groups.
Finally, we compared L1 Hounsfield unit values according to the manual versus fully automated method. Our data showed that the fully automated method resulted in measurements that were an average of 21 HU higher compared with manual CT-based L1 trabecular attenuation measurements in all age groups older than 50 years (P < .004) (Fig 4). The blinded manual subanalysis performed on 100 consecutive CT scans from the automated cohort demonstrated a mean attenuation value for the midvertebral axial measurement, the off-midline axial measurement (that matches our standard manual axial approach), and the manual sagittal measurement of 156 HU ± 42, 139 HU ± 43, and 146 HU ± 44, respectively, compared with 159 HU ± 45 for the automated midline axial measurement (Fig 2). The mean difference of 20 HU between the standard manual off-midline ROI and automated midline axial measurements matched well with our overall findings and was statistically significant (P < .002). This effect was more pronounced at lower BMD levels. The mean difference was 3 HU between the manual and automated midline axial measurements, which was not statistically significant (P = .63).
The mean and median normative L1 trabecular attenuation values by age and according to sex, the use of intravenous contrast agent, and the method of selecting the ROI are shown in the Table.
L1 Attenuation by Age According to Sex, Administration of Intravenous Contrast Agent, and Manual and Automated Method
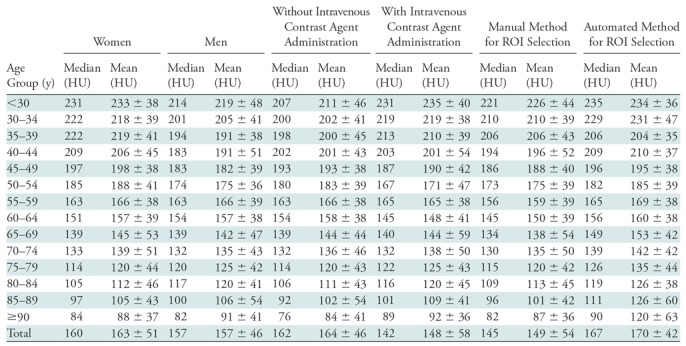
Note.—Mean data are ± standard deviation. ROI = region of interest.
Discussion
Our study helps to establish the normative values for L1 trabecular Hounsfield units for rapid opportunistic bone mineral density (BMD) assessment at CT by using a large sample size. It is important to note that these values apply only to CT performed at 120 kV. Whereas previous studies (10,11,22) showed the clinical efficacy of L1 trabecular attenuation values, to our knowledge the normal ranges of Hounsfield units across age groups are not yet adequately described. At the population level, we found that age-related bone density loss measured by using L1 trabecular CT attenuation averaged 2.5 HU per year. We also found that premenopausal women had higher L1 trabecular attenuation values on average compared with age-matched men, and that, beyond menopause, women and men had similar mean L1 trabecular attenuation values. We also explored the effect of intravenous contrast agent and the utility of a fully automated approach for L1 trabecular assessment.
Previous studies sought to establish threshold Hounsfield units values for the diagnosis of osteoporosis by correlating BMD measurements from simple L1 trabecular attenuation values to those from DXA scans in the same patient cohort. The study with the largest cohort (n = 1867) reported that a Hounsfield unit threshold of 135 optimized the correlation with the receiver operating characteristic analysis, whereas a threshold of 110 HU was over 90% specific for osteoporosis (8). Other smaller studies have suggested threshold Hounsfield unit measurements of 136 HU (23) and 99 HU (24). In general, a lower L1 Hounsfield unit threshold, such as 90–110 HU, would be more specific and less sensitive for osteoporosis, whereas higher Hounsfield unit threshold would be less specific and more sensitive. A study of patients 65 years or older showed that an L1 trabecular attenuation of 90 HU or less could indicate a worse fracture-free survival, where the median follow-up interval was 5.8 years (11). Another study (10) showed that a 90-HU threshold was optimal for accurately determining prevalent vertebral fractures at receiver operating characteristic curve analysis. This study also showed that the odds ratio of a moderate or severe vertebral compression fracture was 31.9 for L1 attenuation of 90 HU or less. Therefore, in general, for L1 values less than 100 HU (at 120 kV) we indicated in our clinical reports that this finding is concerning for osteoporosis and higher fracture risk. If there is a prevalent vertebral compression fracture in the setting of low BMD according to L1 Hounsfield units (eg, <150 HU), this likely represents established osteoporosis, regardless of the DXA T-score.
Because intravenous contrast media can enter and enhance the trabecular space, we examined the effect of the use of intravenous contrast agent at L1 Hounsfield unit measurements. We observed that this effect is minimal among middle-aged and elderly populations, in whom opportunistic CT-based screening is most likely to be used. A previous study (8) reported that the administration of intravenous contrast agent did not affect the ability of L1 trabecular attenuation measurements to be used to diagnose osteoporosis at DXA. However, studies (25,26) that examined trabecular attenuation before and after contrast administration in the same patient at a single session reported mean trabecular attenuation differences of 11 HU and 18 HU, respectively, but the effect was variable between individual patients. It is debatable regarding whether such Hounsfield unit differences would be meaningful enough in the setting of opportunistic screening to warrant separate thresholds, especially given the apparent minimal effect in older adults.
After menopause, L1 Hounsfield unit values match fairly closely between men and women, although fracture risks may still differ due to other factors. The same pattern between the sexes was observed in a study (27) that examined single sections of L1, L2, and L3 vertebrae at quantitative CT, but this pattern was not observed in the femoral neck, distal radius, and distal tibia. Whereas fragility fractures occur more often in women, about a third of osteoporosis-related fractures occur in men (28). Large population data show that the prevalence of vertebral fracture is similar in both sexes; men aged 50–64 years have higher rates of vertebral fracture than do women (22). Osteoporosis is often assumed to be a disease that predominately affects postmenopausal women, and is underappreciated in men (29). The U.S. Preventative Service Task Force 2018 recommendation statement concluded that there is insufficient data to guide osteoporosis screening in men (30). To bring light to the issue, the International Society for Clinical Densitometry recently reaffirmed that men derive their T-scores from the normative reference database for women (31). The implementation of opportunistic screening of CT may further raise recognition that men can also be at higher risk of fracture, especially vertebral fracture.
Implementation of a fully automated algorithm for CT-based opportunistic BMD screening is appealing. The customized tool we used can be used to automatically measure large patient populations. However, the difference in L1 Hounsfield unit values between the manual and automated methods was more pronounced among older adults with lower Hounsfield unit values compared with the use of intravenous contrast agent and sex differences. Our subanalysis directly compared the automated measurement with several manual ROI measurements (axial midline, axial off-midline, and sagittal) and showed that this difference was related to the specific axial level used. We noted a slightly denser band of more condensed trabecular bone parallel to the endplates at the midvertebral level in some patients on the sagittal view at CT. This phenomenon has been confirmed at anatomic observation, at which BMD has been shown to be substantially higher at the midvertebral level compared with both cranial and caudal trabecular regions (20). This difference is more pronounced in patients with lower BMD, which explains the greater age-related difference in older patients. Not surprisingly, the manual sagittal measurements were intermediate but closer to the standard off-midline axial measurement because only a small portion of the dense midline band was included. Currently we are using a slight modification in the automated algorithm, with a more superior (cranial) axial section above the midline. However, for the purposes of opportunistic screening, one could argue that adjustment may not be necessary unless a patient is relatively close to a critical threshold.
The kilovolt settings have a more profound effect on Hounsfield unit values of trabecular bone compared with soft tissue structures (32), which is why we limited our analysis to 120 kV. Further study is required to derive relevant thresholds at other kilovolt settings, but this should be fairly straightforward and could be phantom based. Some critics have cited scanner-to-scanner variability in measurement as a major obstacle (6,33). CT model– and manufacturer-dependent variability in Hounsfield unit measurements have been demonstrated in a study (34) that scanned a single European Spine Phantom by using 20 different commercial CT scanners. However, the differences were relatively small, and L1 showed the least variation compared with the L2 and L3 levels. Moreover, to our knowledge, there are no well-designed prospective studies that clearly demonstrate the cost-effective benefit of additional workup and treatment after patient identification (33). Nonetheless, the normative reference ranges outlined in our study can easily identify individuals who have Hounsfield unit measurements below the values of their age group.
Our study had limitations. The generalizability of our results may have been somewhat limited because of the retrospective single-center nature of our study. The number of CT images analyzed for each age group was unevenly distributed, as were the data for sex, intravenous contrast agent, and manual versus automated ROI. In addition, whereas DXA-derived T-scores take the patient’s ethnicity into account, to our knowledge, ethnic differences in trabecular attenuation values are yet to be investigated. Our subanalysis cohort to investigate differences between the manual and automated methods was small relative to the entire study cohort. Finally, we did not delve into additional clinical information, such as medications and comorbid conditions.
Our study provides normative values of L1 trabecular attenuation, which can serve as a quick reference for opportunistic osteoporosis screening at routine CT to identify at-risk individuals. It is our hope that this study will further encourage radiologists who interpret CT images to routinely assess for L1 trabecular attenuation (and compression fractures) by using the simple manual approach because undiagnosed low BMD and osteoporosis are typically encountered on a daily basis in routine practice. In the future, automated methods are likely to become widely available, which could provide for objective assessment at both the individual patient level, and for large patient cohorts or populations.
APPENDIX
SUPPLEMENTAL FIGURES
Acknowledgments
Acknowledgments
We thank Jiamin Liu, PhD, Jianhua Yao, PhD, and Nathan Lay, PhD, for their input on the automated bone mineral densitometry data and software development.
Study supported by the Intramural Research Program of the National Institutes of Health Clinical Center.
Disclosures of Conflicts of Interest: S.J. disclosed no relevant relationships. P.M.G. disclosed no relevant relationships. T.J.Z. Activities related to the present article: disclosed no relevant relationships. Activities not related to the present article: disclosed money paid to author for consultancy from Ethicon; disclosed money to author’s institution for grant from Ethicon; disclosed money paid to author for stock/stock options from Histosonics. Other relationships: disclosed no relevant relationships. S.J.L. disclosed no relevant relationships. R.M.S. Activities related to the present article: disclosed no relevant relationships. Activities not related to the present article: disclosed money paid to author’s institution for patent royalties and software licenses from iCAD, ScanMed, Philips, ImBio, Zebra Medical, and PingAn; disclosed money paid to author’s institution for research support from PingAn and Nvidia. Other relationships: disclosed no relevant relationships. P.J.P. Activities related to the present article: disclosed no relevant relationships. Activities not related to the present article: disclosed consultancy for Bracco; disclosed money to author for royalties from Elsevier; disclosed stock in Shine, Elucent, and Cellectar; and disclosed money paid to author by VirtuoCTC for educational purposes. Other relationships: disclosed no relevant relationships.
Abbreviations:
- BMD
- bone mineral density
- DXA
- dual-energy x-ray absorptiometry
- ROI
- region of interest
References
- 1.Burge R, Dawson-Hughes B, Solomon DH, Wong JB, King A, Tosteson A. Incidence and economic burden of osteoporosis-related fractures in the United States, 2005-2025. J Bone Miner Res 2007;22(3):465–475. [DOI] [PubMed] [Google Scholar]
- 2.Wright NC, Looker AC, Saag KG, et al. The recent prevalence of osteoporosis and low bone mass in the United States based on bone mineral density at the femoral neck or lumbar spine. J Bone Miner Res 2014;29(11):2520–2526. [DOI] [PMC free article] [PubMed] [Google Scholar]
- 3.Black DM, Rosen CJ. Postmenopausal osteoporosis. N Engl J Med 2016;374(21): 2096–2097. [DOI] [PubMed] [Google Scholar]
- 4.Khosla S, Shane E. A crisis in the treatment of osteoporosis. J Bone Miner Res 2016;31(8):1485–1487. [DOI] [PubMed] [Google Scholar]
- 5.Miller PD. Underdiagnosis and undertreatment of osteoporosis: the battle to be won. J Clin Endocrinol Metab 2016;101(3):852–859. [DOI] [PubMed] [Google Scholar]
- 6.Johannesdottir F, Allaire B, Bouxsein ML. Fracture prediction by computed tomography and finite element analysis: current and future perspectives. Curr Osteoporos Rep 2018;16(4):411–422. [DOI] [PubMed] [Google Scholar]
- 7.Lee SJ, Pickhardt PJ. Opportunistic screening for osteoporosis using body CT scans obtained for other indications: the UW experience. Clin Rev Bone Miner Metab 2017;15(3):128–137. [Google Scholar]
- 8.Pickhardt PJ, Pooler BD, Lauder T, del Rio AM, Bruce RJ, Binkley N. Opportunistic screening for osteoporosis using abdominal computed tomography scans obtained for other indications. Ann Intern Med 2013;158(8):588–595. [DOI] [PMC free article] [PubMed] [Google Scholar]
- 9.Carberry GA, Pooler BD, Binkley N, Lauder TB, Bruce RJ, Pickhardt PJ. Unreported vertebral body compression fractures at abdominal multidetector CT. Radiology 2013;268(1):120–126. [DOI] [PubMed] [Google Scholar]
- 10.Graffy PM, Lee SJ, Ziemlewicz TJ, Pickhardt PJ. Prevalence of vertebral compression fractures on routine CT scans according to L1 trabecular attenuation: determining relevant thresholds for opportunistic osteoporosis screening. AJR Am J Roentgenol 2017;209(3):491–496. [DOI] [PubMed] [Google Scholar]
- 11.Lee SJ, Graffy PM, Zea RD, Ziemlewicz TJ, Pickhardt PJ. Future Osteoporotic fracture risk related to lumbar vertebral trabecular attenuation measured at routine body CT. J Bone Miner Res 2018;33(5):860–867. [DOI] [PMC free article] [PubMed] [Google Scholar]
- 12.Gerety EL, Hopper MA, Bearcroft PW. The reliability of measuring the density of the L1 vertebral body on CT imaging as a predictor of bone mineral density. Clin Radiol 2017;72(2):177.e9–177.e15, e179–e177, e115. [DOI] [PubMed] [Google Scholar]
- 13.Pompe E, de Jong PA, de Jong WU, et al. Inter-observer and inter-examination variability of manual vertebral bone attenuation measurements on computed tomography. Eur Radiol 2016;26(9):3046–3053. [DOI] [PMC free article] [PubMed] [Google Scholar]
- 14.Pickhardt PJ, Lee LJ, del Rio AM, et al. Simultaneous screening for osteoporosis at CT colonography: bone mineral density assessment using MDCT attenuation techniques compared with the DXA reference standard. J Bone Miner Res 2011;26(9):2194–2203. [DOI] [PMC free article] [PubMed] [Google Scholar]
- 15.Summers RM, Baecher N, Yao J, et al. Feasibility of simultaneous computed tomographic colonography and fully automated bone mineral densitometry in a single examination. J Comput Assist Tomogr 2011;35(2):212–216. [DOI] [PMC free article] [PubMed] [Google Scholar]
- 16.Kanis JA, McCloskey EV, Johansson H, Oden A, Melton LJ, 3rd, Khaltaev N. A reference standard for the description of osteoporosis. Bone 2008;42(3):467–475. [DOI] [PubMed] [Google Scholar]
- 17.Looker AC, Wahner HW, Dunn WL, et al. Updated data on proximal femur bone mineral levels of US adults. Osteoporos Int 1998;8(5):468–489. [DOI] [PubMed] [Google Scholar]
- 18.Lee SJ, Binkley N, Lubner MG, Bruce RJ, Ziemlewicz TJ, Pickhardt PJ. Opportunistic screening for osteoporosis using the sagittal reconstruction from routine abdominal CT for combined assessment of vertebral fractures and density. Osteoporos Int 2016;27(3):1131–1136. [DOI] [PubMed] [Google Scholar]
- 19.Pickhardt PJ, Lee SJ, Liu J, et al. Population-based opportunistic osteoporosis screening: Validation of a fully automated CT tool for assessing longitudinal BMD changes. Br J Radiol 2019;92(1094):20180726. [DOI] [PMC free article] [PubMed] [Google Scholar]
- 20.Kennedy OD, Brennan O, Rackard SM, O’Brien FJ, Taylor D, Lee TC. Variation of trabecular microarchitectural parameters in cranial, caudal and mid-vertebral regions of the ovine L3 vertebra. J Anat 2009;214(5):729–735. [DOI] [PMC free article] [PubMed] [Google Scholar]
- 21.Ioannidis JPA. The proposal to lower P value thresholds to. 005. JAMA 2018; 319(14):1429–1430. [DOI] [PubMed] [Google Scholar]
- 22.Ballane G, Cauley JA, Luckey MM, El-Hajj Fuleihan G. Worldwide prevalence and incidence of osteoporotic vertebral fractures. Osteoporos Int 2017;28(5):1531–1542. [DOI] [PubMed] [Google Scholar]
- 23.Lee S, Chung CK, Oh SH, Park SB. Correlation between bone mineral density measured by dual-energy x-ray absorptiometry and hounsfield units measured by diagnostic CT in lumbar spine. J Korean Neurosurg Soc 2013;54(5):384–389. [DOI] [PMC free article] [PubMed] [Google Scholar]
- 24.Buckens CF, Dijkhuis G, de Keizer B, Verhaar HJ, de Jong PA. Opportunistic screening for osteoporosis on routine computed tomography? An external validation study. Eur Radiol 2015;25(7):2074–2079. [DOI] [PubMed] [Google Scholar]
- 25.Pompe E, Willemink MJ, Dijkhuis GR, Verhaar HJ, Mohamed Hoesein FA, de Jong PA. Intravenous contrast injection significantly affects bone mineral density measured on CT. Eur Radiol 2015;25(2):283–289. [DOI] [PubMed] [Google Scholar]
- 26.Pickhardt PJ, Lauder T, Pooler BD, et al. Effect of IV contrast on lumbar trabecular attenuation at routine abdominal CT: correlation with DXA and implications for opportunistic osteoporosis screening. Osteoporos Int 2016;27(1):147–152. [DOI] [PubMed] [Google Scholar]
- 27.Riggs BL, Melton LJ., Iii 3rd, Robb RA, et al. Population-based study of age and sex differences in bone volumetric density, size, geometry, and structure at different skeletal sites. J Bone Miner Res 2004;19(12):1945–1954. [DOI] [PubMed] [Google Scholar]
- 28.Watts NB, Adler RA, Bilezikian JP, et al. Osteoporosis in men: an Endocrine Society clinical practice guideline. J Clin Endocrinol Metab 2012;97(6):1802–1822. [DOI] [PubMed] [Google Scholar]
- 29.Binkley N, Adler R, Bilezikian JP. Osteoporosis diagnosis in men: the T-score controversy revisited. Curr Osteoporos Rep 2014;12(4):403–409. [DOI] [PMC free article] [PubMed] [Google Scholar]
- 30.US Preventive Services Task Force , Curry SJ, Krist AH, et al. Screening for osteoporosis to prevent fractures: US Preventive Services Task Force recommendation statement. JAMA 2018;319(24):2521–2531. [DOI] [PubMed] [Google Scholar]
- 31.Watts NB, Leslie WD, Foldes AJ, Miller PD. 2013 International Society for Clinical Densitometry position development conference: task force on normative databases. J Clin Densitom 2013;16(4):472–481. [DOI] [PubMed] [Google Scholar]
- 32.Garner HW, Paturzo MM, Gaudier G, Pickhardt PJ, Wessell DE. Variation in attenuation in L1 trabecular bone at different tube voltages: caution is warranted when screening for osteoporosis with the use of opportunistic CT. AJR Am J Roentgenol 2017;208(1):165–170. [DOI] [PubMed] [Google Scholar]
- 33.Gausden EB, Nwachukwu BU, Schreiber JJ, Lorich DG, Lane JM. Opportunistic use of CT imaging for osteoporosis screening and bone density assessment: a qualitative systematic review. J Bone Joint Surg Am 2017;99(18):1580–1590. [DOI] [PubMed] [Google Scholar]
- 34.Engelke K, Lang T, Khosla S, et al. Clinical use of quantitative computed tomography-based advanced techniques in the management of osteoporosis in adults: the 2015 ISCD official positions-part III. J Clin Densitom 2015;18(3):393–407. [DOI] [PubMed] [Google Scholar]
Associated Data
This section collects any data citations, data availability statements, or supplementary materials included in this article.