

Summary
Introduction
A basal level of mitophagy is essential in mitochondrial quality control in physiological conditions, while excessive mitophagy contributes to cell death in a number of diseases including ischemic stroke. Signals regulating this process remain unknown. BNIP3, a pro‐apoptotic BH3‐only protein, has been implicated as a regulator of mitophagy.
Aims
Both in vivo and in vitro models of stroke, as well as BNIP3 wild‐type and knock out mice were used in this study.
Results
We show that BNIP3 and its homologue BNIP3L (NIX) are highly expressed in a “delayed” manner and contribute to delayed neuronal loss following stroke. Deficiency in BNIP3 significantly decreases both neuronal mitophagy and apoptosis but increases nonselective autophagy following ischemic/hypoxic insults. The mitochondria‐localized BNIP3 interacts with the autophagosome‐localized LC3, suggesting that BNIP3, similar to NIX, functions as a LC3‐binding receptor on mitochondria. Although NIX expression is upregulated when BNIP3 is silenced, up‐regulation of NIX cannot functionally compensate for the loss of BNIP3 in activating excessive mitophagy.
Conclusions
NIX primarily regulates basal level of mitophagy in physiological conditions, whereas BNIP3 exclusively activates excessive mitophagy leading to cell death.
Keywords: BNIP3, LC3, Mitophagy, Neonatal stroke, NIX
Introduction
Mitophagy, the specific autophagic elimination of mitochondria, regulates mitochondrial number to match metabolic demand and functions as a core quality control mechanism necessary for the removal of impaired mitochondria 1. This selective degradation of malfunctioning mitochondria is of particular importance to neurons because of their constant demand for high levels of energy production. Emerging evidence indicates that impaired mitophagy plays an important role in CNS diseases 2, 3. Intriguingly, mitophagy, like autophagy, is not always protective, as increased mitophagy leads to rapid Purkinje cell death 4. Therefore, mitophagy can be regarded as a double‐edged sword: it plays a protective role when activated by mild physiological stressors and plays a lethal role when over‐activated by a severe pathological stress such as ischemia 5. Given the importance of precise regulation of mitochondrial turnover in the nervous system, how mitophagy is initiated and regulated represents an area of considerable interest.
BNIP3 is a member of a unique subfamily of death‐inducing mitochondrial proteins. Two family members sharing 56% sequence homology have been characterized to date: BNIP3 and BNIP3L (also known as NIX). It is known that BNIP3‐induced neuronal death is characterized by early mitochondrial damage 6. Our group has previously shown that BNIP3 is markedly upregulated in a distinctive “delayed” manner after cerebral ischemia 7. Although several studies have postulated a possible link between BNIP3 and mitophagy, none have precisely elucidated how BNIP3 mediates mitophagy 8, 9, 10. Interestingly, BNIP3L (NIX) directly interacts with LC3, an indicator protein localized on isolation membrane, and mediates the subsequent binding and sequestration of mitochondria into autophagosomes 1, 9, 11. Whether BNIP3 mediates a similar function has not yet been determined and forms the basis of the current study.
In this study, using BNIP3 knockout mice, we demonstrate BNIP3 gene silencing achieves significant neuroprotection and rescues neurons from ischemia/hypoxia (I/H)‐induced apoptosis and excessive mitophagy both in vivo and in vitro. Mechanistically, we show that BNIP3 interacts with LC3 to target damaged mitochondria to autophagosomes, initiating the process of excessive mitophagy in the delayed neuronal death of stroke. Thus, our data suggest a novel insight of BNIP3 in regulating neuronal mitophagy and cell death in neonatal stroke.
Materials and methods
Neonatal Ischemia/Hypoxia (I/H) Animal Model
All animal‐involved experiments were conducted according to the Canadian Federal Regulations and the Animal Care Guidelines of the University of Manitoba. BNIP3 wild‐type (B6; 129) and knockout (BNIP3−/−) mice were developed by Dr. Gerald W. Dorn II's laboratory at the Center for Pharmacogenomics, Department of Internal Medicine, Washington University School of Medicine (St. Louis, MO, USA), and bred and received from Dr. Spencer B. Gibson's laboratory at the Manitoba Institute of Cell Biology, University of Manitoba. Animals were obtained from Central Animal Care Services (CACS) of the University of Manitoba. The neonatal stroke model we used was adapted from Rice‐Vannucci 12, combining a unilateral common carotid artery ligation with a 30 min hypoxic treatment (in 8% O2) on postnatal day 7 mice pups, when the brain maturity is equivalent to that of an early third trimester human fetus 13, 14. This model reliably produced a well‐defined brain lesion 15. Control littermates were neither operated on nor subjected to hypoxia.
Infarct Volume Measurement
2,3,5‐triphenyltetrazolium chloride (TTC) staining (T8877; Sigma‐Aldrich, Oakville, ON, Canada) was performed to detect the infarct volume of ischemic brains. Briefly, the mice brains were dissected and cut into five equally spaced (2 mm) coronal sections. These sections were immersed in a 1% TTC solution for 15 min at 37°C in the dark. The ischemic infarct areas were indicated by a pale color, while the healthy brain tissues were stained in dark red 16, 17. A total hemispheric infarct volume was calculated at each time point by the equation CIV = (LT − [RT − RI])d, where CIV is the corrected total infarct volume, LT is the area of the left hemisphere, RT is the area of the right hemisphere, RI is the infarcted area, and d is the slice thickness (2 mm) 18, 19. Relative infarct volume was also calculated as a percentage of whole brain volume.
Cell Culture and Treatment
Primary cortical neurons were separated from embryonic 18 days (E18) rat brains or embryonic 16 days (E16) mice brains using our standardized protocol 7, and neuronal cultures were prepared as described previously 15. For OGD treatment, cells were washed twice and incubated with glucose‐free Earle's Balanced Salt Solution (EBSS, 14155‐063; Life Technologies, Burlington, ON, Canada) at pH 7.4 in a Forma Series II Water Jacketed CO2 Incubator (Thermo Scientific, Waltham, MA, USA) with an atmosphere of 94% N2, 5% CO2, and 1% O2 at 37°C for the designed length of time. OGD was terminated by replacing the glucose‐free EBSS with complete medium and incubating the cultures in normoxic conditions.
Transmission Electron Microscopy
Primary cortical neurons were digested by 0.25% Trypsin–EDTA (25200‐056; Life Technologies) for 15 min and collected and pelleted by centrifugation at 1200 g for 3 min. The pellets of neurons were then treated as tissue blocks, which were fixed by immersing in 2.5% glutaraldehyde (01909‐5; Polysciences Inc., Warrington, PA, USA) in 0.1 mol/L phosphate buffer (pH 7.2) with 8% sucrose, postfixed in 1% osmium tetroxide (19152; Electron Microscopy Sciences, Sunnyvale, CA, USA) in 0.1 mol/L phosphate buffer (pH 7.4), dehydrated in graded ethanol series, and flat embedded in Araldite (02595‐1; Polysciences Inc.). Ultrathin sections (40–60 nm thick) were placed on grids (200 mesh) and double stained with uranyl acetate (22400; Electron Microscopy Sciences) and lead citrate (SPI‐Chem™, 02616‐AB; SPI Supplies and Structure Probe, Inc., Toronto, ON, Canada). The grids containing the sections were observed under a Philips 201 (Philips Electron Optics, B.V. Eindhoven, the Netherlands) electron microscope.
Quantification of Neuronal Death
Lactate dehydrogenase (LDH) leakage was measured after 6 h of OGD followed by RP at 0, 24, 48, or 72 h. In brief, after OGD treatment, the supernatant of the cell culture was collected. Neurons were lysed with lysis buffer at 37°C for 30 min. Then, samples of supernatants and cell lysates were separately prepared following the manufacturer's instructions for the LDH‐Cytotoxicity Assay Kit II (K313‐500; BioVision, Inc. Milpitas, CA, USA). The absorbance value at 450 nm was determined on a Wallac VICTOR3 microplate reader (Perkin Elmer Life Sciences, Waltham, MA, USA). Cell death rate was calculated according to the manufacturer's instructions.
Detection of Co‐localization
BNIP3 WT and KO cortical neurons were seeded on cover slips and placed in 24‐well plates. The LC3II‐GFP transgenes were transfected into neurons using the Premo™ Autophagy Sensors (LC3II‐GFP) *BacMam 2.0* System (P36235; Invitrogen Corporation, Camarillo, CA, USA) according to the manufacturer's instructions. Cells were left undisturbed for at least 24 h following transfection, before treatments were administered 20. The LC3II and MitoTracker Red double labeling was performed to detect the co‐localization of autophagosomes with mitochondria in neurons, while the LC3II and LysoTracker Red double labeling was performed to detect the co‐localization of autophagosomes with lysosomes in neurons. Briefly, pretransfected neurons showing an over‐expression of LC3II protein were proceeded to the OGD/RP treatment on day 7. Upon each time point, neurons were firstly incubated in 50 nM MitoTracker Red (M‐7512; Invitrogen) solution for 15 min or incubated in 50 nM LysoTracker Red (MP‐07525; Invitrogen) solution for 1 h at 37°C in the dark. Then, cells were fixed in 4% paraformaldehyde on ice for 15 min and washed with three rinses of PBS. Nuclei were stained by Hoechst 33342 (14533; Sigma). The cover slips were mounted on glass slides, and cells were observed by a Carl Zeiss AxioImager. Z1 (Carl Zeiss, Gottingen, Germany) fitted with a motorized Z‐stage and an apotome for optical sectioning. For high‐resolution microscopy, Z‐stacks were acquired at 63× magnification with 0.6 μm increments in ApoTome mode using a high‐resolution AxioCam MRm digital camera, a 63× Plan‐Apochromat (oil immersion) objective and Zeiss AxioVision 4.8 software (Carl Zeiss). Quantification of co‐localization was performed as previously described with modification 21. Percentage of mitochondria/lysosomes co‐localized with autophagosomes (yellow dots) to the total number of mitochondria/lysosomes (red dots) were detected. For each time point, there were at least four parallel wells, and for each well, at least three pictures under different visual fields were taken.
Western Blotting
Total cell lysates were separated from neuronal cultures after OGD/RP. Protein concentrations were determined by a reducing agent‐compatible BCA assay kit (23225, Pierce Biotechnology, Inc., Nepean, ON, Canada). Protein samples were separated on 12% polyacrylamide gels and transferred to Amersham™ Hybond™ Blotting Membranes (RPN303F; GE Healthcare). The primary antibodies included: mouse monoclonal anti‐BNIP3 (1:1000; provided by Dr. A. Greenberg) 22, mouse monoclonal anti‐NIX (H‐8) (1:1000, sc‐166332; Santa Cruz Biotechnology, Santa Cruz, CA, USA), rabbit polyclonal anti‐APG8 (LC3) (1:1000; Abgent, 60941‐266), goat polyclonal anti‐BECN1 (1:1000; Santa Cruz Biotechnology, sc‐10086), rat monoclonal [GL2A7] anti‐LAMP‐2 (1:1000; Abcam, ab13524, Cambridge, MA, USA), rabbit polyclonal anti‐caspase 3 (1:1000; Santa Cruz Biotechnology, sc‐7148), rabbit polyclonal anti‐BAX (1:1000; Santa Cruz Biotechnology, sc‐526), mouse monoclonal [7H8.2C12] anti‐cytochrome c (1:1000; Abcam, ab13575), mouse monoclonal anti‐BCL‐2 (1:1000; Santa Cruz Biotechnology, sc‐7382), mouse monoclonal anti‐Cox IV (1:1000; Abcam, ab33985), mouse monoclonal anti‐TOMM22 (1:1000; Abcam, ab57523), and mouse monoclonal anti‐β‐actin (1:2000; Santa Cruz Biotechnology, sc‐69879). The secondary antibodies were horseradish peroxidise‐conjugated sheep anti‐mouse (1:5000; GE Healthcare, RPN 4201), donkey anti‐rabbit IgG (1:5000; Thermo scientific, 31458), donkey anti‐goat IgG (1:5000; Santa Cruz Biotechnology, sc‐2020), and goat anti‐rat IgG (1:5000, A24558; Life Technologies). Immunoblotting was detected by Enhanced Chemiluminescence (PerkinElmer, NEL104001EA, Waltham, MA, USA) and imaged on a FluorChem 8900 imager (Alpha Innotech, San Leandro, CA, USA). Western blot band densities were quantified using the Bio‐Rad Laboratories (Hercules, CA, USA) Quantity One software.
Co‐immunoprecipitation Assay
For co‐IP, neuronal cells (6 × 10⁶/group) were digested in RIPA lysis buffer (R0278; Sigma‐Aldrich) including 1% Halt* Protease and Phosphatase Inhibitor Cocktail (Thermo Scientific, 78442), and the total cell lysates were processed with Pierce® Co‐Immunoprecipitation (co‐IP) Kit (Thermo Scientific, 26149) according to the manufacturer's instructions. The lysates were immunoprecipitated with 10 mg anti‐BNIP3 antibody, 10 mg anti‐LC3 antibody, and 10 mg anti‐NIX antibody, respectively, at 4°C for 48 h. Protein‐coupled resins were washed six times with lysis buffer to reduce contaminants, and prepared for Western blot analysis by adding Laemmli sample buffer with 2% β‐mercaptoethanol (Bio‐Rad, 161‐0747) to the eluted pellet and heating at 100°C for 5 min.
Enzyme‐linked Immunosorbent Assay (ELISA) of LC3II
Cortical neurons or brain tissues were homogenized in RIPA lysis buffer and centrifuged at 5000 × g at 4°C for 15 min. LC3II levels were measured in the supernatants. The total lysates were firstly processed with Pierce® Co‐Immunoprecipitation Kit (Thermo Scientific, 26149). The eluted pellets from co‐IP were then measured by the rat microtubule‐associated proteins 1A/1B light chain 3B (MAP1LC3B) ELISA kit (CUSABIO, CSB‐EL013403RA, Wuhan, China). Each sample was assayed in duplicate at appropriate dilutions so that relative luminescent units fell within the linear range of standard curves 23. Plates were read at 450 nm on a BioTek PowerWave XS Microplate Spectrophotometer (BioTek Instruments Inc., Winooski, VT, USA). The interactive activities of LC3II with NIX or BNIP3 were quantified as percentage of pulled down LC3II to the total amount of LC3II.
Statistical Analysis
Statistical differences were determined using one‐way ANOVA analyses and Bonferroni or Dunnett's posttests. Comparisons between BNIP3 WT and KO groups were made using two‐way ANOVA analyses and Bonferroni posttests. GraphPad Prism 5 software (GraphPad Software, Inc. La Jolla, CA, USA) was used for all the statistical analysis. A difference was considered significant at *P < 0.05, **P < 0.01, and ***P < 0.001.
Results
BNIP3 Gene Silencing was Neuroprotective in Neonatal Brain I/H
We first discovered that the expression of both the cytosolic monomer (30 kDa) and the mitochondria‐localized homodimer (60 kDa) of BNIP3 significantly increased in a time‐dependent fashion after brain I/H (Figure S1). To investigate whether BNIP3 is involved in ischemic stroke, using BNIP3 WT and KO pups subjected to ischemic stroke (Figure 1A), we found that the total infarct volumes increased significantly in WT brains, whereas decreased dramatically in KO brains after recovery for up to 28 days (Figure 1B). Meanwhile, BNIP3 WT and KO cortical neurons were treated by OGD/RP injuries. The death rates increased significantly in WT neurons, whereas decreased dramatically in KO neurons after RP for up to 72 h (Figure 1C). Taken together, results from both in vivo and in vitro stroke models demonstrated that BNIP3 gene silencing was neuroprotective in brain I/H.
Figure 1.
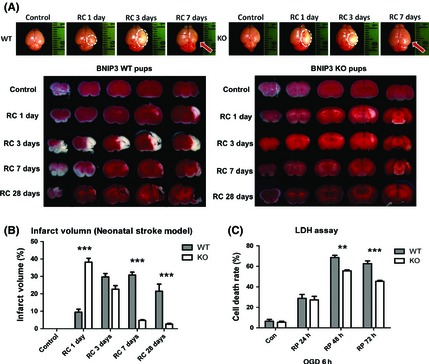
BNIP3 gene silencing was neuroprotective in stroke models. Measurement of brain infarct volume in BNIP3 WT and KO mice pups in neonatal stroke model. Two‐way ANOVA analysis and Bonferroni posttests were used to compare the total brain infarct volumes between the WT and KO groups: WT versus KO on each time point, ***P < 0.001. Control groups were sham‐operated and were not subjected to I/H treatment. N = 3–6 for each group (A, B). Time course of cell death rate in OGD/RP‐challenged BNIP3 WT and KO neurons, quantified by LDH assay. Two‐way ANOVA analysis and Bonferroni posttests were used to compare the cell death rates between WT and KO groups: WT versus KO on each time point, **P < 0.01, and ***P < 0.001. Control group were without I/H. N = 3 for each group (C).
BNIP3 Expression Increased Mitophagy in Brain I/H
Cortical neurons were treated with OGD/RP. Co‐localization of mitochondria with autophagosomes was detected to represent the mitophagy intensity. After OGD, the punctuate staining of autophagosome‐localized LC3‐II was distinct from the even distribution of LC3‐I in control groups. A reduced co‐localization (yellow) of mitochondria (red) with autophagosomes (green) was detected in the BNIP3 KO neurons, while the WT neurons showed a significantly higher co‐localization rate especially after 72 h RP (Figure 2A–C). To quantify the elimination of damaged mitochondria in both neurons, markers for mitochondrial outer (TOMM22) and inner membranes (COXIV) were examined by Western blot. TOMM22 is an integral membrane protein of the mitochondrial outer membrane 24, 25; COXIV is a large transmembrane protein complex that localizes to the mitochondrial inner membrane 26. Both of these proteins are used extensively as specific mitochondrial markers 27, 28, 29, 30. We found that the basal expression levels of TOMM22 and COXIV were comparable in WT and KO tissues. As the expression levels of these markers are precisely correlated to mitochondrial content 31, 32, 33, this suggest that the amount of mitochondria is not affected by loss of the BNIP3 gene. However, TOMM22 and COXIV expression levels decreased after prolonged I/H in WT neurons, implying an increased mitophagy response. Meanwhile, both marker proteins were well preserved in KO neurons at each time point post injury, showing lower mitophagy activity when BNIP3 was silenced (Figure 2D,E). In addition, an induced mitophagy (Figure 2F), together with an increased autophagic cell death (Figure S2) in OGD/RP‐challenged WT neurons were confirmed ultrastructurally using electron microscopy. These data showed that BNIP3 expression increased mitophagy, while knocking out BNIP3 inhibited mitochondrial elimination in brain I/H.
Figure 2.
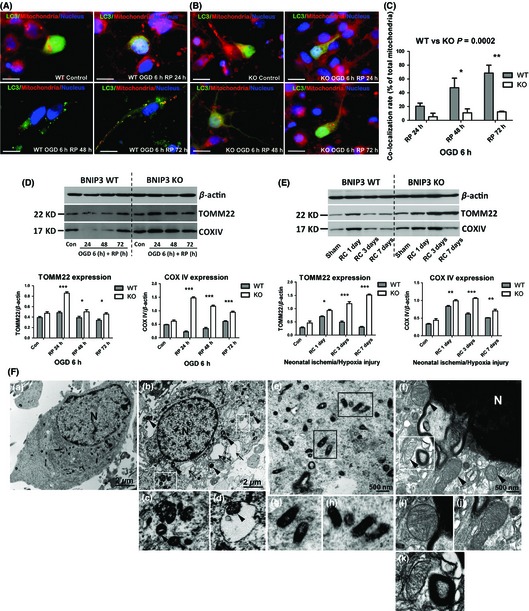
BNIP3 expression increased mitophagy in stroke models. Immunocytochemistry was used to detect mitophagy intensity in WT/KO neurons, as shown by co‐localization of mitochondria with autophagosomes. Mitochondria were stained with red, LC3 and nuclei were marked with green and blue, respectively. Scale bars = 30 μm. Images were taken at 63× objective (A, B). Co‐localization rates of mitochondria with autophagosomes in OGD/RP‐treated neurons were calculated. Two‐way ANOVA analysis and Bonferroni posttests were used to compare the WT and KO groups: WT versus KO on each time point, *P < 0.05, **P < 0.01, and ***P < 0.001. N = 3 for each group (C). Western blot was used to determine the expression levels of mitochondrial marker proteins in vitro (D) and in vivo (E). β‐Actin (43 kDa) was included as internal control. Band densities were measured by Quantity One software. Two‐way ANOVA analysis and Bonferroni posttests were used to compare the WT and KO groups: WT versus KO on each time point, *P < 0.05, **P < 0.01, and ***P < 0.001. Control groups were without I/H injury. N = 3 for each group. Group of electron micrographs (a–k) showed the occurrence of mitophagy in neurons after OGD/RP injury (F). White boxes highlight autophagosomes, black arrows indicate autophagic vacuoles, and black arrowheads indicate swelled and dilated mitochondria. Abundant double‐membrane autophagosomes formed in neurons after OGD 6 h plus RP 72 h treatment (b–d, f and k, as indicated by white boxes). Healthy and functional mitochondria were stained darkened with normal sizes in control neurons (a, e, g, and h, as indicated by black boxes). Lysosome was activated and fused with autophagosome (f and k, as indicated inside the white box). N = nucleus; (c) and (d) showed the enlarged autophagosomes in (b); (g) and (h) showed the enlarged mitochondria with normal appearances in (e); (i) and (j) showed the enlarged mitochondria with swelling and dilation appearances in (f); (k) showed an enlarged autolysosome that encompassed an inside mitochondrion in (f), demonstrating the ongoing process of mitophagy. Scale bars = 2 μm in (a, b), Scale bars = 500 nm in (e–f). N = 3 for each group.
BNIP3 Expressed in a “Delayed” Manner and Regulated Excessive Mitophagy in Brain I/H
Western blot was used to demonstrate the time courses of BNIP3 and NIX expression in vitro (Figure 3A) and in vivo (Figure 3B). BNIP3 was confirmed to express in a “delayed” manner in both stroke models (Figures 3A,B and S1A–C). NIX (BNIP3L) was also activated and expressed in a similar pattern as BNIP3. In particular, NIX expression levels were significantly higher in KO tissues compared with WT tissues at each time point after I/H, implying a compensation for the loss of the BNIP3 gene (Figure 3A,B). However, mitophagy levels remained unchanged at each time point after I/H in KO tissues, which was not affected by the dramatic up‐regulation of NIX when BNIP3 was silenced (Figure 2D,E). This data implicated that the major function of NIX is maintaining a physiological level of mitophagy, whereas BNIP3 triggers the excessive mitophagy in brain I/H.
Figure 3.
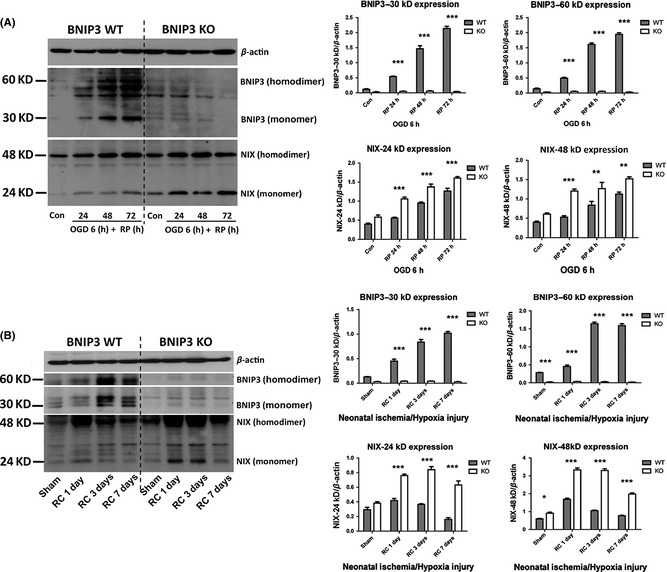
Expression patterns of BNIP3 and NIX in stroke models. Primary cortical neurons were treated with OGD for 6 h followed by different times of reperfusion (24, 48, and 72 h). BNIP3 WT and KO mice pups were subjected to neonatal stroke modeling followed by recovery for 1, 3, or 7 days. Western blot was used to demonstrate the time course of BNIP3 and NIX expression in vitro (A) and in vivo (B). Band densities were measured by Quantity One software. Two‐way ANOVA analysis and Bonferroni posttests were used to compare the WT and KO groups: WT versus KO on each time point, *P < 0.05, **P < 0.01, and ***P < 0.001. Controls were sham‐operated groups without I/H injury. N = 3 for each group.
Mitochondria‐localized BNIP3 Interacted with LC3 in the Neuronal Mitophagy of Stroke Models
We reasoned that BNIP3 expression is increased as a result of I/H injury leading to increased mitochondrial localization of the dimeric form. Moreover, we proposed that BNIP3 homodimers function as a binding partner for LC3 and in this way regulate mitophagy by targeting impaired mitochondria to autophagosomes. To examine this, we performed co‐IP combined with ELISA assays to detect protein–protein interactions. Primary rat cortical neurons were treated with OGD/RP. BNIP3 WT mice pups were subjected to the neonatal stroke. Control group verified the specificity and efficiency of each antibody used (Figure 4A). Interactions between NIX and LC3 were confirmed in both in vivo and in vitro stroke models, serving as positive controls (Figure 4B). We detected clear bands of LC3‐I/II using BNIP3 as the bait protein to pull down LC3, with the autophagosome‐localized LC3‐II as the primary interacting target for BNIP3; on the other hand, only the single band of mitochondria‐localized BNIP3 homodimer (60 kDa) was detected using LC3 as the bait protein to pull down BNIP3, suggesting that LC3 interacted specifically with dimeric BNIP3. A protein–protein interaction between BNIP3 and LC3 was confirmed in both models of stroke (Figure 4C). Furthermore, the interactive intensities between NIX and LC3‐II, and BNIP3 and LC3‐II were quantified at each time point. The percentage of LC3‐II pulled down by NIX or BNIP3 to the total amount of LC3‐II was calculated as an indicator of interactive intensity (Figure 4D–G). In OGD/RP‐challenged rat cortical neurons, significantly enhanced interactions between NIX and LC3‐II, and BNIP3 and LC3‐II were observed in a time‐dependent fashion, reaching maximum interaction at around RP 72 h (Figure 4D,E). In I/H‐challenged neonatal cortex, significantly increased interaction between BNIP3 and LC3‐II was also detected, especially after 1 day's recovery (Figure 4G). These enhanced interactions of mitochondria‐localized BNIP3 with autophagosome‐localized LC3 may subsequently contribute to the induction of excessive mitophagy.
Figure 4.
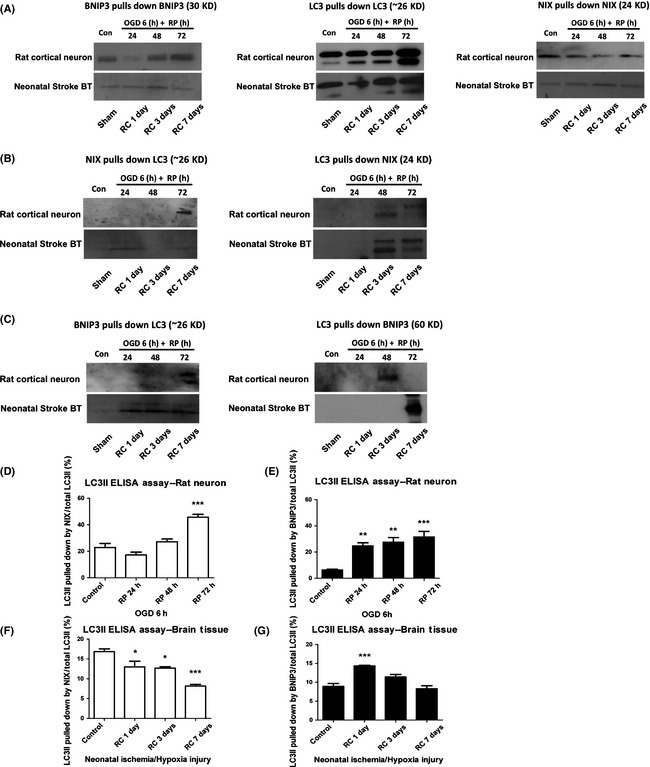
Mitochondria‐localized BNIP3 interacted with LC3 in the neuronal mitophagy in stroke models. Protein–protein interactions between NIX and LC3, and BNIP3 and LC3 were confirmed by co‐IP in in vivo and in vitro stroke models, respectively (A–C). Control groups verified the specificity and efficiency of each primary antibodies used in the co‐immunoprecipitation assays (A). Positive control group confirmed the interaction between NIX and LC3 in stroke models (B). Experimental group confirmed the interaction between BNIP3 (60 kDa homodimer form) and LC3 in stroke models (C). Using co‐IP followed by ELISA assays, the interactive activities between NIX and LC3, and BNIP3 and LC3 were further quantified at each time point (D–G). One‐way ANOVA analysis and Dunnett's posttests were used for the statistical analysis. *P < 0.05, **P < 0.01, and ***P < 0.001 versus control group. Control and sham‐operated groups were without I/H. N = 3 for each group.
BNIP3 Gene Silencing Decreased Apoptosis and Increased General Autophagy in OGD/RP‐treated Neurons
After OGD/RP, BNIP3 WT neurons demonstrated significantly increased apoptosis, as shown by higher levels of various pro‐apoptotic proteins (i.e., caspase 3, BAX, and cytochrome c) as compared with control. However, BNIP3 KO neurons displayed an opposite trend with significantly decreased expression of the same apoptotic proteins. Autophagy markers (LC3‐II/I ratio, Beclin1, and LAMP‐2) were quantified by Western blot. LC3 (mammalian ATG8) is required for autophagosome formation via its conversion from LC3‐I to LC3‐II 34. When cytoplasmic LC3‐I is converted to autophagosome‐localized LC3‐II, its molecular weight changes from 18 to 16 kDa 34, 35, 36. Thus, an increase in the amount of the smaller LC3‐II protein and an increase in the LC3‐II/I ratio are hallmarks of elevated autophagy 34. Beclin 1 is previously found to promote autophagy 34, 37, 38. A dramatic elevation in Beclin 1 levels has been found in the penumbra of rats challenged by cerebral ischemia 39. In addition, as the fusion of an autophagosome with a lysosome is the central mechanism for autophagy, the lysosome‐associated membrane protein 2 (LAMP‐2) expression is also a suitable marker for autophagy intensity 40, 41. We showed that Beclin 1 and LAMP‐2 expressions, as well as LC3‐II/I ratios in WT and KO neurons were up‐regulated after OGD/RP. Specifically, KO neurons showed significantly higher levels of Beclin 1 and LAMP‐2 expression, and LC3‐II/I ratios as compared with WT neurons at each time point (Figure 5B).
Figure 5.
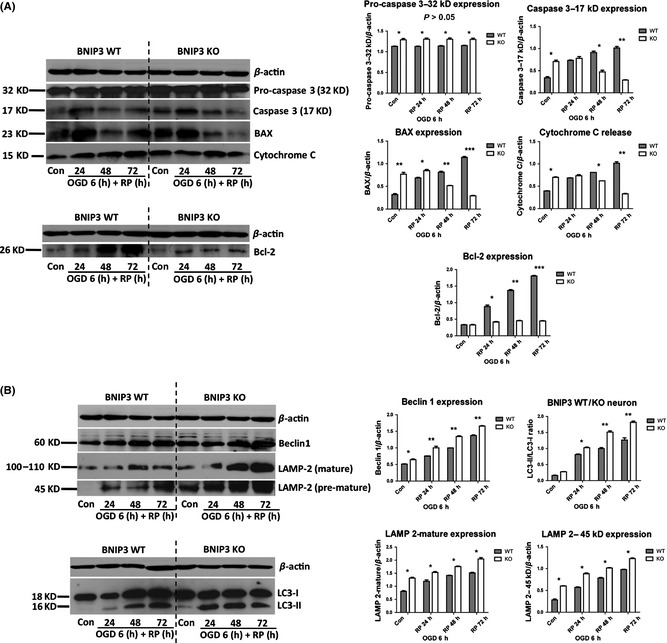
BNIP3 gene silencing decreased apoptosis and increased general autophagy in cortical neurons after OGD/RP injury. Decreased apoptosis was quantified by the decreased expression of pro‐apoptotic proteins (caspase 3, BAX and cytochrome c) and anti‐apoptotic protein (Bcl‐2) in the BNIP3 KO neuron (A). Increased general autophagy was quantified by the increased expression of autophagy marker proteins (Beclin1, LAMP‐2, and LC3‐II/I ratio) in the BNIP3 KO neuron (B). β‐Actin (43 kDa) was included as internal control. Band densities were measured by Quantity One software. Two‐way ANOVA analysis and Bonferroni posttests were used to compare the WT and KO groups: WT versus KO on each time point, *P < 0.05, **P < 0.01, and ***P < 0.001. N = 3 for each group.
We also found levels of LC3 punctuate staining increased dramatically in both neurons, indicating an intense activation of autophagy after OGD/RP (Figure 6A,B). Specifically, a much higher autophagy intensity was detected in KO neurons, as indicated by the substantially increased punctuate staining of LC3‐II in the cytoplasm when compared with WT neurons (Figure 6B). General autophagy intensity was further quantified by measuring MDC fluorescence 15, 42, 43, 44. A significant increase in the normalized MDC fluorescence was found after OGD/RP in KO neurons, suggesting a promoted general autophagy in KO neurons (Figure 6C). As late‐stage autophagy is characterized by fusion of autophagosomes with lysosomes, double labeling of autophagosome and lysosome was performed (Figure 6D,E). The percentage of co‐localized lysosomes with autophagosomes increased dramatically in the KO neurons than in WT neurons, especially after prolonged RP for 48 or 72 h, implicating that BNIP3 gene silencing increased general autophagy after OGD/RP injury.
Figure 6.
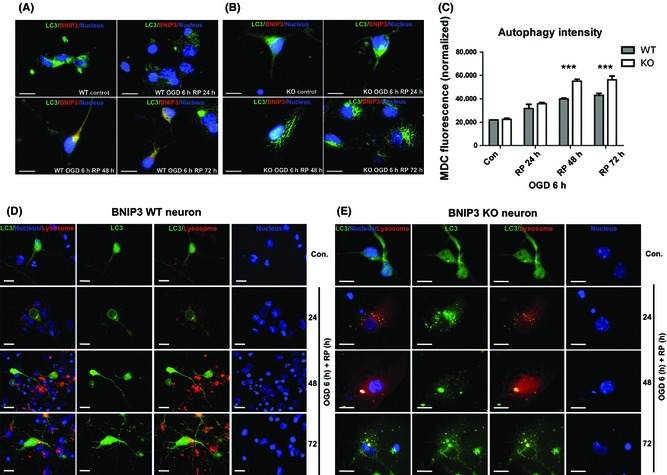
BNIP3 gene silencing increased general autophagy in OGD/RP‐challenged neurons. Immunocytochemistry was used to demonstrate the expression of BNIP3 and processing and translocation (punctuate staining) of LC3 protein. BNIP3 was stained with red, and LC3 and nuclei were marked with green and blue, respectively. Scale bars = 30 μm. Images were taken at 63× objective (A, B). MDC fluorescence was measured to quantify the general autophagy intensities in BNIP3 WT and KO neurons. Two‐way ANOVA analysis and Bonferroni posttests were used to compare the WT and KO groups: WT versus KO on each time point, ***P < 0.001. N = 3 for each group (C). Co‐localization of lysosomes with autophagosomes inside BNIP3 WT and KO neurons was detected. Lysosomes were stained with red, and LC3 and nuclei were marked with green and blue, respectively. Scale bars = 30 μm. Images were taken at 63× objective (D, E). Control groups without OGD/RP.
Discussion
In the present study, we have revealed a novel protective effect of knocking out BNIP3 in the response of cortical neurons to neonatal stroke. As mitochondria membrane markers were strongly preserved in BNIP3 KO mice after I/H injury, this beneficial effect is possibly through inhibition of mitophagy by decreasing BNIP3 interaction with LC3. Concurrently, autophagic markers such as Beclin 1, LAMP2, LC3II/I ratio were upregulated in BNIP3 KO neurons after I/H, which suggests enhanced activation of general autophagy. In contrast, the autophagy activation is associated with a decreased apoptosis in KO cortical neurons.
Several studies have reported that the BNIP3 gene family might play important roles in mediating mitophagy and mitochondrial quality control 8, 9, 10. The BNIP3 gene family is a unique subfamily of the BH3‐only members of the Bcl‐2 family, which includes BNIP3, NIX (BNIP3‐like protein X, also called BNIP3L), BNIP3 h, and a Caenorhabditis elegans ortholog, ceBNIP3 45. NIX shares a high amino acid homology (~56%) with BNIP3, and both are able to homodimerize and localize to mitochondria through their transmembrane (ΔTM) domains 46. To date, multiple lines of evidence supports the essential role of NIX in developmental removal of mitochondria during erythrocyte maturation 47, 48, but other functions of NIX‐mediated mitophagy are still unknown. In addition, recent evidence also shows that both NIX and BNIP3 can trigger mitochondrial depolarization, which is sufficient to initiate mitophagy 49, 50. Our data showed that total mitochondrial proteins decreased dramatically with the activation of BNIP3, but were well preserved when BNIP3 was completely silenced after both in vivo and in vitro stroke modeling (Figure 2D,E), implying that BNIP3 gene silencing decreased mitochondrial elimination, or in other words, BNIP3 expression increased mitochondrial degradation by mitophagy in brain I/H. In addition, we found mostly a proximate localization but not co‐localization of mitochondria with autophagosomes inside the KO neurons, suggesting a potential receptor‐mediated fusion of these two organelles inside the WT neurons. (Figure 2A–C).
Possible mechanisms have been proposed to explain how NIX regulates mitophagy 8, 9, 10. These include NIX directly interacting with LC3 on isolation membranes through its WXXL‐like motif, mediating the binding and sequestration of mitochondria into autophagosomes 1, 11, 51. Besides the higher structural similarity between NIX and BNIP3, our data have confirmed that BNIP3 is also functionally similar to NIX, as BNIP3 was activated in I/H‐challenged cortical neurons and neonatal brain tissues with an incremental pattern similar to that of NIX (Figure 3A,B). Particularly, NIX was further upregulated and expressed at a higher level in BNIP3 KO tissues at each time point postischemia, indicating an evident compensation for the loss of BNIP3. On the other hand, although NIX expression is elevated due to the loss of BNIP3, it cannot fully compensate for the loss of BNIP3's functions. When BNIP3 was silenced, mitophagy levels remained stable at each time point after I/H and were not affected by the dramatic up‐regulation of NIX in KO tissues (Figure 2D,E), implicating a functional discrepancy of these two homologues on mitophagy. Thus, we infer that NIX has a major function in maintaining a physiological level of mitophagy, whereas BNIP3 exclusively regulates the excessive mitophagy in brain I/H.
In light of the close resemblance between BNIP3 and NIX, a similar mechanism was found in which BNIP3 regulates the excessive mitophagy through binding to LC3. Using co‐IP assays, we found that LC3 interacted specifically to the 60 kDa mitochondria‐localized BNIP3, (Figure 4C) and the interaction intensity between LC3‐II and BNIP3 was proven to increase after I/H (Figure 4D–G). This enhanced interaction between mitochondria‐localized BNIP3 with autophagosome‐localized LC3 may subsequently contribute to the induction of excessive mitophagy leading to cell death (Figure S3 and S4B).
Nevertheless, another interesting finding of the present study is the significantly enhanced activation of general autophagy in cortical neurons of BNIP3 KO mice after OGD (Figures 5B, 6A–E and S4A). The role of autophagy in regulating cell death in response to stroke remains equivocal. During the early stage of stroke, autophagy was considered to alleviate the acute shortage of energy and oxygen supply 52. In accordance with that, various autophagic markers used to determine the level of general autophagy were significantly upregulated in both BNIP3 WT and KO neurons, but expressed higher in KO neurons at each time point (Figure 5B). Mitophagy is an organelle‐specific autophagic process, which constitutes a portion of total, general autophagy. Therefore, the distinct responses to stroke in mitophagy and general autophagy after silencing BNIP3 may reflect different underlying mechanisms: BNIP3‐dependent mitophagy and BNIP3‐independent general autophagy.
On the other hand, BNIP3 contributes to the downstream release of pro‐apoptotic effectors and promotes the apoptotic response 53, 54. It has been reported that overexpression of BNIP3 induced mitochondrial dysfunction and cytochrome c release in wild‐type MEFs (mouse embryonic fibroblasts). In contrast, down‐regulation of BNIP3 using RNA interference decreased activation of Bax during ischemia/reperfusion injury in myocytes 53. Our data confirmed that BNIP3 gene silencing reduced delayed neuronal death in OGD/RP‐challenged neurons (Figure 1C), which was characterized by down‐regulation of various pro‐apoptotic proteins in the BNIP3 KO neurons (Figure 5A). However, it is unclear why BNIP3 silencing‐induced inhibition of apoptosis was also associated with activated general autophagy, and what the consequences imply for stroke. As the overall infarct size in the BNIP3 KO mice was significantly decreased as compared with the WT mice (Figure 1), it is reasonable to assume that the protective effect of knocking out BNIP3 in neurons is likely attributable to its inhibition of BNIP3‐dependent mitophagy and apoptosis.
In conclusion, we have demonstrated a novel and crucial role of BNIP3 in regulating the excessive mitophagy and cell death in neonatal stroke, which provides important context and targets for overall outcomes in ischemic cerebral infarct. Further studies are needed for molecular dissection of the mitophagy pathways during the delayed progression of ischemic brain damage. Detailed characterization of BNIP3's function in mitophagy would also provide clues to the emerging questions related to mitophagy.
Conflict of Interest
The authors declare no conflict of interest.
Supporting information
Figure S1. Expression pattern of BNIP3 in stroke models.
Figure S2. OGD/RP injury‐induced autophagy and autophagic cell death in rat cortical neurons.
Figure S3. BNIP3 regulates the mitophagy pathway in OGD/RP stroke model.
Figure S4. BNIP3 regulates excessive mitophagy by interacting with LC3.
Data S1. Treatment of Autophagy Inhibitor 3‐Methyladenine (3‐MA).
Acknowledgments
We would like to thank Dr. Michael F. Jackson at the Department of Pharmacology and Therapeutics of the University of Manitoba for reading the manuscript and providing his insightful comments on it. This work was supported by grants from Canadian Institutes of Health Research, Canadian Stroke Network, and Manitoba Health Research Council to JK. RS is a recipient of graduate studentships from the Manitoba Health Research Council and Manitoba Institute of Child Health.
References
- 1. Youle RJ, Narendra DP. Mechanisms of mitophagy. Nat Rev Mol Cell Biol 2011;12:9–14. [DOI] [PMC free article] [PubMed] [Google Scholar]
- 2. Chu CT, Bayir H, Kagan VE. LC3 binds externalized cardiolipin on injured mitochondria to signal mitophagy in neurons: Implications for Parkinson disease. Autophagy, 2014;10:376–378. [DOI] [PMC free article] [PubMed] [Google Scholar]
- 3. Batlevi Y, La Spada AR. Mitochondrial autophagy in neural function, neurodegenerative disease, neuron cell death, and aging. Neurobiol Dis 2011;43:46–51. [DOI] [PMC free article] [PubMed] [Google Scholar]
- 4. Chakrabarti L, Eng J, Ivanov N, Garden GA, La Spada AR. Autophagy activation and enhanced mitophagy characterize the Purkinje cells of pcd mice prior to neuronal death. Mol Brain 2009;2:24. [DOI] [PMC free article] [PubMed] [Google Scholar]
- 5. Wong E, Cuervo AM. Autophagy gone awry in neurodegenerative diseases. Nat Neurosci 2010;13:805–811. [DOI] [PMC free article] [PubMed] [Google Scholar]
- 6. Vande Velde C, Cizeau J, Dubik D, et al. BNIP3 and genetic control of necrosis‐like cell death through the mitochondrial permeability transition pore. Mol Cell Biol, 2000;20:5454–5468. [DOI] [PMC free article] [PubMed] [Google Scholar]
- 7. Zhang Z, Yang X, Zhang S, Ma X, Kong J. BNIP3 upregulation and EndoG translocation in delayed neuronal death in stroke and in hypoxia. Stroke 2007;38:1606–1613. [DOI] [PubMed] [Google Scholar]
- 8. Green DR, Galluzzi L, Kroemer G. Mitochondria and the autophagy‐inflammation‐cell death axis in organismal aging. Science 2011;333:1109–1112. [DOI] [PMC free article] [PubMed] [Google Scholar]
- 9. Zhang J, Ney PA. Role of BNIP3 and NIX in cell death, autophagy, and mitophagy. Cell Death Differ 2009;16:939–946. [DOI] [PMC free article] [PubMed] [Google Scholar]
- 10. Ashrafi G, Schwarz TL. The pathways of mitophagy for quality control and clearance of mitochondria. Cell Death Differ 2013;20:31–42. [DOI] [PMC free article] [PubMed] [Google Scholar]
- 11. Schweers RL, Zhang J, Randall MS, et al. NIX is required for programmed mitochondrial clearance during reticulocyte maturation. Proc Natl Acad Sci USA 2007;104:19500–19505. [DOI] [PMC free article] [PubMed] [Google Scholar]
- 12. Rice JE 3rd, Vannucci RC, Brierley JB. The influence of immaturity on hypoxic‐ischemic brain damage in the rat. Ann Neurol 1981;9:131–141. [DOI] [PubMed] [Google Scholar]
- 13. Clancy B, Darlington RB, Finlay BL. Translating developmental time across mammalian species. Neuroscience 2001;105:7–17. [DOI] [PubMed] [Google Scholar]
- 14. Northington FJ. Brief update on animal models of hypoxic‐ischemic encephalopathy and neonatal stroke. ILAR J 2006;47:32–38. [DOI] [PubMed] [Google Scholar]
- 15. Shi R, Weng J, Zhao L, Li XM, Gao TM, Kong J. Excessive autophagy contributes to neuron death in cerebral ischemia. CNS Neurosci Ther 2012;18:250–260. [DOI] [PMC free article] [PubMed] [Google Scholar]
- 16. Bederson JB, Pitts LH, Germano SM, Nishimura MC, Davis RL, Bartkowski HM. Evaluation of 2,3,5‐triphenyltetrazolium chloride as a stain for detection and quantification of experimental cerebral infarction in rats. Stroke 1986;17:1304–1308. [DOI] [PubMed] [Google Scholar]
- 17. Kurozumi K, Nakamura K, Tamiya T, et al. Mesenchymal stem cells that produce neurotrophic factors reduce ischemic damage in the rat middle cerebral artery occlusion model. Mol Ther 2005;11:96–104. [DOI] [PubMed] [Google Scholar]
- 18. Swanson RA, Morton MT, Tsao‐Wu G, Savalos RA, Davidson C, Sharp FR. A semiautomated method for measuring brain infarct volume. J Cereb Blood Flow Metab 1990;10:290–293. [DOI] [PubMed] [Google Scholar]
- 19. Zhao MZ, Nonoguchi N, Ikeda N, et al. Novel therapeutic strategy for stroke in rats by bone marrow stromal cells and ex vivo HGF gene transfer with HSV‐1 vector. J Cereb Blood Flow Metab 2006;26:1176–1188. [DOI] [PubMed] [Google Scholar]
- 20. Delk NA, Farach‐Carson MC. Interleukin‐6: A bone marrow stromal cell paracrine signal that induces neuroendocrine differentiation and modulates autophagy in bone metastatic PCa cells. Autophagy 2012;8:650–663. [DOI] [PMC free article] [PubMed] [Google Scholar]
- 21. Wang L, Kisaalita WS. Administration of BDNF/ginsenosides combination enhanced synaptic development in human neural stem cells. J Neurosci Methods 2011;194:274–282. [DOI] [PubMed] [Google Scholar]
- 22. Chen G, Ray R, Dubik D, et al. The E1B 19K/Bcl‐2‐binding protein Nip3 is a dimeric mitochondrial protein that activates apoptosis. J Exp Med 1997;186:1975–1983. [DOI] [PMC free article] [PubMed] [Google Scholar]
- 23. Zhu S, He J, Zhang R, et al. Therapeutic effects of quetiapine on memory deficit and brain beta‐amyloid plaque pathology in a transgenic mouse model of Alzheimer's disease. Curr Alzheimer Res 2013;10:270–278. [DOI] [PubMed] [Google Scholar]
- 24. Yano M, Hoogenraad N, Terada K, Mori M. Identification and functional analysis of human Tom22 for protein import into mitochondria. Mol Cell Biol 2000;20:7205–7213. [DOI] [PMC free article] [PubMed] [Google Scholar]
- 25. Saeki K, Suzuki H, Tsuneoka M, et al. Identification of mammalian TOM22 as a subunit of the preprotein translocase of the mitochondrial outer membrane. J Biol Chem 2000;275:31996–32002. [DOI] [PubMed] [Google Scholar]
- 26. Tsukihara T, Aoyama H, Yamashita E, et al. Structures of metal sites of oxidized bovine heart cytochrome c oxidase at 2.8 A. Science 1995;269:1069–1074. [DOI] [PubMed] [Google Scholar]
- 27. Chatre L, Ricchetti M. Large heterogeneity of mitochondrial DNA transcription and initiation of replication exposed by single‐cell imaging. J Cell Sci 2013;126:914–926. [DOI] [PubMed] [Google Scholar]
- 28. Bender A, Desplats P, Spencer B, et al. TOM40 mediates mitochondrial dysfunction induced by alpha‐synuclein accumulation in Parkinson's disease. PLoS ONE 2013;8:e62277. [DOI] [PMC free article] [PubMed] [Google Scholar]
- 29. Chacko AD, Liberante F, Paul I, Longley DB, Fennell DA. Voltage dependent anion channel‐1 regulates death receptor mediated apoptosis by enabling cleavage of caspase‐8. BMC Cancer 2010;10:380. [DOI] [PMC free article] [PubMed] [Google Scholar]
- 30. Hornig‐Do HT, Gunther G, Bust M, Lehnartz P, Bosio A, Wiesner RJ. Isolation of functional pure mitochondria by superparamagnetic microbeads. Anal Biochem 2009;389:1–5. [DOI] [PubMed] [Google Scholar]
- 31. Liu S, Sawada T, Lee S, et al. Parkinson's disease‐associated kinase PINK1 regulates Miro protein level and axonal transport of mitochondria. PLoS Genet 2012;8:e1002537. [DOI] [PMC free article] [PubMed] [Google Scholar]
- 32. Zu L, Zheng X, Wang B, et al. Ischemic preconditioning attenuates mitochondrial localization of PTEN induced by ischemia‐reperfusion. Am J Physiol Heart Circ Physiol 2011;300:H2177–H2186. [DOI] [PMC free article] [PubMed] [Google Scholar]
- 33. Franko A, Baris OR, Bergschneider E, et al. Efficient Isolation of pure and functional mitochondria from mouse tissues using automated tissue disruption and enrichment with anti‐TOM22 magnetic beads. PLoS ONE 2013;8:e82392. [DOI] [PMC free article] [PubMed] [Google Scholar]
- 34. Kabeya Y, Mizushima N, Ueno T, et al. LC3, a mammalian homologue of yeast Apg8p, is localized in autophagosome membranes after processing. EMBO J 2000;19:5720–5728. [DOI] [PMC free article] [PubMed] [Google Scholar]
- 35. Mizushima N. Methods for monitoring autophagy. Int J Biochem Cell Biol 2004;36:2491–2502. [DOI] [PubMed] [Google Scholar]
- 36. Mann SS, Hammarback JA. Molecular characterization of light chain 3. A microtubule binding subunit of MAP1A and MAP1B. J Biol Chem 1994;269:11492–11497. [PubMed] [Google Scholar]
- 37. Komatsu M, Waguri S, Chiba T, et al. Loss of autophagy in the central nervous system causes neurodegeneration in mice. Nature 2006;441:880–884. [DOI] [PubMed] [Google Scholar]
- 38. Levine B, Klionsky DJ. Development by self‐digestion: Molecular mechanisms and biological functions of autophagy. Dev Cell 2004;6:463–477. [DOI] [PubMed] [Google Scholar]
- 39. Rami A. Upregulation of Beclin 1 in the ischemic penumbra. Autophagy 2008;4:227–229. [DOI] [PubMed] [Google Scholar]
- 40. Eskelinen EL, Cuervo AM, Taylor MR, et al. Unifying nomenclature for the isoforms of the lysosomal membrane protein LAMP‐2. Traffic 2005;6:1058–1061. [DOI] [PubMed] [Google Scholar]
- 41. Cuervo AM, Dice JF. A receptor for the selective uptake and degradation of proteins by lysosomes. Science 1996;273:501–503. [DOI] [PubMed] [Google Scholar]
- 42. Biederbick A, Kern HF, Elsasser HP. Monodansylcadaverine (MDC) is a specific in vivo marker for autophagic vacuoles. Eur J Cell Biol 1995;66:3–14. [PubMed] [Google Scholar]
- 43. Munafo DB, Colombo MI. A novel assay to study autophagy: Regulation of autophagosome vacuole size by amino acid deprivation. J Cell Sci 2001;114:3619–3629. [DOI] [PubMed] [Google Scholar]
- 44. Bellot G, Garcia‐Medina R, Gounon P, et al. Hypoxia‐induced autophagy is mediated through hypoxia‐inducible factor induction of BNIP3 and BNIP3L via their BH3 domains. Mol Cell Biol 2009;29:2570–2581. [DOI] [PMC free article] [PubMed] [Google Scholar]
- 45. Zhang HM, Cheung P, Yanagawa B, McManus BM, Yang DC. BNips: A group of pro‐apoptotic proteins in the Bcl‐2 family. Apoptosis 2003;8:229–236. [DOI] [PubMed] [Google Scholar]
- 46. Chen G, Cizeau J, Vande Velde C, et al. Nix and Nip3 form a subfamily of pro‐apoptotic mitochondrial proteins. J Biol Chem 1999;274:7–10. [DOI] [PubMed] [Google Scholar]
- 47. Schwarten M, Mohrluder J, Ma P, et al. Nix directly binds to GABARAP: A possible crosstalk between apoptosis and autophagy. Autophagy 2009;5:690–698. [DOI] [PubMed] [Google Scholar]
- 48. Novak I, Kirkin V, McEwan DG, et al. Nix is a selective autophagy receptor for mitochondrial clearance. EMBO Rep 2010;11:45–51. [DOI] [PMC free article] [PubMed] [Google Scholar]
- 49. Elmore SP, Qian T, Grissom SF, Lemasters JJ. The mitochondrial permeability transition initiates autophagy in rat hepatocytes. FASEB J 2001;15:2286–2287. [DOI] [PubMed] [Google Scholar]
- 50. Twig G, Elorza A, Molina AJ, et al. Fission and selective fusion govern mitochondrial segregation and elimination by autophagy. EMBO J 2008;27:433–446. [DOI] [PMC free article] [PubMed] [Google Scholar]
- 51. Kundu M, Lindsten T, Yang CY, et al. Ulk1 plays a critical role in the autophagic clearance of mitochondria and ribosomes during reticulocyte maturation. Blood 2008;112:1493–1502. [DOI] [PMC free article] [PubMed] [Google Scholar]
- 52. He S, Wang C, Dong H, et al. Immune‐related GTPase M (IRGM1) regulates neuronal autophagy in a mouse model of stroke. Autophagy 2012;8:1621–1627. [DOI] [PMC free article] [PubMed] [Google Scholar]
- 53. Kubli DA, Ycaza JE, Gustafsson AB. Bnip3 mediates mitochondrial dysfunction and cell death through Bax and Bak. Biochem J 2007;405:407–415. [DOI] [PMC free article] [PubMed] [Google Scholar]
- 54. Burton TR, Gibson SB. The role of Bcl‐2 family member BNIP3 in cell death and disease: NIPping at the heels of cell death. Cell Death Differ 2009;16:515–523. [DOI] [PMC free article] [PubMed] [Google Scholar]
Associated Data
This section collects any data citations, data availability statements, or supplementary materials included in this article.
Supplementary Materials
Figure S1. Expression pattern of BNIP3 in stroke models.
Figure S2. OGD/RP injury‐induced autophagy and autophagic cell death in rat cortical neurons.
Figure S3. BNIP3 regulates the mitophagy pathway in OGD/RP stroke model.
Figure S4. BNIP3 regulates excessive mitophagy by interacting with LC3.
Data S1. Treatment of Autophagy Inhibitor 3‐Methyladenine (3‐MA).