

Summary
Aims
To examine the relationship between statin use in Chinese patients with intracerebral hemorrhage (ICH) during their hospitalization and the outcomes.
Methods
Data were collected from the China National Stroke Registry. Good functional outcome was defined by a modified Rankin Scale score between 0–2. Functional outcome and rate of mortality at 3 months and 1 year were compared between ICH patients on statin and those without it during their hospitalization. Odds ratios (ORs) with 95% confidence intervals (CI) were calculated using the multivariable logistic regression model adjusted for baseline risk factors.
Results
Among 3218 consecutive ICH patients from 2007 to 2008, 220 (6.8%) were on statin during their hospitalization. Compared with those without statin, patients on statin were younger, had more stroke risk factors but lower stroke severity. ICH patients on statin had better functional outcome at 3 months (OR 2.24, 95% CI 1.49–3.36) and at 1 year (OR 2.04, 95% CI 1.37–3.06). They also had lower rate of mortality at 3 months (OR 0.44, 95% CI 0.22–0.87) and 1 year (OR 0.49, 95% CI 0.27–0.86).
Conclusions
In‐hospital statin use in ICH patients is associated with better functional outcome and lower mortality at 3 months and 1 year.
Keywords: Hemorrhagic stroke, Intracerebral hemorrhage, Outcome, Statin
Introduction
Spontaneous intracerebral hemorrhage (ICH) causes about 15% of all strokes in Western populations but 20–30% of strokes in Chinese population 1, 2, 3, 4. Patients with ICH generally have a poorer prognosis and higher case fatality rate compared with those with ischemic strokes 1, 5. Statins are 3‐hydroxy‐3‐methylglutaryl coenzyme A (HMG‐CoA) reductase inhibitors. Even though they are primarily used as cholesterol lowering agents, they also possess potential neuronal protective effects in ICH. Such benefit has been reported in several animal studies 6, 7, 8. However, this benefit is inconclusive in human 9, 10, 11, 12, 13, 14, 15, 16, 17, 18. Several studies suggested that prior 9, 11, 12, 14 or continued 16, 17 statin use by ICH patients has improved their functional outcome, but others reported no significant change 10, 13, 15, 18. Some even suggested that there is an independent association of statin to higher risks of developing ICH 19. Therefore, the use of statin therapy after ICH remains controversial 20, 21, 22, 23.
Using the data from the China National Stroke Registry (CNSR) 4, we examined the relationship between statin treatment in ICH patients during their hospitalization and outcomes.
Methods
Study Design and Population
Data were collected from CNSR 4, 5, a nationwide prospective registry of 21,902 consecutive patients with a diagnosis of ischemic stroke, ICH or transient ischemic attack from 132 hospitals in China between September 2007 and August 2008. Data on demographics, vascular risk factors, clinical characteristics, medical therapies and outcomes at the 3‐, 6‐, 12‐month follow‐up visits were collected. The collection of data for the CNSR study was approved by ethics committees at all participating hospitals. All patients or his/her legal representatives gave written informed consent before being entered into the registry.
ICH was diagnosed according to the World Health Organization criteria 24 and confirmed by brain computerized tomography (CT). ICH patients older than 18 and presented to hospital within 14 days after the onset of symptoms were eligible for this study. Patients were excluded if they had any one of these conditions: ICH caused by brain tumor, data on ICH hematoma volume were unavailable, primary intraventricular hemorrhage, their prestroke modified Rankin Scale (mRS) was >2, and those did not give consents or lost to follow‐up. We also excluded patients with history of prestroke use of lipid lowering agents to avoid its impact on the outcome for the current analysis 9, 11, 12. Details on the design, rationale and methodology of CNSR have been published previously 4, 5.
Data Collection and Risk Factors Definition
Initial noncontrast CT (NCCT) scans were performed with a section thickness of 9 mm supratentorially and 4.5 mm infratentorially. ICH hematoma volume was measured on the initial NCCT of head using the ABC/2 method, in which A was the greatest diameter on the largest hemorrhage slice, B was the diameter perpendicular to A, and C was the approximate number of axial slices with hemorrhage multiplied by the slice thickness 5. Hematoma locations were classified as supratentorial and infratentorial. The presence or the absence of intraventricular extension was also noted on the initial NCCT of head.
Diabetes mellitus was defined as patient had history of diabetes mellitus or was on oral hypoglycemic medication. Hypertension was defined as patient had history of hypertension or was on antihypertensive medication. Dyslipidemia was defined as patient had history of dyslipidemia or was on lipid lowering medication. Atrial fibrillation was defined as patient had history of atrial fibrillation confirmed by at least one electrocardiogram or the presence of the arrhythmia during hospitalization. Serum lipid profile abnormality was defined as such 25: high total cholesterol level (TC, ≥5.18 mmol/L), high triglycerides level (TG, ≥1.7 mmol/L), low high‐density lipoprotein cholesterol level (HDL‐C, <1.03 mmol/L in male, <1.30 mmol/L in female), and abnormal low‐density lipoprotein cholesterol level (LDL‐C, ≥2.59 mmol/L).
Data on whether patients were treated with statin during hospitalization after ICH were recorded. Statin use was defined as there was any documentation of at least one kind of statin use at any time during hospitalization 16. Statin types included simvastatin, atorvastatin, fluvastatin, pravastatin, and lovastatin, which were prescribed regularly by physicians in China. Patients were divided into two groups: those on statin during hospitalization after ICH and those who were not.
Outcome Measures
At 3 months and 1 year after ICH onset, the outcomes of all patients were assessed by telephone interview. The telephone follow‐up was centralized for all patients and a standardized interview protocol was used by all. The primary outcomes included functional outcomes at 3 months and 1 year. Based on previously reported studies 12, 13, 18, good functional outcome was defined as mRS 0‐2 and poor functional outcome was defined as mRS 3‐6 (dependency or death). The secondary outcomes included mortality at 3 months and at 1 year.
Statistical Analysis
Categorical variables were presented as percentages and continuous variables as mean±SD or median (Q1‐Q3). Differences between the statin group and no statin group were compared using chi‐square (χ 2) test for categorical variables, and t test or Mann–Whitney U test for continuous variables. For each outcome variable, a separate univariable and multivariable logistic regression were performed. Odds ratios (ORs) with 95% confidence intervals (CI) were calculated using the no statin group as the reference. All significant baseline variables in the univariable analysis were included in the multivariable analysis. A propensity score model was developed to improve the sensitivity of analysis. The propensity for statin use during hospitalization was determined regardless of the outcome using a nonparsimonious multivariable logistic regression model. All baseline variables listed in Table 1 were included to calculate the propensity score. A propensity score, indicating the predicted probability of receiving statin treatment, was then calculated from the logistic equation for each patient. The model's reliability and predictive validity were tested with the Hosmer–Lemeshow goodness‐of‐fit test (P = 0.719) and the c‐index (c = 0.804). The propensity score was then included along with the comparison variable (no statin or not no statin) in multivariable analyses of outcome producing an adjusted OR with 95% CI. To estimate the effect of early withdrawal of care on our findings, we also performed sensitivity analyses excluding all patients who died within the first 48 h of admission.
Table 1.
Baseline characteristics of patients on or not on statin during hospitalization after intracerebral hemorrhage
| Characteristics | Total (N = 3218) | On statin (N = 220) | Not on statin (N = 2998) | P value |
|---|---|---|---|---|
| Age (year), mean (SD) | 62.1 ± 13.1 | 60.7 ± 11.9 | 62.2 ± 13.2 | 0.003 |
| Female, n (%) | 1248 (38.8) | 85 (38.6) | 1163 (38.8) | 0.97 |
| Current smoking, n (%) | 1210 (37.6) | 85 (38.6) | 1125 (37.5) | 0.74 |
| Heavy drink, n (%) | 363 (11.3) | 35 (15.9) | 328 (10.9) | 0.02 |
| Medical history, n (%) | ||||
| Diabetes mellitus | 271 (8.4) | 30 (13.6) | 241 (8.0) | 0.004 |
| Hypertension | 2177 (67.7) | 175 (79.6) | 2002 (66.8) | <0.001 |
| Dyslipidemia | 206 (6.4) | 32 (14.6) | 174 (5.8) | <0.001 |
| Cardiovascular disease | 261 (8.1) | 19 (8.6) | 242 (8.1) | 0.77 |
| Atrial fibrillation | 51 (1.6) | 5 (2.3) | 46 (1.5) | 0.57 |
| Stroke | 868 (27.0) | 67 (30.5) | 801 (26.7) | 0.23 |
| Dyslipidemia on admission, n (%) | ||||
| TC ≥ 5.18 mmol/L | 691 (21.5) | 125 (56.8) | 566 (18.9) | <0.001 |
| TG ≥ 1.7 mmol/L | 684 (21.3) | 99 (45.0) | 585 (19.5) | <0.001 |
| HDL‐C < 1.03 mmol/L (Male), <1.3 mmol/L (Female) | 862 (26.8) | 54 (24.6) | 808 (27.0) | 0.44 |
| LDL‐C ≥ 2.59 mmol/L | 1323 (41.1) | 162 (73.6) | 1161 (38.7) | <0.001 |
| Stroke severity, median (IQR) | ||||
| NIHSS score on admission | 9 (3–17) | 5 (2–10) | 9 (3–17) | <0.001 |
| GCS score on admission | 14 (9–15) | 15 (13–15) | 14 (8–15) | <0.001 |
| Hematoma volume (mL) | 12.7 (5.6–28.1) | 8.1 (4.0–16.8) | 13.5 (5.8–30.0) | <0.001 |
| Supratentorial, n (%) | ||||
| ≤30 mL | 2341 (82.7) | 174 (91.1) | 2167 (82.1) | 0.006 |
| 30–60 mL | 286 (10.1) | 11 (5.8) | 275 (10.4) | |
| >60 mL | 203 (7.2) | 6 (3.1) | 197 (7.5) | |
| Infratentorial, n (%) | ||||
| ≤10 mL | 276 (71.1) | 22 (75.9) | 254 (70.8) | 0.38 |
| 10–20 mL | 60 (15.5) | 2 (6.9) | 58 (16.2) | |
| >20 mL | 52 (13.4) | 5 (17.2) | 47 (13.1) | |
| Hematoma location, n (%) | ||||
| Supratentorial | 2830 (87.9) | 191 (86.8) | 2639 (88.0) | 0.60 |
| Infratentorial | 388 (12.1) | 29 (13.2) | 359 (12.0) | |
| Intraventricular extension, n (%) | 952 (29.6) | 52 (23.6) | 900 (30.0) | 0.045 |
| Medication history, n (%) | ||||
| Antihypertensive | 1357 (42.2) | 114 (51.8) | 1243 (41.5) | 0.003 |
| Antiplatelet | 267 (8.3) | 26 (11.8) | 241 (8.0) | 0.049 |
| Anticoagulants | 30 (0.9) | 5 (2.3) | 25 (0.8) | 0.08 |
| Treated in, n (%) | ||||
| Neurology ward/Ward | 1995 (62.0) | 149 (67.7) | 1846 (61.6) | <0.001 |
| Stroke unit | 548 (17.0) | 54 (24.6) | 494 (16.5) | |
| Neurosurgical/Intervention Ward | 94 (2.9) | 4 (1.8) | 90 (3.0) | |
| NICU/ICU | 581 (18.1) | 13 (5.9) | 568 (18.9) | |
| Medical treatment during hospitalization, n (%) | ||||
| Antihypertensive therapy | 1888 (58.7) | 168 (76.4) | 1720 (57.4) | <0.001 |
| Intravenous mannitol | 2769 (92.9) | 193 (88.1) | 2576 (93.2) | 0.005 |
| Neurosurgical intervention | 81 (2.7) | 2 (0.9) | 79 (2.9) | 0.09 |
| Withdraw of support, n (%) | 400 (12.4) | 12 (5.5) | 388 (12.9) | 0.001 |
SD, standard deviation; IQR, interquartile range; TC, total cholesterol; TG, triglyceride; HDL‐C, high‐density lipoprotein cholesterol; LDL‐C, low‐density lipoprotein cholesterol; mRS, modified Rankin Scale; NIHSS, National Institutes of Health Stroke Scale; GCS, Glasgow Coma Scale.
P values indicate comparison of on statin group with not on statin group (Pearson chi‐square test for categorical and t test or Mann–Whitney U test for continuous variables).
The α level of significance was defined as P < 0.05. All analyses were performed with SAS software version 9.3 (SAS Institute Inc, Cary, NC, USA).
Results
A total of 3218 ICH patients were eligible for this analysis, with a mean age of 62.1 years, and 38.8% were female. Among them, 220 (6.8%) patients were on statin during hospitalization after ICH. The median length of hospital stay was 18 (11–26) days for overall patients, 19 (13–26) days for patients on statin and 18 (10–26) days for patients not on statin, respectively (P = 0.16).
The demographics and clinical characteristics of ICH patients on or without statin during hospitalization after ICH are presented in Table 1. Compared with those not on statin, patients who were on statin during hospitalization were younger, had more risk factors (heavy alcohol use, diabetes mellitus, hypertension, history of dyslipidemia, higher total cholesterol, triglyceride, and low‐density lipoprotein cholesterol), had lower stroke severity on presentation (lower NIHSS score, higher Glasgow Coma Scale score, smaller hematoma volume, and less intraventricular extension), were more likely taking antihypertensive agents before or after ICH and antiplatelet agents before ICH, and less likely being treated with intravenous mannitol, NICU/ICU care or withdraw of support.
The proportion of all ICH patients (on statin group and not on statin group) with poor functional outcome was 49.1% at 3 months and 46.0% at 1 year, and the case fatality rate was 20.0% at 3 months and 26.0% at 1 year, respectively. Distribution of mRS scores at 3 months and 1 year in each group is shown in Figure 1. Baseline characteristics of patients after intracerebral hemorrhage for 3‐month and 1‐year functional outcomes and mortalities are shown in Tables 2 and 3, respectively. Multivariable logistic regression adjusted for potential confounding variables in the entire cohort revealed that statin use during hospitalization was associated with more than twofold odds of having a good functional outcome at 3 months (adjusted OR 2.24, 95% CI 1.49–3.36, P < 0.001) and 1 year (adjusted OR 2.04, 95% CI 1.37–3.06, P < 0.001), and greater than 50% lower mortality rate at 3 months (adjusted OR 0.44, 95% CI 0.22–0.87, P = 0.02) and 1 year (adjusted OR 0.49, 95% CI 0.27–0.86, P = 0.01). These results were confirmed in models adjusted for propensity score in the entire cohort and in models that exclude death within the first 48 h of admission (Table 4).
Figure 1.
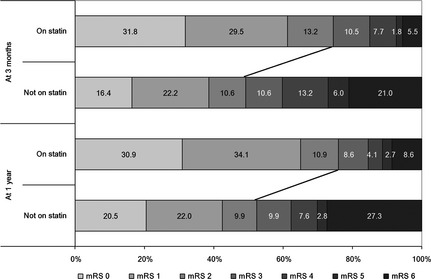
Distribution of modified Rankin Scale (mRS) scores at 3 months and 1 year by groups. The size of the bars indicates the percentage of patients with a particular mRS score in groups of patients with or without statin use during hospitalization.
Table 2.
Baseline characteristics of patients after intracerebral hemorrhage for 3‐month and 1‐year functional outcomes
| Characteristics | 3‐month outcomea | 1‐year outcomea | ||||
|---|---|---|---|---|---|---|
| Good (N = 1638) | Poor (N = 1580) | P value | Good (N = 1736) | Poor (N = 1482) | P value | |
| Age (year), mean (SD) | 59.7 ± 12.5 | 64.5 ± 13.3 | <0.001 | 59.2 ± 12.2 | 65.4 ± 13.3 | <0.001 |
| Female, n (%) | 590 (36.0) | 658 (41.6) | 0.001 | 642 (37.0) | 606 (40.9) | 0.02 |
| Current smoking, n (%) | 648 (39.6) | 562 (35.6) | 0.02 | 684 (39.4) | 526 (35.5) | 0.02 |
| Heavy drink, n (%) | 206 (12.6) | 157 (9.9) | 0.02 | 221 (12.7) | 142 (9.6) | 0.005 |
| Medical history, n (%) | ||||||
| Diabetes mellitus | 118 (7.2) | 153 (9.7) | 0.01 | 124 (7.1) | 147 (9.9) | 0.005 |
| Hypertension | 1103 (67.3) | 1074 (68.0) | 0.70 | 1172 (67.5) | 1005 (67.8) | 0.86 |
| Dyslipidemia | 123 (7.5) | 83 (5.3) | 0.009 | 130 (7.5) | 76 (5.1) | 0.006 |
| Cardiovascular disease | 109 (6.7) | 152 (9.6) | 0.002 | 117 (6.7) | 144 (9.7) | 0.002 |
| Atrial fibrillation | 17 (1.0) | 34 (2.2) | 0.01 | 19 (1.1) | 32 (2.2) | 0.02 |
| Stroke | 370 (22.6) | 498 (31.5) | <0.001 | 369 (21.3) | 499 (33.7) | <0.001 |
| Dyslipidemia on admission, n (%) | ||||||
| TC ≥ 5.18 mmol/L | 369 (22.5) | 322 (20.4) | 0.14 | 395 (22.8) | 296 (20.0) | 0.056 |
| TG ≥ 1.7 mmol/L | 418 (25.5) | 266 (16.8) | <0.001 | 443 (25.5) | 241 (16.3) | <0.001 |
| HDL‐C < 1.03 mmol/L (Male), <1.3 mmol/L (Female) | 415 (25.3) | 447 (28.3) | 0.058 | 433 (24.9) | 429 (29.0) | 0.01 |
| LDL‐C ≥ 2.59 mmol/L | 733 (44.7) | 590 (37.3) | <0.001 | 781 (45.0) | 542 (36.6) | <0.001 |
| Stroke severity, median (IQR) | ||||||
| NIHSS score on admission | 4 (2–9) | 15 (9–25) | <0.001 | 5 (2–10) | 15 (8–25) | <0.001 |
| GCS score on admission | 15 (14–15) | 10 (6–14) | <0.001 | 15 (14–15) | 10 (6–15) | <0.001 |
| Hematoma volume (mL) | 9.0 (4.0–18.0) | 20.0 (9.0–42.0) | <0.001 | 9.1 (4.4–18.8) | 20.0 (8.4–45.0) | <0.001 |
| Supratentorial, n (%) | ||||||
| ≤30 mL | 1374 (94.0) | 967 (70.6) | <0.001 | 1452 (93.6) | 889 (69.6) | <0.001 |
| 30–60 mL | 63 (4.3) | 223 (16.3) | 74 (4.8) | 212 (16.6) | ||
| >60 mL | 24 (1.6) | 179 (13.1) | 26 (1.7) | 177 (13.8) | ||
| Infratentorial, n (%) | ||||||
| ≤10 mL | 139 (78.5) | 137 (64.9) | 0.01 | 141 (76.6) | 135 (66.2) | 0.04 |
| 10–20 mL | 20 (11.3) | 40 (19.0) | 26 (14.1) | 34 (16.7) | ||
| >20 mL | 18 (10.2) | 34 (16.1) | 17 (9.2) | 35 (17.2) | ||
| Hematoma location, n (%) | ||||||
| Supratentorial | 1461 (89.2) | 1369 (86.6) | 0.03 | 1552 (89.4) | 1278 (86.2) | 0.006 |
| Infratentorial | 177 (10.8) | 211 (13.4) | 184 (10.6) | 204 (13.8) | ||
| Intraventricular extension, n (%) | 313 (19.1) | 639 (40.4) | <0.001 | 342 (19.7) | 610 (41.2) | <0.001 |
| Medication history, n (%) | ||||||
| Antihypertensive | 693 (42.3) | 664 (42.0) | 0.87 | 737 (42.5) | 620 (41.8) | 0.72 |
| Antiplatelet | 128 (7.8) | 139 (8.8) | 0.31 | 135 (7.8) | 132 (8.9) | 0.25 |
| Anticoagulants | 14 (0.9) | 16 (1.0) | 0.64 | 13 (0.7) | 17 (1.1) | 0.24 |
| Treated in, n (%) | ||||||
| Neurology ward/Ward | 1128 (68.9) | 867 (54.9) | <0.001 | 1151 (66.3) | 844 (57.0) | <0.001 |
| Stroke unit | 290 (17.7) | 258 (16.3) | 322 (18.5) | 226 (15.2) | ||
| Neurosurgical/Intervention Ward | 40 (2.4) | 54 (3.4) | 48 (2.8) | 46 (3.1) | ||
| NICU/ICU | 180 (11.0) | 401 (25.4) | 215 (12.4) | 366 (24.7) | ||
| Medical treatment during hospitalization, n (%) | ||||||
| Antihypertensive therapy | 1035 (63.2) | 853 (54.0) | <0.001 | 1100 (63.4) | 788 (53.2) | <0.001 |
| Intravenous mannitol | 1424 (90.1) | 1345 (96.0) | <0.001 | 1521 (90.8) | 1248 (95.5) | <0.001 |
| Neurosurgical intervention | 21 (1.3) | 60 (4.3) | <0.001 | 28 (1.7) | 53 (4.1) | <0.001 |
| Withdraw of support, n (%) | 108 (6.6) | 292 (18.5) | <0.001 | 115 (6.6) | 285 (19.2) | <0.001 |
SD, standard deviation; IQR, interquartile range; TC, total cholesterol; TG, triglyceride; HDL‐C, high‐density lipoprotein cholesterol; LDL‐C, low‐density lipoprotein cholesterol; mRS, modified Rankin Scale; NIHSS, National Institutes of Health Stroke Scale; GCS, Glasgow Coma Scale.
P values indicate comparison of good outcome group with poor outcome group (Pearson chi‐square test for categorical and t test or Mann–Whitney U test for continuous variables).
Good outcome defined as modified Rankin Scale 0–2.
Table 3.
Baseline characteristics of patients after intracerebral hemorrhage for 3‐month and 1‐year death
| Characteristics | 3‐month death | 1‐year death | ||||
|---|---|---|---|---|---|---|
| Death (N = 642) | Survival (N = 2576) | P value | Death (N = 838) | Survival (N = 2380) | P value | |
| Age (year), mean (SD) | 65.7 ± 14.1 | 61.2 ± 12.7 | <0.001 | 66.0 ± 13.9 | 60.7 ± 12.5 | <0.001 |
| Female, n (%) | 259 (40.3) | 989 (38.4) | 0.36 | 328 (39.1) | 920 (38.7) | 0.80 |
| Current smoking, n (%) | 230 (35.8) | 980 (38.0) | 0.30 | 303 (36.2) | 907 (38.1) | 0.32 |
| Heavy drink, n (%) | 60 (9.3) | 303 (11.8) | 0.08 | 72 (8.6) | 291 (12.2) | 0.004 |
| Medical history, n (%) | ||||||
| Diabetes mellitus | 68 (10.6) | 203 (7.9) | 0.02 | 89 (10.6) | 182 (7.6) | 0.008 |
| Hypertension | 426 (66.4) | 1751 (68.0) | 0.43 | 559 (66.7) | 1618 (68.0) | 0.50 |
| Dyslipidemia | 26 (4.0) | 180 (7.0) | 0.007 | 33 (3.9) | 173 (7.3) | <0.001 |
| Cardiovascular disease | 62 (9.7) | 199 (7.7) | 0.11 | 81 (9.7) | 180 (7.6) | 0.055 |
| Atrial fibrillation | 20 (3.1) | 31 (1.2) | <0.001 | 24 (2.9) | 27 (1.1) | <0.001 |
| Stroke | 214 (33.3) | 654 (25.4) | <0.001 | 296 (35.3) | 572 (24.0) | <0.001 |
| Dyslipidemia on admission, n (%) | ||||||
| TC ≥ 5.18 mmol/L | 110 (17.1) | 581 (22.6) | 0.003 | 143 (17.1) | 548 (23.0) | <0.001 |
| TG ≥ 1.7 mmol/L | 75 (11.7) | 609 (23.6) | <0.001 | 106 (12.6) | 578 (24.3) | <0.001 |
| HDL‐C < 1.03 mmol/L (Male), <1.3 mmol/L (Female) | 224 (34.9) | 638 (24.8) | <0.001 | 283 (33.8) | 579 (24.3) | <0.001 |
| LDL‐C ≥ 2.59 mmol/L | 169 (26.3) | 1154 (44.8) | <0.001 | 239 (28.5) | 1084 (45.5) | <0.001 |
| Stroke severity, median (IQR) | ||||||
| NIHSS score on admission | 21 (11–33) | 7 (3–13) | <0.001 | 19 (10–31) | 7 (2–12) | <0.001 |
| GCS score on admission | 7 (4–12) | 15 (11–15) | <0.001 | 7 (4–13) | 15 (12–15) | <0.001 |
| Hematoma volume (mL) | 28.0 (12.0–60.0) | 11.5 (4.7–24.0) | <0.001 | 24.0 (10.0–55.0) | 11.2 (4.5–22.6) | <0.001 |
| Supratentorial, n (%) | ||||||
| ≤30 mL | 297 (55.8) | 2044 (88.9) | <0.001 | 422 (60.2) | 1919 (90.1) | <0.001 |
| 30–60 mL | 106 (19.9) | 180 (7.8) | 132 (18.8) | 154 (7.2) | ||
| >60 mL | 129 (24.2) | 74 (3.2) | 147 (21.0) | 56 (2.6) | ||
| Infratentorial, n (%) | ||||||
| ≤10 mL | 67 (60.9) | 209 (75.2) | 0.009 | 85 (62.0) | 191 (76.1) | 0.01 |
| 10–20 mL | 20 (18.2) | 40 (14.4) | 26 (19.0) | 34 (13.5) | ||
| >20 mL | 23 (20.9) | 29 (10.4) | 26 (19.0) | 26 (10.4) | ||
| Hematoma location, n (%) | ||||||
| Supratentorial | 532 (82.9) | 2298 (89.2) | <0.001 | 701 (83.7) | 2129 (89.5) | <0.001 |
| Infratentorial | 110 (17.1) | 278 (10.8) | 137 (16.3) | 251 (10.5) | ||
| Intraventricular extension, n (%) | 344 (53.6) | 608 (23.6) | <0.001 | 413 (49.3) | 539 (22.6) | <0.001 |
| Medication history, n (%) | ||||||
| Antihypertensive | 253 (39.4) | 1104 (42.9) | 0.11 | 331 (39.5) | 1026 (43.1) | 0.07 |
| Anti‐platelet | 47 (7.3) | 220 (8.5) | 0.32 | 63 (7.5) | 204 (8.6) | 0.34 |
| Anticoagulants | 8 (1.2) | 22 (0.9) | 0.36 | 11 (1.3) | 19 (0.8) | 0.18 |
| Treated in, n (%) | ||||||
| Neurology ward/Ward | 349 (54.4) | 1646 (63.9) | <0.001 | 464 (55.4) | 1531 (64.3) | <0.001 |
| Stroke unit | 75 (11.7) | 473 (18.4) | 107 (12.8) | 441 (18.5) | ||
| Neurosurgical/Intervention Ward | 22 (3.4) | 72 (2.8) | 28 (3.3) | 66 (2.8) | ||
| NICU/ICU | 196 (30.5) | 385 (14.9) | 239 (28.5) | 342 (14.4) | ||
| Medical treatment during hospitalization, n (%) | ||||||
| Antihypertensive therapy | 294 (45.8) | 1594 (61.9) | <0.001 | 402 (48.0) | 1486 (62.4) | <0.001 |
| Intravenous mannitol | 503 (97.7) | 2266 (91.9) | <0.001 | 659 (96.2) | 2110 (91.9) | 0.001 |
| Neurosurgical intervention | 27 (5.2) | 54 (2.2) | 0.001 | 32 (4.7) | 49 (2.1) | 0.004 |
| Withdraw of support, n (%) | 181 (28.2) | 219 (8.5) | <0.001 | 216 (25.8) | 184 (7.7) | <0.001 |
SD, standard deviation; IQR, interquartile range; TC, total cholesterol; TG, triglyceride; HDL‐C, high‐density lipoprotein cholesterol; LDL‐C, low‐density lipoprotein cholesterol; mRS, modified Rankin Scale; NIHSS, National Institutes of Health Stroke Scale; GCS, Glasgow Coma Scale.
P values indicate comparison of death group with survival group (Pearson chi‐square test for categorical and t test or Mann‐Whitney U test for continuous variables).
Table 4.
Outcomes of patients on or not on statin during hospitalization after intracerebral hemorrhage
| Outcome | Model | On statin n/N (%) | Not on statin n/N (%) | Odds Ratioa (95% CI) | P value |
|---|---|---|---|---|---|
| At 3 months | |||||
| Good outcomeb | Entire cohort (N = 3218) | ||||
| Univariable | 164/220 (74.5) | 1474/2998 (49.2) | 3.03 (2.22–4.14) | <0.001 | |
| Adjusted for risk factorsc | 2.24 (1.49–3.36) | <0.001 | |||
| Adjusted for propensity score | 1.93 (1.36–2.72) | <0.001 | |||
| Excluding death ≤48 h (N = 3073) | |||||
| Univariable | 164/219 (74.9) | 1474/2854 (51.6) | 2.79 (2.04–3.82) | <0.001 | |
| Adjusted for risk factorsc | 2.23 (1.48–3.36) | <0.001 | |||
| Adjusted for propensity score | 1.90 (1.34–2.68) | <0.001 | |||
| Death | Entire cohort (N = 3218) | ||||
| Univariable | 12/220 (5.5) | 630/2998 (21.0) | 0.22 (0.12–0.39) | <0.001 | |
| Adjusted for risk factorsd | 0.44 (0.22–0.87) | 0.02 | |||
| Adjusted for propensity score | 0.53 (0.28–0.97) | 0.04 | |||
| Excluding death ≤48 h (N = 3073) | |||||
| Univariable | 11/219 (5.0) | 486/2854 (17.0) | 0.26 (0.14–0.48) | <0.001 | |
| Adjusted for risk factorsd | 0.43 (0.21–0.88) | 0.02 | |||
| Adjusted for propensity score | 0.54 (0.29–1.03) | 0.06 | |||
| At 1 year | |||||
| Good outcomeb | Entire cohort (N = 3218) | ||||
| Univariable | 167/220 (75.9) | 1569/2998 (52.3) | 2.89 (2.09–3.94) | <0.001 | |
| Adjusted for risk factorsc | 2.04 (1.37–3.06) | <0.001 | |||
| Adjusted for propensity score | 1.93 (1.36–2.74) | <0.001 | |||
| Excluding death ≤48 h (N = 3073) | |||||
| Univariable | 167/219 (76.3) | 1569/2854 (55.0) | 2.63 (1.91–3.62) | <0.001 | |
| Adjusted for risk factorsc | 2.05 (1.36–3.07) | <0.001 | |||
| Adjusted for propensity score | 1.90 (1.34–2.70) | <0.001 | |||
| Death | Entire cohort (N = 3218) | ||||
| Univariable | 19/220 (8.6) | 819/2998 (27.3) | 0.25 (0.16–0.41) | <0.001 | |
| Adjusted for risk factorsd | 0.49 (0.27–0.86) | 0.01 | |||
| Adjusted for propensity score | 0.55 (0.34–0.92) | 0.02 | |||
| Excluding death ≤48 h (N = 3073) | |||||
| Univariable | 18/219 (8.2) | 675/2854 (23.7) | 0.29 (0.18–0.47) | <0.001 | |
| Adjusted for risk factorsd | 0.48 (0.27–0.86) | 0.01 | |||
| Adjusted for propensity score | 0.57 (0.34–0.95) | 0.03 | |||
CI, confidence interval; mRS, modified Rankin Scale.
Odds ratios using the not on statin group as the reference.
Good outcome defined as modified Rankin Scale 0–2.
Risk factors include the following: age, gender, smoking, heavy drink, history of diabetes mellitus, dyslipidemia, cardiovascular disease, atrial fibrillation and stroke, triglyceride, high‐density lipoprotein cholesterol, low‐density lipoprotein cholesterol, National Institutes of Health Stroke Scale score, and Glasgow Coma Scale score on admission, hematoma volume, hematoma location, intraventricular hemorrhagic extension, NICU/ICU care, antihypertensive therapy, intravenous mannitol therapy, neurosurgical intervention, and withdraw of support during hospitalization.
Risk factors include the following: age, heavy drink, history of diabetes mellitus, dyslipidemia, atrial fibrillation and stroke, total cholesterol, triglyceride, high‐density lipoprotein cholesterol, low‐density lipoprotein cholesterol, National Institutes of Health Stroke Scale score, and Glasgow Coma Scale score on admission, hematoma volume, hematoma location, intraventricular hemorrhagic extension, NICU/ICU care, antihypertensive therapy, intravenous mannitol therapy, neurosurgical intervention, and withdraw of support during hospitalization.
Discussion
In this retrospective analysis of prospectively collected multicenter registry data, we found that statin use during hospitalization in patients with acute ICH was associated with favorable functional outcome and lower mortality both at 3 months and 1 year. Our study focused on the effect of statin use during hospitalization, which is different from others that focused on the effect of prior statin use 9, 10, 11, 12, 13, 14, 15, 18 or discontinuation of statin 16, 17. Our study found that only small percentage of Chinese ICH patients were on statin during hospitalization (6.8%), which is significantly lower than that in Western patients (14–44%) 16, 26, 27. Our findings were confirmatory to other published results 16, 26, 27. Another study in a smaller cohort showed similar results that in‐hospital statin treatment after ICH was associated with decreased odds of death or disability at 12 months 27. Report from the Registry of the Canadian Stroke Network (N = 2466) suggested that ICH patients who were on statin during hospitalization had better functional outcome at discharge. However, such benefit was lost once patients who died within 48 h or discharged to palliative care were excluded 16.
It is possible that starting an ICH patient on statin can be biased in observational study 11, 16, 28. It is an evidence of confounding by indication that statin use during hospitalization may have been a marker for those patients who may have more stroke risk factors or lower stroke severity. Physicians prescribed statins in ICH patients for dyslipidemia, not for ICH. Physicians are less likely to prescribe statins in patients with more severe hemorrhagic stroke or in those with dysphagia and unable to swallow medications 16. If so, statin therapy could indicate less severe stroke. Age and stroke severity variables were independent risk factors of unfavorable prognosis. For instance, the multivariable regression analyses in our study shows younger age (adjusted OR 0.95, 95% CI 0.94–0.96), lower NIHSS score (adjusted OR 0.88, 95% CI 0.86–0.89), higher Glasgow Coma Scale score (adjusted OR 1.07, 95% CI 1.04–1.10), smaller hematoma volume (adjusted OR 0.98, 95% CI 0.98–0.99), and less intraventricular extension (adjusted OR 0.63, 95% CI 0.50–0.78) are associated with good outcome at 1 year. These baseline characteristics of patients on statin could indicate favorable prognosis. We performed multivariable regression analysis adjusted for baseline variables or the propensity score and sensitivity analyses after excluding death within the first 48 h of admission. The consistency of these analyses emphasized the robustness of the results.
Our study has several limitations. First, the CNSR study is a prospective registry study, and the exact dose, starting date, duration, and type of statins used were unavailable. We used the definition of statin use during hospitalization according to another previous study 16 to compare the results with each other. It is noted that high‐dose statin therapy may be associated with a higher risk of ICH 19. However, this association is not significant in a recent meta‐analysis of 31 randomized controlled trials 29. A retrospective cohort study including 17872 ischemic stroke patients found no dose–response association between statin use and ICH, and also no interaction between statin therapy and subgroup characteristics including age and gender 30. Secondary brain injury takes place soon after the ICH, and acute inflammatory reaction lasts for a few weeks after ICH in animal models 31, 32, 33. Starting statin therapy at different stages of brain injury after ICH onset (in the hyperacute phase or 1 week after ICH) may result in different effect of inflammation inhibition and other potential neuronal protective effects. It is unclear how long the patients who were started on a statin during the acute hospitalization were maintained on the drug, and the possibility of harm with prolonged use in this population cannot be excluded. Actually, 90.9% of included patients arrived to the registry hospital within 24 h after onset of ICH, and the median length of hospital stay was 18 (11–26) days in our study. Second, the information on participating in rehabilitation and medication compliance after discharge was unavailable, which would affect the outcome in these patients. Third, although statistical adjustment was performed with multivariable models, there is concern for residual, unmeasured confounding.
Conclusion
In this large cohort observational study, statin use during hospitalization in patients with acute ICH was associated with favorable functional outcome and lower mortality both at 3 months and 1 year. Future clinical trials are needed to further confirm such favorable effect of statin in ICH patients.
Conflict of Interest
The authors declare no conflict of interest.
Supporting information
Data S1. The CNSR investigators.
Acknowledgment
We thank all participating hospitals, relevant clinicians and patients, and imaging and laboratory technicians. The CNSR is funded by the Ministry of Science and Technology and the Ministry of Health of the People's Republic of China. The Grant Numbers are 2006BA101A11 and 2009CB521905.
The first two authors contributed equally to this work.
CNSR investigators are in Data S1.
References
- 1. Qureshi AI, Tuhrim S, Broderick JP, Batjer HH, Hondo H, Hanley DF. Spontaneous intracerebral hemorrhage. N Engl J Med 2001;344:1450–1460. [DOI] [PubMed] [Google Scholar]
- 2. Jiang B, Wang WZ, Chen H, et al. Incidence and trends of stroke and its subtypes in China: results from three large cities. Stroke 2006;37:63–68. [DOI] [PubMed] [Google Scholar]
- 3. Zhao D, Liu J, Wang W, et al. Epidemiological transition of stroke in China: twenty‐one‐year observational study from the Sino‐MONICA‐Beijing Project. Stroke 2008;39:1668–1674. [DOI] [PubMed] [Google Scholar]
- 4. Wang Y, Cui L, Ji X, et al. The China National Stroke Registry for patients with acute cerebrovascular events: design, rationale, and baseline patient characteristics. Int J Stroke 2011;6:355–361. [DOI] [PubMed] [Google Scholar]
- 5. Wang WJ, Lu JJ, Wang YJ, et al. Clinical characteristics, management, and functional outcomes in Chinese patients within the first year after intracerebral hemorrhage: analysis from China National Stroke Registry. CNS Neurosci Ther 2012;18:773–780. [DOI] [PMC free article] [PubMed] [Google Scholar]
- 6. Seyfried D, Han Y, Lu D, Chen J, Bydon A, Chopp M. Improvement in neurological outcome after administration of atorvastatin following experimental intracerebral hemorrhage in rats. J Neurosurg 2004;101:104–107. [DOI] [PubMed] [Google Scholar]
- 7. Karki K, Knight RA, Han Y, et al. Simvastatin and atorvastatin improve neurological outcome after experimental intracerebral hemorrhage. Stroke 2009;40:3384–3389. [DOI] [PMC free article] [PubMed] [Google Scholar]
- 8. Jung KH, Chu K, Jeong SW, et al. HMG‐CoA reductase inhibitor, atorvastatin, promotes sensorimotor recovery, suppressing acute inflammatory reaction after experimental intracerebral hemorrhage. Stroke 2004;35:1744–1749. [DOI] [PubMed] [Google Scholar]
- 9. Naval NS, Abdelhak TA, Zeballos P, Urrunaga N, Mirski MA, Carhuapoma JR. Prior statin use reduces mortality in intracerebral hemorrhage. Neurocrit Care 2008;8:6–12. [DOI] [PubMed] [Google Scholar]
- 10. FitzMaurice E, Wendell L, Snider R, et al. Effect of statins on intracerebral hemorrhage outcome and recurrence. Stroke 2008;39:2151–2154. [DOI] [PubMed] [Google Scholar]
- 11. Leker RR, Khoury ST, Rafaeli G, Shwartz R, Eichel R, Tanne D. Prior use of statins improves outcome in patients with intracerebral hemorrhage: prospective data from the National Acute Stroke Israeli Surveys (NASIS). Stroke 2009;40:2581–2584. [DOI] [PubMed] [Google Scholar]
- 12. Gomis M, Ois A, Rodríguez‐Campello A, et al. Outcome of intracerebral haemorrhage patients pre‐treated with statins. Eur J Neurol 2010;17:443–448. [DOI] [PubMed] [Google Scholar]
- 13. Eichel R, Khoury ST, Ben‐Hur T, Keidar M, Paniri R, Leker RR. Prior use of statins and outcome in patients with intracerebral haemorrhage. Eur J Neurol 2010;17:78–83. [DOI] [PubMed] [Google Scholar]
- 14. Biffi A, Devan WJ, Anderson CD, et al. Statin use and outcome after intracerebral hemorrhage: case‐control study and meta‐analysis. Neurology 2011;76:1581–1588. [DOI] [PMC free article] [PubMed] [Google Scholar]
- 15. King NK, Tay VK, Allen JC, Ang BT. Prior statin use has no effect on survival after intracerebral hemorrhage in a multiethnic Asian patient cohort. Acta Neurochir Suppl 2012;114:343–346. [DOI] [PubMed] [Google Scholar]
- 16. Dowlatshahi D, Demchuk AM, Fang J, et al. Association of statins and statin discontinuation with poor outcome and survival after intracerebral hemorrhage. Stroke 2012;43:1518–1523. [DOI] [PubMed] [Google Scholar]
- 17. Tapia‐Pérez JH, Rupa R, Zilke R, Gehring S, Voellger B, Schneider T. Continued statin therapy could improve the outcome after spontaneous intracerebral hemorrhage. Neurosurg Rev 2013;36:279–287. [DOI] [PubMed] [Google Scholar]
- 18. Mustanoja S, Strbian D, Putaala J, et al. Association of prestroke statin use and lipid levels with outcome of intracerebral hemorrhage. Stroke 2013;44:2330–2332. [DOI] [PubMed] [Google Scholar]
- 19. Goldstein LB, Amarenco P, Szarek M, et al. Hemorrhagic stroke in the stroke prevention by aggressive reduction in cholesterol levels study. Neurology 2008;70:2364–2370. [DOI] [PubMed] [Google Scholar]
- 20. Scheitz JF, Nolte CH, Endres M. Should statins be paused or discontinued after thrombolysis or acute intracerebral hemorrhage? No!. Stroke 2013;44:1472–1476. [DOI] [PubMed] [Google Scholar]
- 21. Bustamante A, Montaner J. Statin therapy should not be discontinued in patients with intracerebral hemorrhage. Stroke 2013;44:2060–2061. [DOI] [PubMed] [Google Scholar]
- 22. Goldstein LB. Statin therapy should be discontinued in patients with intracerebral hemorrhage. Stroke 2013;44:2058–2059. [DOI] [PubMed] [Google Scholar]
- 23. Molina CA, Selim MH. Continued statin treatment after acute intracranial hemorrhage: fighting fire with fire. Stroke 2013;44:2062–2063. [DOI] [PubMed] [Google Scholar]
- 24. Goldstein M, Barnett HJM, Orgogozo JM, et al. Recommendations on stroke prevention, diagnosis, and therapy. Report of the who task force on stroke and other cerebrovascular disorders. Stroke 1989;20:1407–1431. [DOI] [PubMed] [Google Scholar]
- 25. Expert Panel on Detection, Evaluation, and Treatment of High Blood Cholesterol in Adults . Executive Summary of The Third Report of The National Cholesterol Education Program (NCEP) Expert Panel on Detection, Evaluation, And Treatment of High Blood Cholesterol In Adults (Adult Treatment Panel III). JAMA 2001;285:2486–2497. [DOI] [PubMed] [Google Scholar]
- 26. Tapia‐Perez H, Sanchez‐Aguilar M, Torres‐Corzo JG, et al. Use of statins for the treatment of spontaneous intracerebral hemorrhage: results of a pilot study. Cent Eur Neurosurg 2009;70:15–20. [DOI] [PubMed] [Google Scholar]
- 27. Winkler J, Shoup JP, Czap A, et al. Long‐term improvement in outcome after intracerebral hemorrhage in patients treated with statins. J Stroke Cerebrovasc Dis 2013;22:541–545. [DOI] [PubMed] [Google Scholar]
- 28. Stürmer T, Glynn RJ, Rothman KJ, Avorn J, Schneeweiss S. Adjustments for unmeasured confounders in pharmacoepidemiologic database studies using external information. Med Care 2007;45:S158–S165. [DOI] [PMC free article] [PubMed] [Google Scholar]
- 29. McKinney JS, Kostis WJ. Statin therapy and the risk of intracerebral hemorrhage: a meta‐analysis of 31 randomized controlled trials. Stroke 2012;43:2149–2156. [DOI] [PubMed] [Google Scholar]
- 30. Hackam DG, Austin PC, Huang A, et al. Statins and intracerebral hemorrhage: a retrospective cohort study. Arch Neurol 2012;69:39–45. [DOI] [PubMed] [Google Scholar]
- 31. Keep RF, Hua Y, Xi G. Intracerebral haemorrhage: mechanisms of injury and therapeutic targets. Lancet Neurol 2012;11:720–731. [DOI] [PMC free article] [PubMed] [Google Scholar]
- 32. Gong C, Hoff JT, Keep RF. Acute inflammatory reaction following experimental intracerebral hemorrhage in rat. Brain Res 2000;871:57–65. [DOI] [PubMed] [Google Scholar]
- 33. Xue M, Del Bigio MR. Intracerebral injection of autologous whole blood in rats: time course of inflammation and cell death. Neurosci Lett 2000;283:230–232. [DOI] [PubMed] [Google Scholar]
Associated Data
This section collects any data citations, data availability statements, or supplementary materials included in this article.
Supplementary Materials
Data S1. The CNSR investigators.