

Summary
Aims
Disturbance of the balance between mitochondrial fission and fusion has been implicated in cerebral ischemia and several neurodegenerative diseases, whereas the underlying mechanisms remain poorly understood. In the present study, we attempted to investigate the role of dynamin‐related protein 1 (Drp1), a key mitochondrial fission protein, in the pathogenesis of cerebral ischemia.
Methods
Using Drp1 siRNA or Mdivi‐1, a small molecule inhibitor of Drp1, we examined the effect of Drp1 knockdown or inhibition on oxygen‐glucose deprivation (OGD)‐induced mitochondrial dysfunction and death of SH‐SY‐5Y cells. Cell death and viability were evaluated with LDH and MTT assays, respectively, and mitochondrial morphology, mitochondrial membrane potential (Δψm), and ATP production were assessed using epifluorescence microscopy, flow cytometry, and HPLC, respectively. Moreover, to examine the effect of Drp1 inhibition on ischemic brain injury, middle cerebral artery occlusion (MCAO) mice were injected (i.p.) with Mdivi1, and blood–brain barrier permeability, brain water content, and cell apoptosis were assessed.
Results
Knockdown or inhibition of Drp1 by Mdivi‐1 significantly attenuated OGD‐induced cell death in SH‐SY‐5Y cells, associated with reduced morphological change of mitochondria and attenuated Bax insertion,oligomerization. Moreover, treatment of the MCAO mice with Mdivi‐1 remarkably reduced the infarct volume and neurological deficits in a dose‐dependent manner, associated with marked reduction of mitochondrial fragmentation and BAX expression.
Conclusions
Down‐regulation or inhibition of Drp1 may reduce cerebral ischemic damage through maintaining normal mitochondrial morphology and function, and decreasing Bax insertion and oligomerization in mitochondria.
Keywords: Bax oligomerization, Drp1, Mdivi‐1, Mitochondrial dynamics, Neurons
Introduction
Mitochondria are mobile organelles that exist in dynamic networks. They continuously join by the process of fusion and divide by the process of fission. These dynamic processes are essential for synaptic functions 1, 2, 3 and are also involved in cell apoptosis 4, 5. While mitochondrial fusion is mediated in part by the outer membrane dynamin‐like GTPases mitofusin‐1 and ‐2 (Mfn1 and Mfn2) and by the inner membrane optic atrophy protein (Opa1) 6, 7, the GTPase dynamin‐related protein 1 (Drp1) plays a role in mitochondrial fragmentation through conjugating with other outer membrane proteins, such as hFis1 8. It has been reported that an enhanced Drp1 GTPase activity is associated with detrimental mitochondrial fragmentation in the process of either acute or chronic neuronal death. For instance, in Huntington's disease, mutant huntingtin (HTT) plays a role in dramatic mitochondrial fragmentation possibly through interacting with Drp1 and thereby enhancing its enzymatic activity. Expression of a dominant‐negative mutant of Drp1 (Drp1‐K38A) has been shown to prevent neuronal apoptosis 9. Based on the recent findings, it was observed that oxygen‐glucose deprivation (OGD) or glutamate promoted Drp1 translocation to mitochondria, and inhibition of Drp1 prevented morphological changes of mitochondria and the subsequent cell death 10, it is hypothesized that Drp1‐dependent mitochondrial fission may be closely associated with mitochondrial apoptotic pathways 11, 12, 13 and that inhibition of Drp1 could represent a potential therapeutic strategy for neurological diseases. Although the underlying mechanisms remains incompletely understood, increasing lines of evidence indicate that Drp1 stimulates Bax oligomerization and cytochrome c release 14, 15, which are essential for mitochondrial outer membrane permeabilization and the release of apoptotic factors.
In the present study, we attempted to explore the molecular mechanism by which Drp1 regulates neuronal cell death and to examine the potential therapeutic effect of Drp1 inhibition on cerebral ischemia. By using a small molecule inhibitor of Drp1 or knocking down the endogenous Drp1 with specific short‐interference RNA (siRNA), we observed that knockdown or inhibition of Drp1‐protected neurons against ischemic damage. This was associated with reduced morphological and functional changes of mitochondria, delayed Bax insertion and oligomerization, and attenuated cytochrome c release.
Materials and methods
Animal
Male C57BL/6 mice (body weight: 18–25 g), housed in the Experimental Animal Center, Tongji University, were used in this study. The experimental protocol was approved by the Animal Care and Use Committee of The Tenth People's Hospital of Shanghai (Permit number: 2011‐0111).
Mdivi‐1 Treatment
Mdivi‐1(3‐(2,4‐dichloro‐5‐methoxyphenyl)‐2‐sulfanyl‐4(3H)‐quinazolinone) was purchased from Sigma‐Aldrich (St. Louis, MO, USA) and dissolved in DMSO (100 mg/mL) as stock. Before injection to animals, mdivi‐1 was diluted in sterile saline and gently sonicated for 30 s to produce a homogenous suspension. For cell culture experiments, the mdivi‐1 stock solution was diluted with culture medium to various working concentrations, which were added to cell culture 5 min before OGD procedure.
Cell Culture and Generation of Oxygen–Glucose Deprivation (OCG) Model
The human neuroblastoma cell line SH‐SY‐5Y was maintained in Dulbecco's modified Eagle's medium (DMEM) containing 10% fetal bovine serum (FBS) 37°C with 5% CO2. To generate OGD cell model 16, cells were incubated with glucose‐free medium in an anaerobic chamber (Model 1025; Forma Scientific, Vernon Hills, IL, USA) containing 85% N2, 10% H2, and 5% CO2 (< 0.1% O2) at 37°C. After 90 min, cells were moved out of the chamber, and the glucose‐free medium was replaced with original regular medium, in which the cells were cultured for another 24 h in normal CO2 incubator for re‐oxygenation.
siRNA‐Mediated Drp1 Knockdown
Cells were transfected with either siRNAs against Drp1 (sequence: siDrp1 #1 5′‐AAGCAGAAGAATGGGGTAAAT‐3′ and siDrp1 #2 5′‐GGAGCCAGCTAGATATTAA‐3′) or a scramble‐siRNA as control using Lipofectamine™ 2000. Forty‐eight hours after transfection, cells were harvested for experiments. The knockdown of Drp1 was confirmed with quantitative real‐time PCR and Western blotting using a specific Drp1 antibody (dilution 1:2000; BD Biosciences, San Jose, CA, USA).
Cell Injury and Viability Assays
Cell injury was assessed by measuring the concentration of lactate dehydrogenase (LDH) in the culture medium 17. Briefly, following OGD and the subsequent reoxygenation, the culture medium was removed. CytoTox 96® Cytotoxicity Assay kit was used to measure LDH in the culture medium and in the cell lysate. Data were presented as percentage of the maximal LDH release.
Cell viability was determined using 3‐(4, 5‐dimethylthiazole‐2‐yl)‐ 2,5‐dipenyltetrazolium bromide (MTT) assay. In brief, cells were incubated with MTT (0.5 mg/mL) for 4 h before the medium was removed and DMSO was added. The optical density values were measured with a microplate reader (Bio‐Rad) at the wavelengths of 570 nm and 630 nm.
Assessment of Mitochondrial Morphology
After being transfected with Mito‐DsRed and the subsequent culturing in OGD/reoxygenation conditions as described previously, cells were fixed with 4% paraformaldehyde and subjected to epifluorescence microscopy (Olympus, Japan). The size and shape of mitochondrial were quantified in a double‐blinded manner as previously described 18. Briefly, the number of cells with fragmented mitochondria was counted in 10–15 randomly chosen 200× microscopic fields, and the mitochondrial size and shape were quantified using the Image J software. Mitochondrial roundness was expressed as perimeter2/4π area, and mitochondrial aspect ratio was calculated as a ratio of major and minor axes.
Measurements of Mitochondrial Membrane Potential (Δψm)
Cells were collected and stained with 50 nm tetramethylrhodaminemethyl ester (TMRM) for 20 min at 37°C. Fluorescence signal was detected with flow cytometry. Cells treated with 20 μm carbonyl cyanide 4‐(trifluoromethoxy) phenylhydrazone to collapse Δψm were used set the threshold. Results were expressed as the percentage of cells with fluorescence signal above the threshold as previously described 18.
Measurement of ATP Production
To measure ATP production in cell culture, cells were subjected to OGD/reoxygenation before being rapidly frozen in liquid nitrogen. Ice‐cold 0.4 m perchloric acid was then added, and cells were scraped off. The cell lysate was centrifuged at 14,000 g for 15 min, and supernatant was neutralized with 1 m K2CO3. Following centrifugation, the supernatant was subjected to HPLC as described previously 18. To measure APT production in brain tissues, tissues from the MCAO model were homogenized in ice‐cold 0.4 m perchloric acid, and the homogenates were centrifuged at 14,000 g for 15 min. The supernatant was neutralized with 1 m K2CO3 and then centrifuged. Supernatants were subjected to HPLC as described previously.
Mitochondrial Isolation
Cells and brain tissues were fractionated using a Mitochondrial Isolation Kit according to the manufacturer's instruction (Pierce, Rockford, IL, USA). Briefly, cells and brain tissues were homogenized, and the homogenates were centrifuged at 750 g for 10 min at 4°C. The supernatant was centrifuged at 12,000 g for 15 min at 4°C, and the pellet was kept as mitochondrial fraction. The supernatant was further centrifuged at 100,000 g for 1 h, and the supernatant was kept as the cytosol fraction. Cyto c and Bax in different fractions were detected with immunoblot analysis using specific antibodies against cyto c or Bax (1:1000, BD bioscience,San Jose, CA, USA).
Immunoprecipitation of Active Bax
A specific antibody against the Bax NH2‐terminal sequence (anti‐Bax NT) was used to pull‐down active Bax. Briefly, the cell lysate containing 500 μg proteins was incubated with 1 μg anti‐Bax NT (Millipore, Billerica, MA, USA) in the presence of protein A/G agarose beads. After wash and centrifugation, the precipitated proteins were collected and subjected to immunoblot analysis.
Analysis of Bax Insertion and Oligomerization
After incubating the cells with 0.05% digitonin to permeabilize the cells, mitochondrial fraction was prepared as described above. To assess Bax insertion, the mitochondrial fraction was incubated with 0.1 m Na2CO3 for 30 min at pH 11.5, followed by centrifugation at 100,000 g for 1 h. The pellet was used to determine the inserted Bax, which was resistant to alkaline stripping. To assess Bax oligomerization, the mitochondrial fraction was incubated with 1 mm dithiobis[succinimidyl propionate] (DSP) (Pierce, Rockford, IL, USA) for 30 min, and the cross‐linked samples were subjected to immunoblot analysis.
Temporary Middle Cerebral Artery Occlusion (MCAO) Stroke Model
Focal cerebral ischemia was induced in mice by transient occlusion of the right MCA, using the intraluminal filament placement technique as described previously 19, 20. Briefly, mice were anesthetized with ketamine/xylazine. Body temperature was kept at 37°C. To monitor regional cerebral blood flow (rCBF), a laser Doppler probe was fixed to the skull at 2 mm posterior and 4 mm lateral to bregma and connected to a laser Doppler flow meter (Periflux System 5000, Perimed). A filament composed of a 6‐0 polydioxanone suture (PSD II, Ethicon, Norderstedt, Germany) and a silicone tip with a diameter of 225–275 mm (adapted to the age of the animal) was inserted into the external carotid artery and advanced into the common carotid artery. The filament was retracted, moved into the internal carotid artery, and advanced until the origin of the MCA, given by the sudden drop in rCBF. After 45 min, the filament was withdrawn and reperfusion was observed. The animals were placed in a heating box at 37°C for the first 2 h after surgery and thereafter transferred into a heating box at 351C (overnight). The infarct volume was measured 72 h after the surgery using 2,3,5‐triphenyltetrazolium chloride (TTC). Only those mice in which rCBF below 25% of baseline was achieved and with a return to > 80% after reperfusion were included. Infarct volume was calculated as described before 19, 20. Neurological score was also evaluated 72 h after MCAO as described previously 21, 22. In a subset of experiments, blood cell count, BP, pH, and blood oxygen saturation were monitored.
Assessment of Blood–Brain Barrier and Brain Water Content
Seventy‐two hours after MCAO, 2% Evans blue (EB) solution in 0.1 m PBS was slowly injected into the jugular vein (4 mL/kg) and let circulate for 20–22 h. Trunk blood and brain tissue from injured and matching contralateral regions were collected and flash‐frozen. EB was extracted by incubating plasma or tissue samples with 50% TCA solution (1:3), spinning at 10,000× and incubating in ethanol (1:3). Fluorescence (620 nm) was measured using a multiplate reader (Synergy, BioTek) equipped with a K4 Software and calibration curve. The fluorescence intensities were normalized to wet tissue weight. 23.
Terminal Deoxynucleotidyl Transferase‐Mediated Biotinylated UTP Nick end Labeling (TUNEL) Assay
Animals were sacrificed 72 h after the MCAO. Brains were frozen on dry ice and stored at −80°C until 15 μm coronal sections were cut on a cryostat. Brain sections were mounted on slides and stored at −80°C until they were processed for HE or TUNEL staining. One slide of sections (a slide adjacent to that taken for H&E staining, two sections per slide) was taken from within the test zone of each animal. TUNEL was performed using Apop Tag kit (Intergen, Purchase, NY, USA) according to the manufacturer's instruction. Briefly, the sections were fixed for 5 min in 4% paraformaldehyde. Sections underwent two washes in PBS and were incubated in permeabilization solution (0.1% Triton X‐100 and 0.1% sodium citrate) for 30 min at 70°C. Sections were then washed twice in PBS followed by incubation for 60 min at 37°C in “TUNEL reaction mix” from the Apop Tag kit. Sections underwent two more washes in PBS and were then immersed in Hoechst 33258 (Molecular Probes, Eugene, OR) solution (1:1000 dilution) for 10 min. Sections were finally rinsed in distilled water and coverslipped with antifade mounting medium. A positive control was performed by incubating slides for 60 min at 37°C in RQ–DNase solution (2 μL of RQ1 RNase‐free DNase; catalog number M6101; Promega Madison, WI, USA) before incubation in TUNEL reaction mix. A negative control was performed by incubating sections in reaction mix that contained only label solution and no TUNEL enzyme components. All areas of the brain exhibited TUNEL staining in the positive control slide. No cellular staining was observed in the negative control slide. TUNEL‐positive cells were counted in 20× microscope fields within frontal cortices (three fields per section) and parietal cortices (four fields per section) from a single section for each animal using an object counts array via BioQuant (Oxford, UK) software. Counts for all seven microscope fields were summed to yield a single cell count for each animal 24, 25.
Electron Microscopy
Animals were sacrificed 72 h after the MCAO. Mice were perfused with 2% paraformaldehyde/2% glutaraldehyde buffered with 0.1 m phosphate buffer, pH 7.2. Brains were removed and postfixed with 1% OsO4 in the same buffer containing 7.5% sucrose at 4°C for 2 h followed by dehydration with a graded series of ethanol and embedded in Epon 812. Serial ultrathin sections were cut with the ultramicrotome and examined with a Hitachi H‐7100 (Hitachi, Tokyo, Japan) electron microscope. The mitochondrial size and shape were quantified using software Image pro plus in a double‐blinded manner.
Statistical Analysis
The results are expressed as mean ± standard deviation (SD). Differences were analyzed using one‐way or two‐way ANOVA followed by Newman–Keuls post hoc testing. A level of P < 0.05 was considered significant.
Results
Knockdown or Inhibition of Drp1‐Attenuated OGD‐Induced Death of SH‐SY‐5Y Cells
To examine the role of Drp1 in ischemic injury, we generated an OGD/reoxgeneration model using SH‐SY‐5Y cells and examined the effect of either Drp1 knockdown with a specific siRNA or expression of a dominant‐negative mutant of Drp1 (Drp1K38A) on the survival of SH‐SY‐5Y cells The RNA interference (RNAi) of Drp1 significantly reduced Drp1 mRNA and protein levels over 80% in the SH‐SY‐5Y cells (Figure 1 ). Drp1 RNAi or overexpression of Drp1K38A significantly decreased OGD‐induced cell death (Figure 1D and E). To further evaluate the role of Drp1 in ischemic cell death, a small molecule inhibitor of Drp1, Mitochondrial Division Inhibitor (Mdivi‐1) 26, was used. We observed that OGD‐induced cell death was markedly reversed by this molecule in a dose‐dependent manner, with an optimal concentration at 10 μm (Figure 1F and G).
Figure 1.
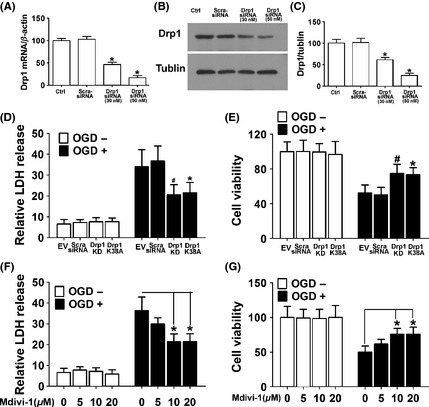
OGD‐induced death ofSH‐SY‐5Y cells was inhibited by Drp1 knockdown, overexpression of dominant‐negative Drp1 mutant, and a pharmacological inhibitor of Drp1. (A) Quantitative real‐time RT‐PCR showed that Drp1 was knocked down with the specific siRNA. (B) Representative immunoblots of Drp1 showed knockdown of Drp1 by the specific Drp1 siRNA in a dose‐dependent manner. (C) Densitometric quantification of Drp1 immunoblots in SH‐SY‐5Y cells transfected with scramble‐siRNA or Drp1‐specific siRNA. (D) SH‐SY‐5Y cells were subjected to OGD and LDH released was measured. (E) Cell viability was assessed with MTT assay. Data are mean ± SD from six independent experiments. *P < 0.05 vs. empty vector, # P < 0.05 vs. scramble‐siRNA group. (F) SH‐SY‐5Y cells pretreated with different concentrations of Mdivi‐1 indicated were subjected to OGD and LDH released was measured. (G) Cell viability was assessed with MTT assay. Data are mean ± SD from six independent experiments. *P < 0.05 vs. vehicle‐treated control.
Knockdown or Inhibition of Drp1‐Protected Both Functional and Structural Integrity of Mitochondria in Response to OGD
Drp1 can induce excessive mitochondrial fragmentation, mitochondrial dysfunction even cell death. Inhibition of Drp1 improves mitochondrial morphology and subsequent mitochondrial functions 27, 28, 29. Using DsRed‐Mito to label mitochondria, we observed that while the normal cells displayed tubular and long mitochondria (Figure 2A), indicating a balance between mitochondrial fusion and fission, severe mitochondrial fragmentation was observed after OGD/reoxgeneration procedure. Intriguingly, both Drp1 RNAi and Mdivi‐1 treatment (10 μm) dramatically attenuated the mitochondrial fragmentation (Figure 2A). Quantitative analysis demonstrated that there was a higher proportion of longer and tubular mitochondria in the cells treated with either Drp1 siRNA (Figure 2, B–D) or Mdivi‐1(Figure 2E–G) compared with the vehicle‐treated cells.
Figure 2.
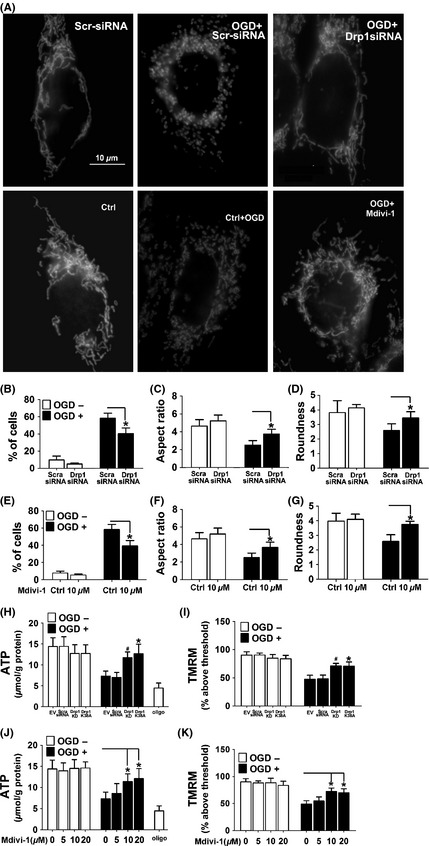
Mdivi‐1 reversed the morphological and functional changes of mitochondria induced by OGD. (A) SH‐SY‐5Y cells were transfected with Drp1 siRNA (upper panel) or pretreated with Mdivi‐1 (lower panel) before being labeled with Mito Ds‐Red. Shown are representative images. Scale bars = 10 μm. (B,E) Percentage of cells with truncated or fragmented mitochondria in cells treated with Drp1 RNAi or Mdivi‐1. Quantification was performed in a blinded manner from more than 200 cells in 10 randomly chosen 200× microscopic fields in three independent experiments. (C,D,F,G) Quantification of different morphological mitochondria from the cells with different treatments was indicated. Data are mean ± SD from 10 to 15 randomly selected cells in three independent experiments, P < 0.05 vs. scramble‐siRNA or vehicle‐treated control. (H,J) Cellular ATP levels were assessed by HPLC. (I,K) SH‐SY‐5Y cells were subjected to OGD and mitochondrial membrane potential (Δψm) was measured using the fluorescent cationic dye TMRM. Data are mean ± SD from six independent experiments. *P < 0.05 vs. empty vector, # P < 0.05 vs. scramble‐siRNA group (H,I), *P < 0.05 vs. vehicle‐treated control (J,K).
To examine whether Drp1 inhibition exerts its neuroprotective effect through modulating the function of mitochondria, HPLC and TMRM staining were used to measure the ATP levels and mitochondrial membrane potential (Δψm) as previously described 18. The inhibitor of the electron transport chain complex V oligomycin was used as positive control. While approximately 36% reduction in ATP was observed after OGD procedure, this metabolic deficit was partially abolished by Drp1 RNAi, overexpression of dominant‐negative Drp1 (Drp1‐K38A) or Mdivi‐1 treatment (Figure 2H and J). Moreover, the collapse of mitochondrial membrane potential (Δψm) induced by OGD was also rescued by Drp1 RNAi, overexpression of dominant‐negative Drp1(Drp1‐K38A) or mdivi‐1 treatment (Figure 2I and K).
Knockdown or Inhibition of Drp1‐Blocked OGD‐Induced Bax Insertion and Oligomerization and the Subsequent MOM Permeabilization
Based on the previous findings that Drp1 stimulates tBid‐induced Bax oligomerization through promoting membrane hemifusion and tethering 14, 26, 30, 31, we attempted to examine whether Drp1 RNAi or Mdivi‐1 affects Bax insertion and oligomerization in response to OGD. The experiment was performed as described previously 32, 33. As shown in Figure 3, significant amount of Bax remained in the mitochondria of the OGD‐treated cells, indicating Bax insertion into mitochondria membrane. Interestingly, OGD‐induced Bax insertion was partially blocked by either Drp1 RNAi or Mdivi‐1 treatment.
Figure 3.
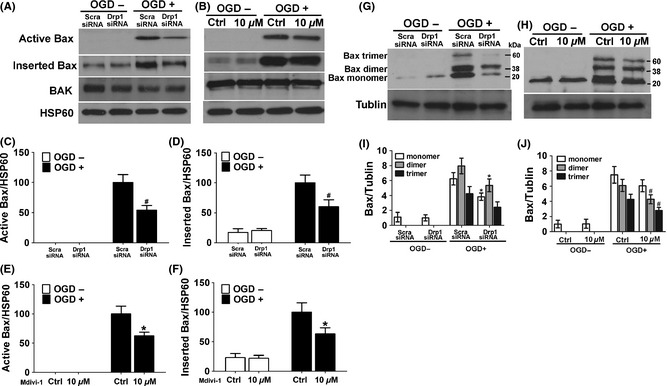
Drp1 knockdown or inhibition with Mdivi‐1 suppressed Bax activation, insertion, and oligomerization in mitochondria after OGD. (A,B) Active and inserted Bax were analyzed as described. (C,D) Densitometric quantification of active Bax (C) and inserted Bax (D) in SH‐SY‐5Y cells transfected with a scramble‐siRNA or Drp1‐siRNA in response to OGD. (E and F) Densitometric quantification of active Bax (E) and inserted Bax (F) in SH‐SY‐5Y cells treated with or without Mdivi‐1 in response to OGD. (G,H) Cross‐linking and Bax immunoblot analysis were performed to analysis Bax oligomerization. Shown are representative blots from six independent experiments with similar results. (I) Densitometric quantification of the immunoblots of Bax dimer and trimer in SH‐SY‐5Y cells transfected with scramble‐siRNA or Drp1 specific siRNA as described above. (J) Densitometric quantification of the immunoblots of Bax dimer and trimer in SH‐SY‐5Y cells treated with or without Mdivi‐1 as described above. Data are mean ± SD from three independent experiments. *P < 0.05 compared with scramble‐siRNA group. # P < 0.05 compared with vehicle‐treated control.
We further analyzed Bax oligomerization after chemical cross‐linking. As shown in Figure 3G and I, OGD‐induced formation of Bax dimer and trimer in the scramble‐siRNA transfected cells. In contrast, both Drp1 RNAi and Mdivi‐1 treatment robustly prevented OGD‐induced Bax dimer and trimer formation (Figure 3H and J).
To determine whether inhibition of Drp1 suppresses mitochondrial outer membrane leakage and the subsequent release of apoptogenic factors, cyto C release in response to OGD was examined. As shown in Figure 4A and B, knockdown of Drp1 or inhibition of Drp1 with Mdivi‐1 resulted in marked reduction of cyto C in the cytosol, associated with a marked increase of cyto C in the mitochondrial fraction in response to OGD. Quantitative results confirmed that Drp1 RNAi or inhibition with Mdivi‐1 significantly prevented the membrane integration and suppressed the efflux of cyto C in response to OGD (Figure 4C–F).
Figure 4.
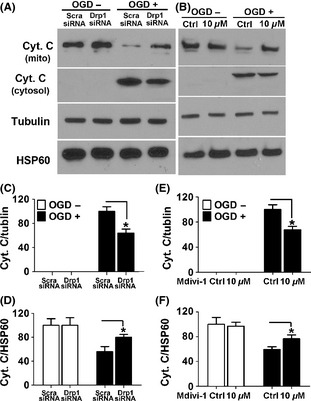
Drp1 knockdown or inhibition with Mdivi‐1 blocked OGD‐induced cyto c release. (A,B) Levels of cyto C in the mitochondrial and cytosol fractions were assessed with immunoblotting. The membranes were stripped and reprobed with antibodies against tubulin or HSP60 as loading controls. (C–F) Densitometric quantification of cyto C in the cytosol (C,E) and mitochondrial fraction (D,F) in SH‐SY‐5Y cells with the indicated treatments. Data are mean ± SD from three independent experiments. *P < 0.05 compared with scramble‐siRNA group (C,D). *P < 0.05 compared with vehicle‐treated control (E,F).
Inhibition of Drp1‐Attenuated Ischemic Brain Damage In Vivo
To examine whether the Drp1‐specific inhibitor Mdivi‐1 protects neurons in ischemic stroke model, MCAO mice were treated with different doses of mdivi‐1 and brain injury was measured. Animals treated with vehicle were used as control. Mdivi‐1 treatment remarkably reduced the infarct volume and neurololgical deficits in a dose‐dependent manner (Figure 5A, B). The BBB integrity and brain edema extent were also detected as described previously 23. We observed that Mdivi‐1 treatment dramatically reduced Evans blue leakage provoked by MCAO (Figure 5C), suggesting protection of blood–brain barrier integrity by this compound. Consistently, Mdivi‐1 also significantly decreased the brain edema following the ischemic damage (Figure 5D). As Mdivi‐1 was seldomly used at this dose in vivo, a subset of mice was injected with Mdivi‐1 and physiological state was measured. The results showed that Mdivi‐1 treatment had no significant influence on blood oxygen saturation, BP, pH, or blood cell count. (Table 1).
Figure 5.
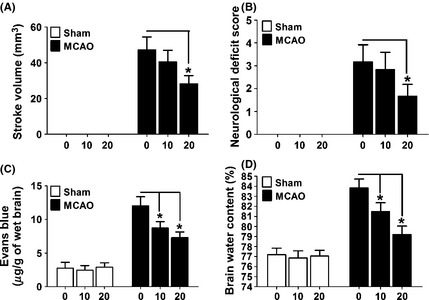
Mdivi‐1 protected the animal from ischemic damage. (A) Control (sham‐operated) or MCAO mice (n = 7 to 8 mice in each group) were treated with different doses of Mdivi‐1 and infarct volume was assessed. (B) Sham or MCAO mice (n = 7 to 8 mice in each group) were treated with different doses of Mdivi‐1 and neurological score was assessed. (C) Sham or MCAO mice (n = 6 to 9 mice in each group) were treated with different doses of Mdivi‐1 and blood–brain barrier integrity was assessed with Evans blue staining. (D) Sham or MCAO mice (n = 6 to 9 mice in each group) were treated with different doses of Mdivi‐1 and brain water was assessed. All data are mean ± SD. *P < 0.05 compared with vehicle‐treated control.
Table 1.
Physiological parameters of mice treated with 20 mg/kg Mdivi‐1 (n = 6)
| pH | PCO2 (mmHg) | PO2 (mmHg) | HCO3 (mm) | WBC | HGB | Bp (mmHg) | |
|---|---|---|---|---|---|---|---|
| Ctrl | 7.30 ± 0.02 | 40.0 ± 4.4 | 156 ± 12.4 | 19.1 ± 1.6 | 6.3 ± 0.8 | 15.2 ± 0.8 | 106 ± 7.7 |
| Mdivi‐1 | 7.31 ± 0.01 | 42.5 ± 4.5 | 156 ± 9.7 | 19.9 ± 1.9 | 6.4 ± 0.7 | 15.3 ± 1.2 | 111 ± 9.1 |
BP, blood pressure; HGB, hemoglobin; WBC, white blood cell count.
Inhibition of Drp1 Decreased Mitochondrial Permeability and Apoptosis‐Induced by Ischemic Damage
Based on the neuroprotective effect of the Mdivi‐1 in the OGD model, we attempted to examine whether Drp1‐mediated apoptotic pathways may play a role in ischemic brain damage. We observed that there were significantly fewer TUNEL‐positive cells in Mdivi‐1 treated mice compared with that in the vehicle group (Figure 6A,B). We also measured Bax expression in the cytosol and mitochondrial fractions using Western blot analysis. We observed that there was an obvious accumulation of Bax in the mitochondrial fraction after ischemic damage in MCA territory, and Mdivi‐1 markedly decreased the expression of Bax in the mitochondrial fraction (Figure 6C,F,G), suggesting inhibition of Bax translocation from cytosol to mitochondria by Midivi‐1. In line with these results, cytosolic cyto C levels were dramatically suppressed by Mdivi‐1 in the MCAO model (Figure 6C–E).
Figure 6.
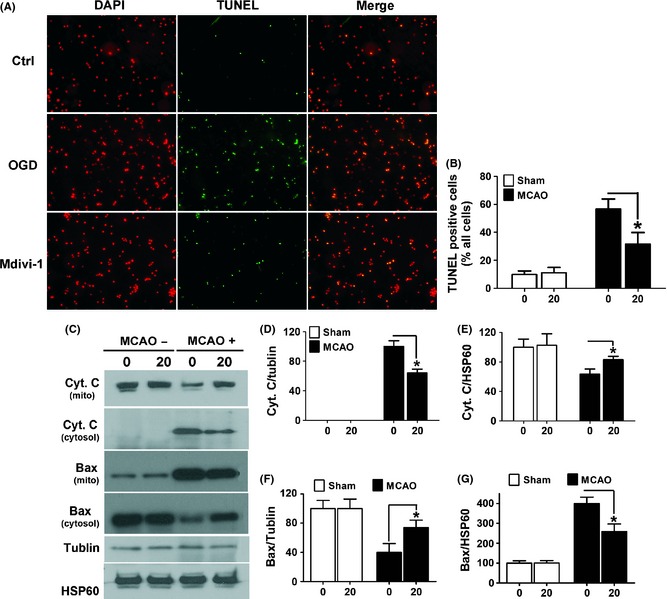
Mdivi‐1 attenuated ischemia‐induced cell apoptosis in the brain. (A) Mice (n = 6 per group) without (sham) or with MCAO surgery were treated with Mdivi‐1 (20 mg/kg). Brain sections (10 μm) were stained with TUNEL and counterstained with DAPI for the visualization of nuclei. Shown are representative confocal images. Scale bars = 10 μm. (B) Quantification of the percentage of TUNEL‐positive cells in sham and MCAO mice treated with or without Mdivi‐1. Data are mean ± SD. *P < 0.05 compared with vehicle‐treated control. (C) Bax and Cyto C levels in the mitochondria and cytosol fractions were assessed with immunoblotting. (D,E) Quantification of the percentage of cyto C in the cytosol and mitochondrial fractions. (F,G) Quantification of the percentage of Bax in the cytosol and mitochondrial fractions in sham and MCAO mice treated with or without Mdivi‐1. Data are mean ± SD. *P < 0.05 compared with vehicle‐treated control.
Midiv‐1 Improved Mitochondrial Morphology and Function After Ischemic Damage
To examine the effect of Mdivi‐1 treatment on the mitochondrial morphology in the MCAO mouse model, electron microscopy was performed. As shown in Figure 7A, ischemia induced a dramatic mitochondrial fragmentation in the MCAO model. Interestingly, the mitochondrial fragmentation was markedly reduced by the treatment with Mdivi‐1. To compare mitochondrial morphology more objectively, quantitative analysis was performed. As shown in Figure 7B–D, MCAO induced a dramatic mitochondrial fragmentation, which was restored by Mdivi‐1 treatment. Compared with the control group, there was a significant increase in the proportion of elongated mitochondria in the Mdivi‐1‐treated group.
Figure 7.
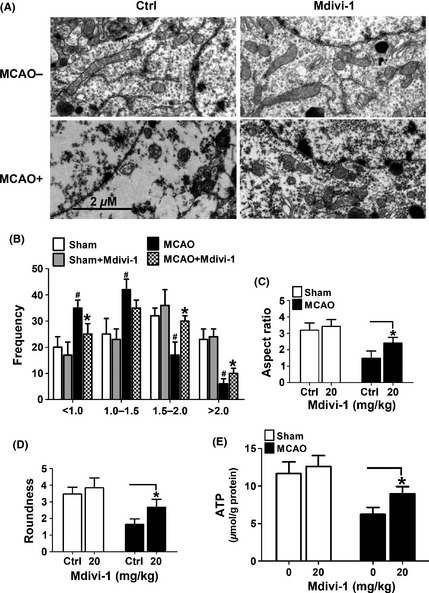
Mdivi‐1 prevented mitochondrial fragmentation and promote ATP production after MCAO. (A) Mice (n = 4 per group) without (sham) or with MCAO surgery were treated with Mdivi‐1 (20 mg/kg). Brain sections were subjected to electron microscopy to visualize mitochondrial ultra‐structures. Shown are representative images. Scale bars = 2 μm. (B–D) Quantitation of mitochondrial perimeter, aspect ratio, and roundness was performed. Data are mean ± SD of four animals with 50 clearly identifiable mitochondria randomly selected per mouse. (E) Mice (n = 6–9 mice per group) without (sham) or with MCAO surgery were treated with Mdivi‐1 (20 mg/kg). ATP levels in the ischemic region in the MCAO mice or in the counterpart of the sham mice were measured with HPLC. Data represent mean ± SD. *P < 0.05 vs. vehicle‐treated control, # P < 0.05 vs. sham group.
We also examined whether Mdivi‐1 treatment affect ATP production in the MCAO model. ATP production in the MCAO territory was detected by HPLC. As shown in Figure 7E, the metabolic deficit induced by MCAO was partially abolished by Mdivi‐1 treatment (Figure 7E). These results suggest that the neuroprotective effects of Mdivi‐1 on stroke animal model may be attributable to its functions of maintaining both structural and functional integrity of mitochondria.
Discussion
In the present study, we examined the effect of blocking Drp1 on the overall excessive fission of mitochondria caused by acute ischemic brain damage both in vivo and in vitro. Blocking Drp1 activity with either pharmacological or genetic approach significantly prevented cell death and rebuilt the balance of mitochondrial fission and fusion in MCAO model. Our results are consistent with the previous findings that blocking mitochondrial fission or enhancing mitochondrial fusion is protective in animal models of renal or myocardial ischemia and various neurodegenerative disorders 29, 34, 35. Thus, targeting this pathway may be a potential therapeutic approach for ischemia injuries 29, 34, 36. Emerging evidences have suggested an important role of mitochondrial fission in mitochondrial apoptotic pathways 14, 26, 28, 37. In the process of apoptosis, proteins confined to the mitochondrial intermembrane space are released as a result of increased mitochondrial outer membrane permeability (MOMP). A series of pro‐apoptotic proteins, including Bax, have been shown to increase MOMP 38, 39. Under normal conditions, Bax is inactive in cytosol and is soluble or loosely attached to mitochondria. However, in response to apoptotic stimuli 15, Bax is translocated and inserted into the outer membrane, undergoes oligomerization, thereby inducing MOMP. These rearrangements occur in the outer membrane and require a cooperation among Bax, BH3‐only proteins and the lipid bilayer 40, 41.
Several findings suggest that mitochondrial fission proteins including Drp1 42 may play a role in increasing MOMP and the subsequent cyto c release 15 under ischemic conditions. A recent study demonstrated that tBid could induce mitochondrial fragmentation and MOMP in a Drp1‐dependent manner in a glutamate‐induced oxidative stress model 10. However, it is unknown whether tBid directly interacts with Drp1. It has been proposed that the interplay between Bid and Drp1 may involve other Bcl‐2 proteins such as Bax. In line with this notion, our data demonstrate that inhibition of Drp1 with either Mdivi‐1 or Drp1 RNAi dramatically blocked Bax insertion, oligomerization and subsequent cyto c release both in vitro and in vivo.
The effects of manipulating mitochondrial dynamics on the mitochondrial function have not been fully illustrated in stroke animal models. Though a recent study showed that Mdivi‐1 prevented glutamate excitotoxicity in primary cultured neurons and reduced the infarct size in a cerebral ischemia model 10, mitochondrial morphology and functions were not evaluated in this study. In our previous study, we had reported the beneficial effect of inhibition of Drp1 in the protection against OGD neurons 43. However, we did not describe the underlying mechanism of this function, and the protective effect on ischemic animal models was not included in that study.
Using electronic microscopy, we observed that compared with the large proportion of smaller mitochondria in the MCAO mice treated with vehicle, there was a significant increased in the fraction of elongated mitochondria in the Mdivi‐1 treated group. Moreover, we observed that inhibition of Drp1 prevented ischemia‐induced collapse of mitochondrial membrane potential (Δψm) and bioenergetic defects, suggested that inhibition of Drp1 protects against ischemic damage by maintaining mitochondrial integrity and attenuating the functional deficits of mitochondria, including ATP release and Δψm reduction.
Taken together, we report that blocking the function of the mitochondrial fission protein Drp1 protected neurons against ischemic injury both in vitro and in vivo. Several possible mechanisms were proposed based on our observations. First, inhibition of Drp1 restores the balance between fission and fusion, thereby maintained mitochondrial structural integrity. Second, Drp1 inhibition prevents bioenergetic deficits induced by ischemic damage. Third, blocking the function of Drp1 decreases Bax oligomerization and the release of proapoptotic factors during ischemic damage.
Conclusion
The present study demonstrated that Drp1 inhibition not only attenuated OGD‐induced cell death, but also significantly reduced infarct volume and neuronal death in the MCAO mouse model. These effects were associated with a reversal of the morphological change of mitochondria and restoration of proper mitochondrial functions after ischemic injury. These effects may be attributable to its inhibition of Bax insertion to the mitochondrial outer membrane and oligomerization, and the subsequent release of cytochrome C.
Conflict of Interest
The authors have no conflict of interest.
Acknowledgements
This study was supported by National Natural Science Foundation of China 81000487 81171023 81271295 and Shanghai Rising‐Star Program (11QA1400900) and Shanghai Pujiang Program (12PJ1407200).
The first two authors contributed equally to this work.
References
- 1. Chan DC. Mitochondria: dynamic organelles in disease, aging, and development. Cell 2006;125:1241–1252. [DOI] [PubMed] [Google Scholar]
- 2. Chen H, McCaffery JM, Chan DC. Mitochondrial fusion protects against neurodegeneration in the cerebellum. Cell 2007;130:548–562. [DOI] [PubMed] [Google Scholar]
- 3. Jezek P, Plecita‐Hlavata L. Mitochondrial reticulum network dynamics in relation to oxidative stress, redox regulation, and hypoxia. Int J Biochem Cell Biol 2009;41:1790–1804. [DOI] [PubMed] [Google Scholar]
- 4. Grohm J, Plesnila N, Culmsee C. Bid mediates fission, membrane permeabilization and peri‐nuclear accumulation of mitochondria as a prerequisite for oxidative neuronal cell death. Brain Behav Immun 2010;24:831–838. [DOI] [PubMed] [Google Scholar]
- 5. Westermann B. Mitochondrial fusion and fission in cell life and death. Nat Rev Mol Cell Biol 2010;11:872–884. [DOI] [PubMed] [Google Scholar]
- 6. Cerveny KL, Tamura Y, Zhang Z, Jensen RE, Sesaki H. Regulation of mitochondrial fusion and division. Trends Cell Biol 2007;17:563–569. [DOI] [PubMed] [Google Scholar]
- 7. Detmer SA, Chan DC. Complementation between mouse Mfn1 and Mfn2 protects mitochondrial fusion defects caused by CMT2A disease mutations. J Cell Biol 2007;176:405–414. [DOI] [PMC free article] [PubMed] [Google Scholar]
- 8. Hoppins S, Lackner L, Nunnari J. The machines that divide and fuse mitochondria. Annu Rev Biochem 2007;76:751–780. [DOI] [PubMed] [Google Scholar]
- 9. Song W, Chen J, Petrilli A, et al. Mutant huntingtin binds the mitochondrial fission GTPase dynamin‐related protein‐1 and increases its enzymatic activity. Nat Med 2011;17:377–382. [DOI] [PMC free article] [PubMed] [Google Scholar]
- 10. Grohm J, Kim SW, Mamrak U, et al. Inhibition of Drp1 provides neuroprotection in vitro and in vivo. Cell Death Differ 2012;19:1446–1458. [DOI] [PMC free article] [PubMed] [Google Scholar]
- 11. Brooks C, Wei Q, Feng L, et al. Bak regulates mitochondrial morphology and pathology during apoptosis by interacting with mitofusins. Proc Natl Acad Sci USA 2007;104:11649–11654. [DOI] [PMC free article] [PubMed] [Google Scholar]
- 12. Sheridan C, Martin SJ. Mitochondrial fission/fusion dynamics and apoptosis. Mitochondrion 2010;10:640–648. [DOI] [PubMed] [Google Scholar]
- 13. Chen CH, Jiang Z, Yan JH, et al. The involvement of programmed cell death 5 (PDCD5) in the regulation of apoptosis in cerebral ischemia/reperfusion injury. CNS Neurosci Ther 2013;19:566–576. [DOI] [PMC free article] [PubMed] [Google Scholar]
- 14. Montessuit S, Somasekharan SP, Terrones O, et al. Membrane remodeling induced by the dynamin‐related protein Drp1 stimulates Bax oligomerization. Cell 2010;142:889–901. [DOI] [PMC free article] [PubMed] [Google Scholar]
- 15. Youle RJ, Strasser A. The BCL‐2 protein family: opposing activities that mediate cell death. Nat Rev Mol Cell Biol 2008;9:47–59. [DOI] [PubMed] [Google Scholar]
- 16. Zhao AP, Dong YF, Liu W, Gu J, Sun XL. Nicorandil inhibits inflammasome activation and toll‐like receptor‐4 signal transduction to protect against oxygen‐glucose deprivation‐induced inflammation in BV‐2 cells. CNS Neurosci Ther 2014;20:147–153. [DOI] [PMC free article] [PubMed] [Google Scholar]
- 17. Koh JY, Choi DW. Quantitative determination of glutamate mediated cortical neuronal injury in cell culture by lactate dehydrogenase efflux assay. J Neurosci Methods 1987;20:83–90. [DOI] [PubMed] [Google Scholar]
- 18. Cui M, Tang X, Christian WV, Yoon Y, Tieu K. Perturbations in mitochondrial dynamics induced by human mutant PINK1 can be rescued by the mitochondrial division inhibitor mdivi‐1. J Biol Chem 2010;285:11740–11752. [DOI] [PMC free article] [PubMed] [Google Scholar]
- 19. Lin TN, He YY, Wu G, Khan M, Hsu CY. Effect of brain edema on infarct volume in a focal cerebral ischemia model in rats. Stroke 1993;24:117–121. [DOI] [PubMed] [Google Scholar]
- 20. Shan LY, Li JZ, Zu LY, et al. Platelet‐derived microparticles are implicated in remote ischemia conditioning in a rat model of cerebral infarction. CNS Neurosci Ther 2013;19:917–925. [DOI] [PMC free article] [PubMed] [Google Scholar]
- 21. Li X, Blizzard KK, Zeng Z, DeVries AC, Hurn PD, McCullough LD. Chronic behavioral testing after focal ischemia in the mouse: functional recovery and the effects of gender. Exp Neurol 2004;187:94–104. [DOI] [PubMed] [Google Scholar]
- 22. Agrawal HC, Davis JM, Himwich WA. Water content of dog brain parts in relation to maturation of the brain. Am J Physiol 1968;215:846–848. [DOI] [PubMed] [Google Scholar]
- 23. Tang Y, Wu P, Su J, Xiang J, Cai D, Dong Q. Effects of Aquaporin‐4 on edema formation following intracerebral hemorrhage. Exp Neurol 2010;223:485–495. [DOI] [PubMed] [Google Scholar]
- 24. Tang Y, Shao Y, Su J, et al. The protein therapy of kallikrein in cerebral ischemic reperfusion injury. Curr Med Chem 2009;16:4502–4510. [DOI] [PubMed] [Google Scholar]
- 25. Liu XR, Luo M, Yan F, et al. Ischemic postconditioning diminishes matrix metalloproteinase 9 expression and attenuates loss of the extracellular matrix proteins in rats following middle cerebral artery occlusion and reperfusion. CNS Neurosci Ther 2012;18:855–863. [DOI] [PMC free article] [PubMed] [Google Scholar]
- 26. Cassidy‐Stone A, Chipuk JE, Ingerman E, et al. Chemical inhibition of the mitochondrial division dynamin reveals its role in Bax/Bak‐dependent mitochondrial outer membrane permeabilization. Dev Cell 2008;14:193–204. [DOI] [PMC free article] [PubMed] [Google Scholar]
- 27. Cereghetti GM, Costa V, Scorrano L. Inhibition of Drp1‐dependent mitochondrial fragmentation and apoptosis by a polypeptide antagonist of calcineurin. Cell Death Differ 2010;17:1785–1794. [DOI] [PMC free article] [PubMed] [Google Scholar]
- 28. Frank S, Gaume B, Bergmann‐Leitner ES, et al. The role of dynamin‐related protein 1, a mediator of mitochondrial fission, in apoptosis. Dev Cell 2001;1:515–525. [DOI] [PubMed] [Google Scholar]
- 29. Knott AB, Bossy‐Wetzel E. Impairing the mitochondrial fission and fusion balance: a new mechanism of neurodegeneration. Ann N Y Acad Sci 2008;1147:283–292. [DOI] [PMC free article] [PubMed] [Google Scholar]
- 30. Brooks C, Dong Z. Regulation of mitochondrial morphological dynamics during apoptosis by Bcl‐2 family proteins: a key in Bak? Cell Cycle 2007;6:3043–3047. [DOI] [PubMed] [Google Scholar]
- 31. Ishihara N, Nomura M, Jofuku A, et al. Mitochondrial fission factor Drp1 is essential for embryonic development and synapse formation in mice. Nat Cell Biol 2009;11:958–966. [DOI] [PubMed] [Google Scholar]
- 32. Deckwerth TL, Elliott JL, Knudson CM, Johnson EM Jr, Snider WD, Korsmeyer SJ. BAX is required for neuronal death after trophic factor deprivation and during development. Neuron 1996;17:401–411. [DOI] [PubMed] [Google Scholar]
- 33. Desagher S, Osen‐Sand A, Nichols A, et al. Bid‐induced conformational change of Bax is responsible for mitochondrial cytochrome c release during apoptosis. J Cell Biol 1999;144:891–901. [DOI] [PMC free article] [PubMed] [Google Scholar]
- 34. Lackner LL, Nunnari JM. The molecular mechanism and cellular functions of mitochondrial division. Biochim Biophys Acta 2009;1792:1138–1144. [DOI] [PMC free article] [PubMed] [Google Scholar]
- 35. Ong SB, Subrayan S, Lim SY, Yellon DM, Davidson SM, Hausenloy DJ. Inhibiting mitochondrial fission protects the heart against ischemia/reperfusion injury. Circulation 2010;121:2012–2022. [DOI] [PubMed] [Google Scholar]
- 36. Zhu M, Li WW, Lu CZ. Histone decacetylase inhibitors prevent mitochondrial fragmentation and elicit early neuroprotection against MPP+. CNS Neurosci Ther 2014;20:308–316. [DOI] [PMC free article] [PubMed] [Google Scholar]
- 37. Uo T, Dworzak J, Kinoshita C, et al. Drp1 levels constitutively regulate mitochondrial dynamics and cell survival in cortical neurons. Exp Neurol 2009;218:274–285. [DOI] [PMC free article] [PubMed] [Google Scholar]
- 38. Schinzel A, Kaufmann T, Schuler M, Martinalbo J, Grubb D, Borner C. Conformational control of Bax localization and apoptotic activity by Pro168. J Cell Biol 2004;164:1021–1032. [DOI] [PMC free article] [PubMed] [Google Scholar]
- 39. Guo F, Jin WL, Li LY, et al. M9, a novel region of amino‐Nogo‐A, attenuates cerebral ischemic injury by inhibiting NADPH oxidase‐derived superoxide production in mice. CNS Neurosci Ther 2013;19:319–328. [DOI] [PMC free article] [PubMed] [Google Scholar]
- 40. Lucken‐Ardjomande S, Martinou JC. Newcomers in the process of mitochondrial permeabilization. J Cell Sci 2005;118:473–483. [DOI] [PubMed] [Google Scholar]
- 41. Zhang TL, Fu JL, Geng Z, Yang JJ, Sun XJ. The neuroprotective effect of losartan through inhibiting AT1/ASK1/MKK4/JNK3 pathway following cerebral I/R in rat hippocampal CA1 region. CNS Neurosci Ther 2012;18:981–987. [DOI] [PMC free article] [PubMed] [Google Scholar]
- 42. Heymann JA, Hinshaw JE. Dynamins at a glance. J Cell Sci 2009;122:3427–3431. [DOI] [PMC free article] [PubMed] [Google Scholar]
- 43. Zhao Y, Chen F, Chen S, Liu X, Cui M, Dong Q. The Parkinson's disease‐associated gene PINK1 protects neurons from ischemic damage by decreasing mitochondrial translocation of the fission promoter Drp1. J Neurochem 2013;127:711–722. [DOI] [PubMed] [Google Scholar]