

Summary
Introduction
Glucose variation is an important risk factor for the complications of diabetes mellitus. The plasma glucose level poststroke is in continuous fluctuation. However, whether the variation influences neurological improvement remains unknown.
Aims
This observational study aimed to investigate the association of glucose variation with neurological improvement poststroke.
Methods
We consecutively enrolled 216 ischemic stroke patients with no history of diabetes mellitus within 72 h of onset, with instant blood glucose <11.1 mmol/L at admission. The glucometabolic status was evaluated by an oral glucose tolerance test 1 day after admission and 14 days after stroke, respectively. The severity of neurological deficit was assessed with the National Institute of Health Stroke Scale (NIHSS).
Results
Fourteen days after stroke, 31% patients were found to have impaired glucose tolerance and 30.6% were newly diagnosed diabetes mellitus by oral glucose tolerance test. A higher level of instant blood glucose at admission or fasting plasma glucose (FPG) at 1 day correlated with a less neurological improvement. The number of patients with no <20% decrease in NIHSS was significantly decreased in patient group with higher than 30% variation of either FPG or 2‐h postprandial glucose. Similar correlation between glucose variation and neurological improvement was also found in 117 patients with 2‐h postprandial glucose ≥7.8 mmol/L at 1 day.
Conclusions
Inordinate glucose variation correlated with less neurological improvement poststroke, giving the evidence that the fluctuation of glucose levels in stroke patients should be taken into consideration during glucose modulation.
Keywords: Acute stroke, Glucose variation, Impaired glucose regulation, Poststroke hyperglycemia
Introduction
Poststroke hyperglycemia (PSH) is a frequent discovery in the majority of patients after stroke onset. About 6–42% of stroke patients with PSH had no previously diagnosed diabetes mellitus, which may be a stress reaction to ischemic insult or a sign of unrecognized diabetes mellitus 1, 2. Hyperglycemia is commonly associated with a worse neurological outcome 3, 4, 5, but rigorous continuous control of capillary glucose at 4–7 mmol/L within 24 h of stoke onset did not reduce the mortality and disability at 90 days in the UK Glucose Insulin in Stroke Trial (GIST‐UK) 6. The insufficiency of simply lowering the mean level of hyperglycemia may indicate the much complexity between glucose level and stroke outcome.
The blood glucose level poststroke is often in a condition of continuous variation due to stress response or medical intervention 7, 8. In the GIST‐UK, the mean level of glucose was 8.37 mmol/L at admission and declined with a natural variation to 6.5–7.0 mmol/L in the next 24 h 6.Thus, only one detection of glucose level at single time point is not capable for the full exploration of glucose fluctuation. On the other hand, variation of glucose has been proven as an important factor to the complications of diabetes mellitus despite of similar mean glucose levels, and higher variation of glucose was associated with further increased intima‐media thickness, more severe diabetic retinopathy, and higher cardiovascular mortality 8, 9, 10, 11. But the effect of poststroke glucose variation on neurological improvement remains unclear.
The aim of this study was to investigate the variation of glucose at acute phase poststroke, and its association with neurological improvement. We hypothesized that glucose variation other than the mean glucose value could influence neurological improvement after stroke.
Materials and methods
This observational study was part of a registered clinical project named ‘Abnormal glucose metabolism associated with acute ischemic stroke in South China’ (Chinese Clinical Trial Registration. URL: http://www.chictr.org. Unique identifier: ChiCTR‐ECS‐08000078). The study received approval from the local clinical trial committee at all participating hospitals in Guangdong Province, China. The study adhered to the ethical guidelines of the Helsinki Declaration (Edinburgh, 2000). After receiving information about the purpose of this study, all participants have signed informed consent statements that allowed access to their medical records and published these details.
A brief flow diagram for the enrollment of patients in the present study was shown in Figure 1. Total 10 teaching hospitals located in 4 dissociative cities in Guangdong Province, China, participated in this study. From January 1 until December 31, 2009, all adult patients with suspected acute stroke within 72 h of onset were consecutively admitted to neurological wards according to the following criteria: rapidly developing clinical symptoms or signs of focal disturbance of cerebral function, lasting at least 24 h. The diagnosis of ischemic stroke was further confirmed by computed tomography or magnetic resonance imaging. Patients with hemorrhagic stroke, history of type 1 or 2 diabetes mellitus, or instant blood glucose levels ≥ 11.1 mmol/L at admission, and patients who were unable to perform an oral glucose tolerance test (OGTT) due to unconsciousness, dysphagia, severe medical complications, or other unstable conditions were excluded from this study. Stroke subtypes were categorized in accordance with the Trial of ORG 10172 in Acute Stroke Treatment (TOAST) classification 12 and the Oxfordshire community stroke project (OCSP) classification 13. The National Institute of Health Stroke Scale (NIHSS) was used to assess the severity of neurological deficit.
Figure 1.
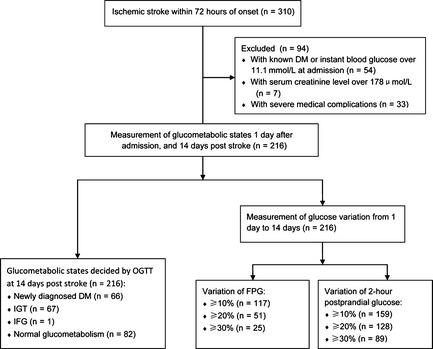
Enrollment of patients. Flow chart graph displaying that 216 patients with acute ischemic stroke were enrolled in measurement of glucometabolic states and glucose variation. DM, diabetes mellitus.
Case record form was used to collect demographic data, glucometabolic states, severity and subtypes of stroke, and past medical history (hypertension, previous stroke, coronary heart diseases, and dyslipidemia). Hypertension was defined as systolic blood pressure ≥ 140 mmHg, and/or diastolic blood pressure ≥ 90 mmHg, or with antihypertensive treatment at admission. Hyperlipidemia was defined as total cholesterol ≥ 5.2 mmol/L, and/or HDL‐cholesterol ≤ 0.9 mmol/L, and/or LDL‐cholesterol ≥ 3.12 mmol/L, and/or triglycerides ≥ 1.69 mmol/L, or with lipid‐lowering treatment at admission 14.
Glucometabolism States
In the next morning after hospital admission (1 day), a steamed bun containing approximately 80 g of complex carbohydrates, instead of standard hydrous glucose, was given to avoid the disadvantage of acute glucose burden to patients 15. At 14 days poststroke or at discharge, an standardized OGTT using 82.5 g hydrous glucose dissolved in 200 mL water was given according to the World Health Organization protocol 16. The safety of glucose exposure was considered before conducting OGTT. Blood samples were drawn before and 2 h after the glucose or carbohydrate load, and glucose concentrations were measured according to a routine hexokinase enzymatic method at local clinical biochemical laboratories, all of which have been successfully standardized and certificated for consistence. All enrolled patients were assessed, investigated, and treated at the discretion of physician‐in‐charge according to the usual medical practice.
The classification of glucometabolic states was based on fast plasma glucose (FPG) levels or OGTT results according to an updated diagnostic criteria 17. Normal glucose tolerance was defined as FPG < 6.1 mmol/L and 2‐h postprandial glucose level < 7.8 mmol/L, impaired fasting glucose (IFG) as FPG 6.1–6.9 mmol/L and 2‐h postprandial glucose level < 7.8 mmol/L, impaired glucose tolerance (IGT) as FPG < 7.0 mmol/L and 2‐h postprandial glucose level 7.8–11.1 mmol/L, and newly diagnosed type 2 diabetes mellitus as FPG ≥ 7.0 mmol/L or 2‐h postprandial glucose level ≥ 11.1 mmol/L.
Variation of Glucose
The relationship between variation of glucose and stroke severity at acute stage was assessed in this study. Variation of glucose was simplified to compute as a percentage of difference of glucose levels from 1 day to 14 days compared with that at 1 day based on the results of FPG or 2‐h postprandial glucose: |1–14 days|/1 day ×100%. Considering natural variation of glucose values in different time points 18, 19, we selected ordinal cutoff values of 10%, 20%, and 30% in variation of FPG and 2‐h postprandial glucose for analysis. To avoid the bias of baseline, a 20% decrease in NIHSS score from 1 day to 14 days was used to define neurological improvement, instead of single value of NIHSS score at 14 days 20, 21.
Statistical Analysis
All data were separately input by two persons to ensure accuracy and analyzed with SPSS software (Windows version 18.0; SPSS Inc., Chicago, IL, USA) in a blinded manner without knowledge of the group assignment. Missing data were excluded from statistical analysis. Numerical data were expressed as the mean ± standard deviation (SD), while ordinal data as median with 25 percentile and 75 percentile. Dichotomous variables were tested using chi‐square test and continuous variables using general linear models with repeated‐measures two‐way ANOVA to detect any intergroup differences and/or any variations between different time points. A two‐tailed P value of <0.05 or less denoted the presence of statistical difference.
Results
A total of 310 patients with acute ischemic stroke were collected in the study period, of whom 54 had previously diagnosed type 2 diabetes mellitus or admission instant blood glucose ≥11.1 mmol/L, 7 had high serum creatinine level (≥178 μmol/L), and 33 had no OGTT data at 14 days due to unconsciousness, severe dysphagia, or unstable conditions, leaving 216 patients for the study protocol. The median age of these patients was 69.0 (60.3–75.0) years, and the median time from clinical onset of symptoms to admission was 24.0 (11.0–48.0) hours. None died during hospital stay. Baseline clinical and experimental data at admission are summarized in Table 1.
Table 1.
Baseline characteristics of 216 patients at admission
| Value | |
|---|---|
| Male/Female | 125 (57.9%)/91 (42.1%) |
| Hypertension | 142 (65.7%) |
| Hyperlipidemia | 157 (72.7%) |
| Cardiovascular disease | 28 (13%) |
| TOAST classification | |
| Large‐artery atherosclerosis | 113 (52.3%) |
| Small‐artery occlusion | 83 (38.4%) |
| Cardioembolic infarction | 15 (6.9%) |
| Undetermined | 5 (2.3%) |
| OCSP classification | |
| Total anterior circulation infarcts | 23 (10.6%) |
| Partial anterior circulation infarcts | 125 (57.9%) |
| Lacunar infarcts | 29 (13.4%) |
| Posterior circulation infarcts | 39 (18.1%) |
| Body mass index (kg/m2) | 23.4 ± 2.8 |
| Instant blood glucose (mmol/L) | 6.8 ± 1.9 |
| FPG (mmol/L) | 5.7 ± 1.7 |
| HbA1c% (mmol/L) | 6.2 ± 1.5 (44 ± 7) |
| Homeostatic model assessment | 1.6 (1.1–2.7) |
| NIHSS | 7.8 ± 4.2 |
Data are numbers and percentages of patients, means ± SD, or medians (quartiles), as appropriate.
OGTT, oral glucose tolerance test; FPG, fasting plasma glucose; NIHSS, National Institute of Health Stroke Scale; TOAST, trial of ORG 10172 in acute stroke treatment.
Glucometabolic States
The glucometabolic states determined using the standardized OGTT (0 min and 2 h) were compared with that determined by using only the FPG (OGTT 0 min) at 14 days after stroke onset. The proportion of patients with abnormal glucose metabolism was substantially higher in combination with two plasma glucose values (Figure 2). Without the postload glucose values recognized by OGTT, many patients in newly diagnosed type 2 diabetes mellitus (40/216; 18.6%) and in IGT (67/216; 31.0%) groups would have remained undiagnosed. In total, over half of the patients (97/179; 54.2%) with normal FPG were diagnosed as different kinds of impaired glucose metabolism by OGTT. Differences in baseline characteristics in patients with NGT, IFG+IGT, or diabetes mellitus diagnosed by OGTT at 14 days after stroke onset were also recorded. Body mass index, FPG, 2‐h postprandial glucose, HbA1c, and HOMA values at 1 day were all significantly higher in patients with newly diagnosed diabetes mellitus than those with normal glucose metabolism (P < 0.01). There were no differences in severity and subtypes of stroke, age, sex, and past medical history among these three groups.
Figure 2.
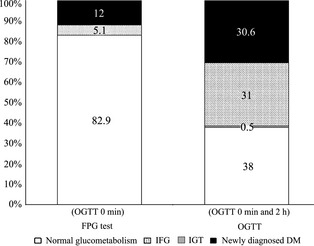
Glucometabolic states. Comparison of diagnostic groups in 216 patients according to the results of FPG test (OGTT 0 min) and OGTT (OGTT 0 min and 2 h) performed at 14 days after stroke onset.
Glucose Variation
The mean level of instant blood glucose at admission or FPG at 1 day was higher in patients without neurological improvement than in patients with neurological improvement at 14 days after stroke onset. The difference was significant (Table 2). In the enrolled 216 patients, the variation of FPG was ≥10% in 117 patients, ≥20% in 51 patients, and ≥30% in 25 patients, meanwhile, the variation of 2‐h postprandial glucose was ≥10% in 159 patients, ≥20% in 128 patients, and ≥30% in 89 patients. The FPG and 2‐h postprandial glucose variations of 10%, 20% did not make any differences to neurological improvement, but a <30% variation of glucose correlated with decreased neurological deficit compared with an over 30% variation (Table 3). Similar correlation between glucose variation and neurological improvement was also found in 117 patients with 2‐h postprandial glucose ≥7.8 mmol/L at 1 day, but not in the group <7.8 mmol/L (Table 4).
Table 2.
The glucose levels in groups with or without neurological improvement
| The level of glucose (mmol/L) | Patients with ≥20% decrease in NIHSS score (n = 166) | Patients with <20% decrease in NIHSS score (n = 50) | P |
|---|---|---|---|
| Instant blood glucose at admission | 6.6 ± 1.9 | 7.3 ± 1.8 | 0.029 |
| FPG at 1 day | 5.6 ± 1.4 | 6.3 ± 2.4 | 0.004 |
| 2‐h postprandial glucose at 1 day | 8.3 ± 2.9 | 8.9 ± 3.4 | 0.288 |
Data are means ± SD. NIHSS, National Institute of Health Stroke Scale; FPG, fasting plasma glucose.
Table 3.
Distribution of patients with or without 30% variation of glucose
| Variations from 1 day to 14 days poststroke | NIHSS score | Total | P | |
|---|---|---|---|---|
| ≥20% decrease | <20% decrease | |||
| FPG | ||||
| ≥30% | 15 (60.0) | 10 (40.0) | 25 | 0.034 |
| <30% | 151 (79.1) | 40 (20.9) | 191 | |
| Total | 166 | 50 | 216 | |
| 2‐h postprandial glucose | ||||
| ≥30% | 62 (69.7) | 27 (30.3) | 89 | 0.036 |
| <30% | 104 (81.9) | 23 (18.1) | 127 | |
| Total | 166 | 50 | 216 | |
Data are numbers and row percentages of patients. NIHSS, National Institute of Health Stroke Scale; FPG, fasting plasma glucose.
Table 4.
Distribution of patients with 2‐h postprandial glucose ≥7.8 mmol/L at 1 day in 30% variation of glucose
| Variations from 1 day to 14 days poststroke | NIHSS score | Total | P | |
|---|---|---|---|---|
| ≥20% decrease | <20% decrease | |||
| FPG | ||||
| ≥30% | 10 (52.6) | 9 (47.4) | 19 | 0.014 |
| <30% | 80 (81.6) | 18 (18.4) | 98 | |
| Total | 90 | 27 | 117 | |
| 2‐h postprandial glucose | ||||
| ≥30% | 24 (61.5) | 15 (38.5) | 39 | |
| <30% | 66 (84.6) | 12 (15.4) | 78 | 0.005 |
| Total | 90 | 27 | 117 | |
Data are numbers and row percentages of patients. FPG, fasting plasma glucose.
Discussion
In the present study, a high prevalence of abnormal glucose metabolism was found in acute ischemic stroke patients with no previously diagnosed diabetes mellitus, many of which are only revealed by performing OGTT at early stage. In addition, a higher level of instant blood glucose at admission or fasting plasma glucose (FPG) 1 day after admission correlated with less neurological improvement. More importantly, the number of patients with no less than 20% decrease in NIHSS was significantly decreased in patient group with higher than 30% variation of either FPG or 2‐h postprandial glucose, implying that inordinate variation of glucose may influence neurological improvement poststroke.
Recent Chinese national studies have showed that the prevalence of diabetes mellitus and prediabetes mellitus in general population was up to 9.7% and 15.5%, while the prevalence in stroke patients was much higher than in general population, with 42.3% diabetes mellitus and 26.4% IGT as well as IFG 15, 22. Consistent with these studies, we found most of patients (134/216; 62%) presented abnormal glucose metabolism, of which the prevalence of newly diagnosed diabetes mellitus or IGT was 30.6% (66/216) or 31% (67/216), respectively, indicating that abnormal glucose metabolism was much common in stroke patients.
OGTT has been proven a more sensitive and reliable approach to detect PSH compared with FPG test alone 2, 22, 23, 24, 25. In our study, the prevalence of glucometabolic abnormalities detected by FPG test was only 17.1% (37/216); however, the actual prevalence was 62% (134/216) by OGTT. FPG test alone would thereby have resulted in most patients (97/134; 72.4%) with abnormal glucose metabolism undiagnosed. Thus, it is important to perform OGTT for the full discovery of PSH.
Hyperglycemia is commonly associated with a poorer stroke outcome when compared with normoglycemia 3, 26, 27. Persisting anaerobic glycolysis at the time of cerebral ischemia causes the development of intracellular acidosis, which may increase penumbral injury and thus final infarct size through different mechanisms 28, 29. Our study also found that a higher level of instant blood glucose at admission or FPG at 1 day was associated with worse neurological improvement at 14 days after stroke onset in patients without history of diabetes, indicating a probable beneficial effect from control of hyperglycemia at early stroke stage. The optimal target level of glucose control did not be searched in the present observational study, but the lower limit for glucose control has been showed 3.9–4.0 mmol/L in previous studies 6, 30. Further studies are required to clarify this issue.
More importantly, in the GIST‐UK, the majority of patients presented moderate elevations of plasma glucose within 24 h of acute stroke, especially in the first 6 h, after which glucose began to fall, demonstrating a spontaneous glucose variation 7. In our study, we observed the glucose variation in a longer duration and found that from 1 day after admission to 14 days poststroke, the glucose levels fluctuated. The results prompted us to further investigate whether variation of glucose was involved in neurological improvement. Indeed, a less than 30% variation of glucose correlated with decreased neurological deficit compared with over 30% variation, while there was no significant difference between 10% and 20% variation of glucose and neurological improvement. In the subgroup analysis, in patients with 2‐h postprandial glucose ≥7.8 mmol/L at 1 day, we also found that an over 30% variation of glucose was associated with less neurological improvement compared with that fewer than 30% variation. Long‐term instability of FPG has been proven not only a predictor of 5‐year cardiovascular‐related mortality, but also a better predictor than mean level of glucose to assess 10‐year survival in elderly patients with type 2 diabetes mellitus, showing that a stable glucose was protective and a moderate variation was harmful 9, 31. Our study showed a short‐term variation of glucose, and the mechanism underlying the effect of the variation on neurological improvement is unclear. But like hyperglycemia, variation of glucose may also perform its adverse effects through enhancement of free radical formation, activation of pH‐dependent endonucleases, and glutamate release with subsequent alteration of intracellular Ca2 + regulation and mitochondrial failure 1, 32.
Our study has some limitations. First, a steamed bun, instead of standard hydrous glucose, was used to detect 2‐h postprandial glucose level at 1 day for the safety of patients, but the method could mimic the standardized OGTT as previously reported 15. Second, the glucose levels were only detected twice during the 14‐day follow‐up to compute the variation with cutoff values of 10%, 20%, and 30%, instead of the coefficient of variation, which did not precisely represent the whole process of poststroke glucose changes. However, as a pilot study, we have revealed a possible relationship between glucose variation and neurological improvement after stroke. Longer period of follow‐up would warrant further elucidation for the question.
Conclusion
Our data showed that impaired glucose metabolism is much common in acute stroke patients without a history of diabetes mellitus, many of which are only revealed by performing OGTT at early stage. The study implies that inordinate variation of glucose may take adverse effects on neurological improvement poststroke, giving evidence that the fluctuation of glucose levels in stroke patients should be taken into consideration during glucose modulation.
Conflict of Interest
The authors declare no conflict of interest.
Acknowledgments
The study was supported by grants from Guangdong Province Higher Vocational Colleges & Schools Pearl River Scholar Funded Scheme (GDHVPS, 2009), the National Basic Research Program of China (No. 2011CB707805) and the Joint Funds of the Natural Science Foundation of China (No. U1032005).
References
- 1. McCormick MT, Muir KW, Gray CS, Walters MR. Management of hyperglycemia in acute stroke: How, when, and for whom? Stroke 2008;39:2177–2185. [DOI] [PubMed] [Google Scholar]
- 2. Gray CS, Scott JF, French JM, Alberti KG, O'Connell JE. Prevalence and prediction of unrecognised diabetes mellitus and impaired glucose tolerance following acute stroke. Age Ageing 2004;33:71–77. [DOI] [PubMed] [Google Scholar]
- 3. Williams LS, Rotich J, Qi R, et al. Effects of admission hyperglycemia on mortality and costs in acute ischemic stroke. Neurology 2002;59:67–71. [DOI] [PubMed] [Google Scholar]
- 4. Farrokhnia N, Bjork E, Lindback J, Terent A. Blood glucose in acute stroke, different therapeutic targets for diabetic and non‐diabetic patients? Acta Neurol Scand 2005;112:81–87. [DOI] [PubMed] [Google Scholar]
- 5. Martini SR, Kent TA. Hyperglycemia in acute ischemic stroke: A vascular perspective. J Cereb Blood Flow Metab 2007;27:435–451. [DOI] [PubMed] [Google Scholar]
- 6. Gray CS, Hildreth AJ, Sandercock PA, et al. Glucose‐potassium‐insulin infusions in the management of post‐stroke hyperglycaemia: The UK Glucose Insulin in Stroke Trial (GIST‐UK). Lancet Neurol 2007;6:397–406. [DOI] [PubMed] [Google Scholar]
- 7. Gray CS, Hildreth AJ, Alberti GK, O'Connell JE, Collaboration G. Poststroke hyperglycemia: Natural history and immediate management. Stroke 2004;35:122–126. [DOI] [PubMed] [Google Scholar]
- 8. Temelkova‐Kurktschiev TS, Koehler C, Henkel E, Leonhardt W, Fuecker K, Hanefeld M. Postchallenge plasma glucose and glycemic spikes are more strongly associated with atherosclerosis than fasting glucose or HbA1c level. Diabetes Care 2000;23:1830–1834. [DOI] [PubMed] [Google Scholar]
- 9. Muggeo M, Zoppini G, Bonora E, et al. Fasting plasma glucose variability predicts 10‐year survival of type 2 diabetic patients: The Verona Diabetes Study. Diabetes Care 2000;23:45–50. [DOI] [PubMed] [Google Scholar]
- 10. Service FJ, O'Brien PC. The relation of glycaemia to the risk of development and progression of retinopathy in the Diabetic Control and Complications Trial. Diabetologia 2001;44:1215–1220. [DOI] [PubMed] [Google Scholar]
- 11. Shichiri M, Kishikawa H, Ohkubo Y, Wake N. Long‐term results of the Kumamoto Study on optimal diabetes control in type 2 diabetic patients. Diabetes Care 2000;23 (Suppl 2):B21–B29. [PubMed] [Google Scholar]
- 12. Adams HP Jr, Bendixen BH, Kappelle LJ, et al. Classification of subtype of acute ischemic stroke. Definitions for use in a multicenter clinical trial. TOAST. Trial of Org 10172 in Acute Stroke Treatment. Stroke 1993;24:35–41. [DOI] [PubMed] [Google Scholar]
- 13. Bamford J, Sandercock P, Dennis M, Burn J, Warlow C. Classification and natural history of clinically identifiable subtypes of cerebral infarction. Lancet 1991;337:1521–1526. [DOI] [PubMed] [Google Scholar]
- 14. Hu DY, Pan CY, Yu JM; China Heart Survey G . The relationship between coronary artery disease and abnormal glucose regulation in China: The China Heart Survey. Eur Heart J 2006;27:2573–2579. [DOI] [PubMed] [Google Scholar]
- 15. Yang W, Lu J, Weng J, et al. Prevalence of diabetes among men and women in China. N Engl J Med 2010;362:1090–1101. [DOI] [PubMed] [Google Scholar]
- 16. Alberti KG, Zimmet PZ. Definition, diagnosis and classification of diabetes mellitus and its complications. Part 1: Diagnosis and classification of diabetes mellitus provisional report of a WHO consultation. Diabet Med 1998;15:539–553. [DOI] [PubMed] [Google Scholar]
- 17. Resnick HE, Harris MI, Brock DB, Harris TB. American Diabetes Association diabetes diagnostic criteria, advancing age, and cardiovascular disease risk profiles: Results from the Third National Health and Nutrition Examination Survey. Diabetes Care 2000;23:176–180. [DOI] [PubMed] [Google Scholar]
- 18. American Diabetes A . Postprandial blood glucose. American Diabetes Association. Diabetes Care 2001;24:775–778. [DOI] [PubMed] [Google Scholar]
- 19. Bonora E, Calcaterra F, Lombardi S, et al. Plasma glucose levels throughout the day and HbA (1c) interrelationships in type 2 diabetes: Implications for treatment and monitoring of metabolic control. Diabetes Care 2001;24:2023–2029. [DOI] [PubMed] [Google Scholar]
- 20. Kharitonova T, Mikulik R, Roine RO, et al. Association of early National Institutes of Health Stroke Scale improvement with vessel recanalization and functional outcome after intravenous thrombolysis in ischemic stroke. Stroke 2011;42:1638–1643. [DOI] [PubMed] [Google Scholar]
- 21. Nam HS, Lee KY, Han SW, et al. Prediction of long‐term outcome by percent improvement after the first day of thrombolytic treatment in stroke patients. J Neurol Sci 2009;281:69–73. [DOI] [PubMed] [Google Scholar]
- 22. Jia Q, Zheng H, Zhao X, et al. Abnormal glucose regulation in patients with acute stroke across China: Prevalence and baseline patient characteristics. Stroke 2012;43:650–657. [DOI] [PubMed] [Google Scholar]
- 23. Vancheri F, Curcio M, Burgio A, et al. Impaired glucose metabolism in patients with acute stroke and no previous diagnosis of diabetes mellitus. QJM 2005;98:871–878. [DOI] [PubMed] [Google Scholar]
- 24. Urabe T, Watada H, Okuma Y, et al. Prevalence of abnormal glucose metabolism and insulin resistance among subtypes of ischemic stroke in Japanese patients. Stroke 2009;40:1289–1295. [DOI] [PubMed] [Google Scholar]
- 25. Matz K, Keresztes K, Tatschl C, et al. Disorders of glucose metabolism in acute stroke patients: An underrecognized problem. Diabetes Care 2006;29:792–797. [DOI] [PubMed] [Google Scholar]
- 26. Capes SE, Hunt D, Malmberg K, Pathak P, Gerstein HC. Stress hyperglycemia and prognosis of stroke in nondiabetic and diabetic patients: A systematic overview. Stroke 2001;32:2426–2432. [DOI] [PubMed] [Google Scholar]
- 27. Parsons MW, Barber PA, Desmond PM, et al. Acute hyperglycemia adversely affects stroke outcome: A magnetic resonance imaging and spectroscopy study. Ann Neurol 2002;52:20–28. [DOI] [PubMed] [Google Scholar]
- 28. Li PA, Shuaib A, Miyashita H, He QP, Siesjo BK, Warner DS. Hyperglycemia enhances extracellular glutamate accumulation in rats subjected to forebrain ischemia. Stroke 2000;31:183–192. [DOI] [PubMed] [Google Scholar]
- 29. Anderson RE, Tan WK, Martin HS, Meyer FB. Effects of glucose and PaO2 modulation on cortical intracellular acidosis, NADH redox state, and infarction in the ischemic penumbra. Stroke 1999;30:160–170. [DOI] [PubMed] [Google Scholar]
- 30. Bruno A, Saha C, Williams LS, Shankar R. IV insulin during acute cerebral infarction in diabetic patients. Neurology 2004;62:1441–1442. [DOI] [PubMed] [Google Scholar]
- 31. Muggeo M, Verlato G, Bonora E, Zoppini G, Corbellini M, de Marco R. Long‐term instability of fasting plasma glucose, a novel predictor of cardiovascular mortality in elderly patients with non‐insulin‐dependent diabetes mellitus: The Verona Diabetes Study. Circulation 1997;96:1750–1754. [DOI] [PubMed] [Google Scholar]
- 32. Baird TA, Parsons MW, Phanh T, et al. Persistent poststroke hyperglycemia is independently associated with infarct expansion and worse clinical outcome. Stroke 2003;34:2208–2214. [DOI] [PubMed] [Google Scholar]