

Summary
Aims
Automated hippocampal segmentation is an important issue in many neuroscience studies.
Methods
We presented and evaluated a novel segmentation method that utilized a manifold learning technique under the multiatlas‐based segmentation scenario. A manifold representation of local patches for each voxel was achieved by applying an Isomap algorithm, which can then be used to obtain spatially local weights of atlases for label fusion. The obtained atlas weights potentially depended on all pairwise similarities of the population, which is in contrast to most existing label fusion methods that only rely on similarities between the target image and the atlases. The performance of the proposed method was evaluated for hippocampal segmentation and compared with two representative local weighted label fusion methods, that is, local majority voting and local weighted inverse distance voting, on an in‐house dataset of 28 healthy adolescents (age range: 10–17 years) and two ADNI datasets of 100 participants (age range: 60–89 years). We also implemented hippocampal volumetric analysis and evaluated segmentation performance using atlases from a different dataset.
Results
The median Dice similarities obtained by our proposed method were approximately 0.90 for healthy subjects and above 0.88 for two mixed diagnostic groups of ADNI subjects.
Conclusion
The experimental results demonstrated that the proposed method could obtain consistent and significant improvements over label fusion strategies that are implemented in the original space.
Keywords: Hippocampal segmentation, Local label fusion, Manifold learning, Multiatlas segmentation
Introduction
Accurate segmentation of subcortical structures from brain magnetic resonance (MR) images plays an increasingly important role in many medical applications. For example, the hippocampus, a deep‐brain structure known for its involvement in learning and memory, is damaged in many psychiatric disorders, such as temporal lobe epilepsy 1, schizophrenia 2, and Alzheimer's disease (AD) 3, 4. The size and morphology of the hippocampus constitutes a valuable tool in clinical diagnosis, treatment, and assessment of these diseases. The current gold standard for hippocampus segmentation is manual delineation by experts. However, manual segmentation is extremely time‐consuming and is subject to inter‐ and intrarater differences 5, thus limiting its clinical application. Therefore, automated segmentation techniques are desirable, particularly when the dataset is large.
Multiatlas‐based segmentation is currently one of the most accurate automatic approaches 6, 7, 8. In this method, an atlas is defined as an image with manual labels. The segmentation starts by registering each intensity atlas image to the target image and then warping the corresponding label image to the target space using the same transformation. Each warped label image is regarded as candidate segmentation for the target image. Subsequently, label fusion is implemented by integrating all candidate segmentations into the definitive segmentation for the target. Several label fusion methods were developed to further improve the quality of multiatlas‐based segmentation. One class of label fusion methods is based on Simultaneous Truth and Performance Level Estimation (STAPLE) framework, which does not use the intensities of the atlases after registration 9, 10, 11, 12. Another class of combination strategy is based on ad hoc voting. The simplest form is majority voting, where the final label is determined to be the one in which most segmentations agree 13. Recently, it was demonstrated that weighted label fusion approaches using global 14, local 15, 16, and nonlocal 17 intensity similarity metrics are successful in practice. The criterion of weighted voting is to assign larger weights to the atlases that are more similar with the target image. Atlas weights derived from local or nonlocal similarity outperformed the global‐based methods 14, 17, 18. Additionally, more sophisticated fusion methods were proposed, such as joint label fusion, which models the pairwise dependency between the atlases as the joint probability of the two atlases producing the same segmentation error, that can be used to reduce the influence of redundancy information on the atlas dataset 19, 20.
It is worth noting that the label fusion methods mentioned above were conducted in original high‐dimensional space (on the order of the number of image/patch voxels). However, not all dimensions are useful for image analysis. Learning the low‐dimensional representation of high‐dimensional data can reduce the complexity and improve the interpretability of image data 21. Manifold learning assumes that images are points on a low‐dimensional manifold embedded in a high‐dimensional space and provide a possibility to obtain the underlying manifold. First, a graph representation of the image data was obtained, where each vertex of the graph represents an image, and each edge represents similarity between the images. Then, an embedded manifold representation was derived from the graph matrix. Manifold learning has been useful in many medical imaging applications 22, such as segmentation 23, registration 24, 25, and classification 21, 26, 27. In the multiatlas segmentation scenario, manifold learning has been successfully applied in atlas selection, that is, to select atlases that are near the target image on the learning manifold to implement segmentation 28, 29, 30, 31, 32, 33. In their work, the geodesic distances used to construct the graph were based on global image similarities.
Herein, we proposed a multiatlas segmentation scheme that employs manifold learning to determine spatially local weights for label fusion in a low‐dimensional coordinate space. A local search strategy was adopted to select a candidate patch for each atlas. Then, the manifold coordinates of local patches were achieved by applying a manifold learning algorithm. Finally, label fusion was conducted in the low‐dimensional space. The performance of the proposed method has been evaluated on one in‐house dataset and two ADNI datasets using leave‐one‐out cross‐validations. We also investigated the influences of different parameters and then compared the results with two widely used label fusion methods, that is, local majority voting (LMV, the majority voting fusion strategy based on local patches) and local weighted inverse distance voting (LWINV), which we implemented in the original high‐dimensional space. In addition, we implemented hippocampal volumetric analysis and evaluated segmentation performance using atlases from different datasets.
Materials and Methods
Datasets
We utilized three datasets in this study. First, we applied our method to segment the hippocampus in 28 healthy adolescents. Second, we demonstrated the ability of our method to address pathological variability using two ADNI datasets.
In‐House Dataset
This dataset contains sagittal T1‐weighted MR images of 28 healthy adolescents (15 boys, 13 girls) with an average age of 13.8 years (age range: 10–17 years). All the MR images were acquired using a 3.0T Siemens Tim Trio MRI scanner in the Imaging Center for Brain Research, Beijing Normal University. The imaging parameters were as follows: repetition time [TR] = 2530 ms, echo time [TE] = 3.39 ms, flip angle = 7°, slice thickness = 1 mm, field of view = 256 × 256 mm2, matrix size = 256 × 256, and number of slices = 176.
All scans were corrected for intensity inhomogeneity by the N3 algorithm 34 and then aligned to the MNI152 template space using a linear transformation. Subsequently, the hippocampus was manually delineated in stereotaxic space by two blinded raters according to previously described protocols 35. The manual labeling was performed using ITK‐SNAP software (http://www.itksnap.org). A subset of five images was randomly chosen to perform reliability tests. The interrater reliability in terms of Dice overlap was 0.89. Approximately 3 months later, one rater repeated the hippocampal boundary tracing to access intrarater reliability, which was 0.91.
ADNI 1.5T Dataset and ADNI 3.0T Dataset
These images were obtained from the Alzheimer's Disease Neuroimaging Initiative (ADNI) database (adni.loni.usc.edu/). The detailed information of ADNI is shown in the Appendix. Many previous studies have used the Medtronic Surgical Navigation Technologies (SNT) semi‐automated segmentations provided by ADNI as benchmarks for validation 8, 36. However, over‐ and underestimation and even misalignments of the entire hippocampal segmentation were found in the SNT segmentations when inspected by an expert manual rater 37. Thus, we selected all 100 subjects for whom the manual hippocampal masks were provided by EADC project (www.hippocampal-protocol.net). The sample consisted of 58 1.5T and 42 3.0T images, and they were used as two datasets. There were four diagnosis groups in this sample, including normal controls (NC), mild cognitive impairment (MCI), late MCI (LMCI), and patients with AD. The demographic information of these subjects is listed in Table 1.
Table 1.
Demographic information of the 100 ADNI subjects
| ADNI 1.5T dataset | ADNI 3.0T dataset | |||||||
|---|---|---|---|---|---|---|---|---|
| NC | LMCI | MCI | AD | NC | LMCI | MCI | AD | |
| Subject size | 17 | 8 | 13 | 20 | 12 | 5 | 8 | 17 |
| Age | 74.5 (6.9) | 71.3 (6.5) | 74.1 (8.3) | 74.4 (8.3) | 76.3 (6.7) | 77.0 (6.8) | 75.7 (8.5) | 73.4 (8.3) |
| Males/females | 9/8 | 3/5 | 9/4 | 10/10 | 7/5 | 4/1 | 4/4 | 10/7 |
| MMSE | 28.9 (1.1) | 26.5 (3.2) | 27.1 (2.3) | 23.4 (2.5) | 29 (1.0) | 26.5 (2.6) | 25.9 (3.3) | 19.3 (5.0) |
NC, normal control; MCI, mild cognitive impairment; LMCI, late MCI; AD, Alzheimer's disease.
The raw images were oriented along the anterior and posterior commissures line (AC‐PC), and then manual hippocampal labeling was performed by expert tracers according to the Harmonized Hippocampal Protocol (http://hippocampal-protocol.net/SOPs/LINK_PAGE/HarmonizedProtocol_ACPC_UserManual_biblio.pdf). The image resolution is 1 × 1 × 1 mm3. For each participant, an N3 bias field correction was used. All MR images were transformed into MNI152 template space by linear registration.
Local Manifold Learning Method
The flow chart of local manifold learning (LML)‐based segmentation method is schematically illustrated in Figure 1. We first selected a subset of atlases in the MNI152 space and linearly warped the atlases to the target image (based on cropped images around the hippocampus). Subsequently, a local patch search strategy was performed to obtain the most similar patch with the target patch for each atlas. Next, low‐dimensional embedding of patches was implemented using manifold learning. Finally, the label of the target voxel was identified by fusing atlas labels in the low‐dimensional space.
Figure 1.
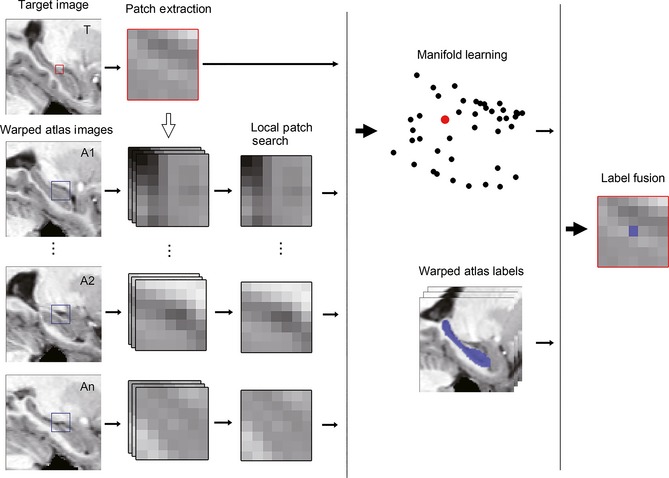
Processing pipeline of labeling one target voxel by the proposed local manifold learning segmentation method. The red box in the target image represents the target patch, and the blue boxes in the atlas images represent the search volume region for extracting atlas patches.
Atlas Selection and Registration
Because using the most similar atlases with the target image T can improve the segmentation accuracy 6, a subset of n atlases (A1, A2, …, An) was selected based on the sum of the squared intensity differences (SSD) between the atlases and the target image as suggested by Aljabar et al. 6. The selection was performed in the MNI152 template space. Each selected atlas MR image was linearly registered to the target image and then transformed the corresponding hippocampal label image using the same transformation matrix with nearest neighbor interpolation. The image affine registration was performed using the FLIRT tool 38.
Local Patch Search
A local patch search strategy was conducted to reduce the influence of registration error as suggested by the literature 19. We selected the local patch search strategy rather than nonlocal mean patch strategy 17 because the nonlocal method employs all patches within the searching neighborhood and causes a computational burden in the next manifold learning step. A patch was defined as a cube centered on the location in consideration (radius was denoted as R). A search volume (SV) was defined as a cube around the target voxel (radius was denoted as S). A total number of (2S + 1)3 patches in the SV for each atlas were computed for its similarity with the target patch Pt. The intensity vector obtained from each patch was normalized first. Then, the most similar atlas patch was selected for each warped atlas as follows:
| (1) |
where I(x) represents the normalized intensity vector of patch x.
Patch‐Based Manifold Embedding
For each voxel of the target image, manifold learning was implemented with an Isomap algorithm 39. The Isomap is a commonly used nonlinear dimensional reduction method, which attempts to estimate the intrinsic geometry of the underlying manifold based on pairwise distances derived from high‐dimensional data. In this study, we assumed that a total number of n + 1 patches (i.e., the target patch and n atlas patches) were lying on a manifold with dimensionality d embedded in the dimension space, where d ≪ D. The similarity for each pair of patches was coded by the L2 or Euclidean distance derived from the voxel intensities as follows:
| (2) |
where I(P) represents the intensity vector of patch P. Then, a neighborhood graph, G, was constructed by linking each patch to its K nearest neighbors (KNN). This graph allows an approximate calculation of the geodesic distance between all pairs of patches computed as the shortest path distance connecting patches, i and j, in the neighborhood graph, G. Subsequently, Isomap uses classical multidimensional scaling to obtain the d‐dimensional coordinates, which is implemented by minimizing the reconstruction error as follows:
| (3) |
where y i is the corresponding newly defined low‐dimensional coordinate vector of patch i, and Y represents a set of {y 1, y 2, ..., y n+1}.
Segmentation by Label Fusion
Finally, the label fusion step was performed in the low‐dimensional space. The weight of each atlas patch was estimated based on its local appearance similarity with the target patch. A label fusion strategy similar to the local weighted inverse distance (LWINV) method 14 was employed as follows:
| (4) |
where y t and y i are the low‐dimensional coordinates of the target patch and atlas patch, respectively, beta is a model parameter controlling the weight distribution, and Z is a normalization constant. While in the LWINV, y t and y i in this formula represent the intensity vector of the target patch and atlas patch, respectively. Once the weight, w i, of each atlas patch was determined, the final label of the target voxel was assigned as the one with the maximum voting probability:
| (5) |
where L represents the number of all possible labels (L = 2 in this work) and P i(l) = 1 when the label of the atlas i is l (otherwise P i(l) = 0).
Experiments and Results
We chose a widely used evaluation metric, Dice similarity coefficient (DSC), between the manual label, S 1, and the automatic segmentation, S 2, to quantitatively assess the performance of segmentation as follows:
| (6) |
where S 1 ∩ S 2 represents the overlapping volume between two segmented regions and V(x) is the volume of a segmentation x. The Dice index ranges from 0 to 1, and a higher value indicates better segmentation. In the experiments, the leave‐one‐out cross‐validation technique was adopted, and for each target image, we chose the top 20 similar atlases based on SSD 40. To reduce the computational burden, the images were cropped around the hippocampus. Moreover, the intensities were linearly rescaled to the interval [0, 100]. The image selection and registration were based on the cropped images.
Choosing the Parameters
The influence of model parameters on segmentation accuracy was studied via leave‐one‐out cross‐validation on the left hippocampus of the in‐house dataset according to the parameter tuning method described in 41. Our method has five free parameters: K, the number of neighbors in KNN to construct a neighborhood graph; d, the embedding low dimension; beta, the parameter controlling the weight distribution; S, the radius of the local searching window; and R, the radius of the local patch. The DSC values over varying model parameters are presented in Figure 2. When studying the impact of a certain parameter on segmentation accuracy, the other parameters were held fixed. For example, we first selected the search patch radius S among {0, 1, 2, 3, 4, 5}, with the other parameters conservatively set as K = 5, d = 3, beta = 5, and R = 2. The performance begins to converge when S = 3 or more. Due to the greater time needed for local patch search with larger searching radii, we chose S = 3 in this study. Additionally, the search range for other parameters was empirically chosen as , , , and . Finally, we chose a combination of parameters for LML in the following experiments (S = 3, R = 2, K = 2, d = 3, and beta = 4).
Figure 2.
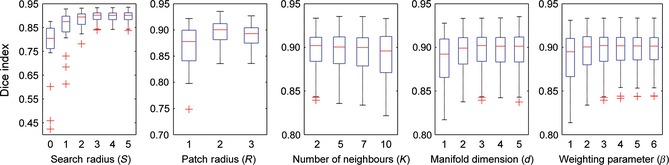
Optimal selection of five model parameters using the leave‐one‐out cross‐validation based on left hippocampal segmentation of an in‐house dataset. The optimal combination parameters S = 3, R = 2, K = 2, d = 3, and beta = 4 were selected.
Comparison With Other Methods
Once the optimal parameters were selected, the proposed LML method was used to segment the hippocampus in all three datasets, and its accuracy was evaluated using a leave‐one‐out procedure. In each cross‐validation step, one image was treated as a target image, and the top 20 most similar images selected from the remaining images were used as atlases. This process was repeated until each image was served as the target image once. The LML method was also compared with two state‐of‐the‐art label fusion methods, including LWINV and LMV. The LMV was considered as a baseline automatic label fusion algorithm in this study, which implemented the majority voting fusion strategy on local patches. The LWINV was chosen because it is similar to our LML method, but they are implemented in different dimensional spaces. For a fair comparison, the same local patch search process was performed for all three methods, where the patch radius was set to 2 and the search radius was set to 3. Moreover, an identical beta value (i.e., beta = 4) was used for both the LML and the LWINV methods. Table 2 lists the median DSC values (and standard deviations) for three datasets and the statistics of the paired t‐tests comparing the LML method with other methods. For all three datasets, the proposed LML method performed significantly better than LWINV and LMV (P < 0.001). Note that the segmentation performance of the in‐house dataset was better than the two ADNI datasets. Moreover, the performance of the ADNI 1.5T dataset outperformed the ADNI 3.0T dataset. Figure 3 is a 3D view of a representative hippocampal segmentation result (median DSC value) for each dataset to qualitatively assess the voxelwise distribution of label errors between automatic and manual segmentations. Other qualitative results are illustrated in Figure 4, where the sagittal views for the best, median, and worst results based on the ADNI 3.0T dataset for all considered algorithms are presented. The segmentations from LML are more accurate at the boundaries and have fewer hollows.
Table 2.
The performance of hippocampal segmentation on three datasets. Paired t‐tests were performed for comparing the LML method with others. Dice similarity coefficients (median ± standard deviation) along with statistical results for both left and right hippocampus are reported
| Dataset | Method | Left hippocampus | Right hippocampus | ||||
|---|---|---|---|---|---|---|---|
| Dice | t‐stat | P‐value | Dice | t‐stat | P‐value | ||
| In‐house | LMV | 0.879 ± 0.057 | 5.2 | 1.8e‐5 | 0.860 ± 0.048 | 7.8 | 2.3e‐8 |
| LWINV | 0.896 ± 0.031 | 4.1 | 3.4e‐4 | 0.895 ± 0.039 | 3.9 | 5.2e‐4 | |
| LML | 0.902 ± 0.026 | – | – | 0.900 ± 0.034 | – | – | |
| ADNI 1.5T | LMV | 0.841 ± 0.083 | 9.1 | 9.1e‐13 | 0.833 ± 0.101 | 8.5 | 9.5e‐12 |
| LWINV | 0.886 ± 0.040 | 4.2 | 1.0e‐4 | 0.886 ± 0.044 | 4.8 | 1.0e‐5 | |
| LML | 0.891 ± 0.033 | – | – | 0.891 ± 0.036 | – | – | |
| ADNI 3.0T | LMV | 0.817 ± 0.087 | 7.7 | 1.7e‐9 | 0.819 ± 0.080 | 7.7 | 1.6e‐9 |
| LWINV | 0.876 ± 0.029 | 4.5 | 6.3e‐5 | 0.878 ± 0.025 | 4.2 | 1.2e‐4 | |
| LML | 0.881 ± 0.022 | – | – | 0.882 ± 0.019 | – | – | |
LWINV, local weighted inverse distance voting; LMV, local majority voting; LML, local manifold learning.
Figure 3.
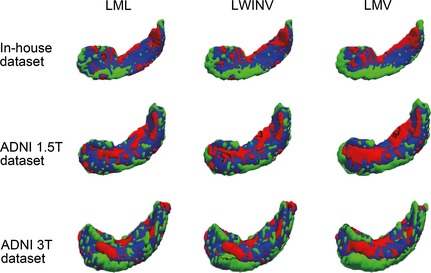
3D views of hippocampal segmentation results obtained by local manifold learning, local weighted inverse distance voting, and local majority voting for a representative subject with a median Dice index from three datasets. Overlapping areas between manual segmentations (red) and automatic segmentations (green) are shown in blue.
Figure 4.
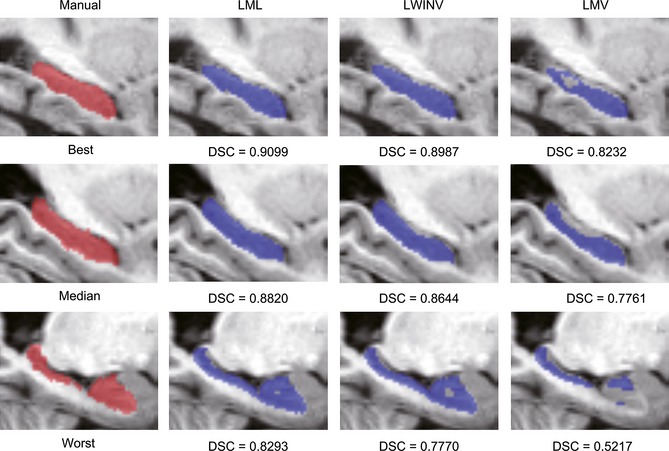
Sagittal views of hippocampal segmentation results produced by local manifold learning, local weighted inverse distance voting, and local majority voting for the subjects from the ADNI 3.0T dataset with the best (top), median (middle), and worst Dice index (bottom).
Hippocampal Volumetric Analysis
A hippocampal volumetric analysis was performed based on all ADNI subjects (both 1.5T and 3.0T). Because brains with a large total intracranial volume (TIV) tend to have larger hippocampi, the hippocampal volumes were corrected according to the TIVs estimated by VBM8 (http://dbm.neuro.uni-jena.de/vbm/). This correction can be simply performed by dividing the hippocampal volume by the TIV and then multiplying by the mean of TIVs of all images. The normalized volumes of the left and right hippocampi by groups of all ADNI subjects are presented in Figure 5. The volume measurements produced by automatic methods were all smaller than the reference segmentations. Consistently, a previous study demonstrated that weighted voting strategies would produce spatial bias that undersegments convex structures, such as the hippocampus 42. However, the segmentations achieved by our method were the closest to manual segmentations. In addition, the Bland–Altman diagrams 43 plotting the hippocampal volume difference between automatic and manual segmentations for ADNI 1.5T and 3.0T datasets are presented in Figure 6. These diagrams indicate that the automatic methods tend to underestimate the hippocampal volumes, particularly for larger hippocampi. The Bland–Altman plots also demonstrate that our method has the smallest bias (mean difference) in volume estimation.
Figure 5.
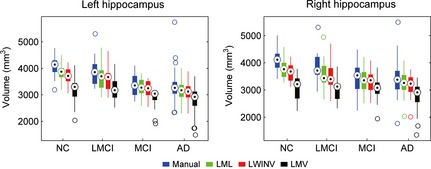
Hippocampal volumes (normalized by total intracranial volume) by four diagnosis groups of ADNI subjects.
Figure 6.
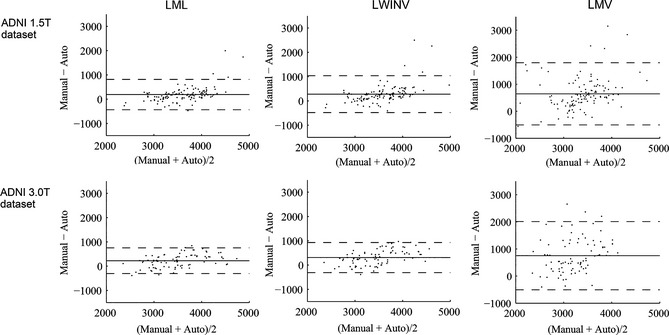
Bland–Altman plots for ADNI datasets. Hippocampal volumes were normalized by the total intracranial volume. The solid line represents the mean, and the dashed lines represent ±1.96 standard deviations from the mean.
We also computed Cohen's d effect sizes to test the ability of each method to detect hippocampal atrophy in the LMCI, MCI, and AD groups relative to controls (Table 3). Larger values of Cohen's d indicate a greater effect size, where 0.2 indicates a small effect, 0.5 indicates a medium effect, and >0.8 indicates a large effect 44. It was computed as follows:
| (7) |
where and are the mean volumes of two groups, and s represents a pooled standard deviation for the data defined as follows:
| (8) |
where n i and s i represent the number of subjects and standard deviation of volumes in group i. As reported in Table 3, our method yields the largest effect size among the three automatic label fusion methods. The effect sizes characterizing the between‐group difference of NC and LMCI are small, and the effect sizes of NC and MCI, NC, and AD are large. Moreover, it can be observed that, in general, the left hippocampus yields a better effect size than the right.
Table 3.
Cohen's d effect sizes between the controls and the other three diagnosis groups from ADNI subjects
| Method | Left hippocampus | Right hippocampus | ||||
|---|---|---|---|---|---|---|
| NC‐LMCI | NC‐MCI | NC‐AD | NC‐LMCI | NC‐MCI | NC‐AD | |
| LMV | 0.0944 | 0.7017 | 0.7820 | 0.1608 | 0.1563 | 0.6970 |
| LWINV | 0.2562 | 1.6584 | 1.8842 | 0.3328 | 0.9808 | 1.3297 |
| LML | 0.3868 | 1.7880 | 1.9097 | 0.4289 | 1.1124 | 1.4134 |
| Manual | 0.4345 | 1.9081 | 1.4921 | 0.5475 | 1.4340 | 1.2629 |
NC, normal control; MCI, mild cognitive impairment; LWINV, local weighted inverse distance voting; LMV, local majority voting; LML, local manifold learning; LMCI, late MCI; AD, Alzheimer's disease.
Performance Evaluation Across Different Datasets
The proposed method was evaluated across two ADNI datasets acquired with different field strengths. In particular, the 20 most similar images were selected as atlases from the ADNI 3.0T dataset to segment each image in the ADNI 1.5T dataset and vice versa. The results are listed in Table 4. The segmentation accuracy of the ADNI 3.0T images with atlases obtained from ADNI 1.5T images was similar with atlases obtained from its own dataset. However, the segmentation performance of the ADNI 1.5T images with 3.0T atlases was worse than with the 1.5T atlases. This may be because the ADNI 3.0T dataset had fewer subjects and more variation than the ADNI 1.5T dataset resulting in a larger error when selecting atlases.
Table 4.
Segmentation performances across two ADNI datasets. Dice similarity coefficients (median ± standard deviation) are listed
| Left hippocampus | Right hippocampus | |
|---|---|---|
| 1.5T → 3.0T (3.0T → 3.0T) | 0.880 ± 0.029 (0.881 ± 0.022) | 0.880 ± 0.026 (0.882 ± 0.019) |
| 3.0T → 1.5T (1.5T → 1.5T) | 0.877 ± 0.045 (0.891 ± 0.033) | 0.884 ± 0.046 (0.891 ± 0.036) |
A → B: Selected atlases from dataset A to segment images of dataset B.
Computational Complexity
The proposed method was implemented in C++ using the Insight Toolkit (ITK). The experiments were conducted using a single core of an Intel core i7‐4500 processor at 1.8 GHz with an 8GB of RAM. After the atlas's linear registration to the target image, it took approximately 40 seconds to segment one subject with the optimized parameter settings.
Discussion and Conclusion
In this work, we present a novel local label fusion strategy for multiatlas segmentation. Instead of assigning voting weights to each atlas in the original space, we utilized a manifold learning technology to build low‐dimensional coordinate systems based on local patches and conducted label fusion in this space. The proposed method was applied to segment the whole hippocampus on three datasets, including an in‐house dataset and two ADNI datasets. We also compared the proposed LML method with previous label fusion methods. The results demonstrated that our method could obtain good and robust segmentation results and achieved better performance than competing methods.
Our work focused on the label fusion step in the multiatlas segmentation framework. Previous label fusion methods based on STAPLE framework 9, 10, 11, 12 or ad hoc voting, such as majority voting 13, global 14, local 15, 16, and nonlocal 17 weighted label fusion approaches, have demonstrated good segmentation results. The main difference between our method and other label fusion methods is that our label fusion is implemented in the low‐dimensional space acquired by manifold learning. In addition, some studies focus on another other step, that is, image registration, in the multiatlas segmentation to reduce the need of very accurate registration, such as atlas selection 6, 28, optimization image registration 8, 31, 45, and local and nonlocal patch searches 17, 19. We utilized the local patch search strategy in this study. We have shown that LML can achieve a significant improvement of label overlaps with manual segmentation in comparison with two representative local label fusion methods, that is, LMV and LWINV. When constructing the graph model in the manifold learning step, not only the relations of the target patch and atlas patches but also the relations between each pair of atlas patches were considered. Therefore, the weights assigned to each atlas patch may potentially consider the dependencies among the atlases, which makes them less susceptible to noise and provides a more robust measure of similarity. Two recent studies have demonstrated that good segmentation performance can be achieved by modeling the joint probability of pairwise atlases to reduce error redundancy produced by atlases in a multiatlas frame 19, 20. We speculated that manifold learning adopted in this study could discover some underlying critical structures of image patches and reduce potential redundant information among them. This might be used to explain why our method outperforms other methods that were conducted in the original high‐dimensional space. In addition, it is worth noting the Dice index improvement had an upper bound approximately determined by the inter‐/intrarater variability.
Note that it is difficult to directly compare segmentation results across publications due to differences in the imaging protocols, segmentation protocols, and image datasets 46. Some recent hippocampal segmentation methods have reported DSC values >0.8 6, 47, 48, 49, 50, 51. More recently, several studies have achieved high DSC values ranging from 0.88 to 0.9 17, 19, 20, 36. Only two methods achieved the highest DSC values above 0.9. Wang et al. used an error correction learning to improve the performance of multiatlas segmentation and reported a DSC value of 0.908 for 57 NCs 52. Hao et al. used local support vector machine (SVM) to learn classifiers for a target image voxel in a featured space and achieved a DSC value of 0.910 for mixed diagnostic groups of 30 ADNI subjects 53. Our DSC index was approximately 0.9 for normal subjects and above 0.88 for the mixed diagnostic groups of ADNI subjects and demonstrated that our LML method can yield comparable results to recently published methods.
The results on the in‐house dataset achieved a higher DSC value than those on both ADNI datasets, which was consistent with a previous finding 36. This may be caused by several factors. First, the in‐house dataset included only normal subjects, while the ADNI datasets included four pathological groups that produced a larger anatomical variability. Second, the manual protocols for hippocampal segmentation were not similar resulting in a different gold standard for the hippocampus. In addition, the segmentation performances were different between the two ADNI datasets, where the 1.5T dataset performed better than the 3.0T dataset, which could be due to fewer subjects and more varied pathological distribution in the ADNI 3.0T dataset.
Several strategies can be used to improve the segmentation accuracy of the proposed LML method. First, using nonlinear registration instead of linear registration may improve the segmentation performance as mentioned in the literature 18. However, this will increase the computation time, and we have adopted the local patch search strategy to reduce the influence of registration errors introduced by the linear registration method. Second, the segmentation accuracy may be improved using correction learning to reduce systematic errors produced by our method 52. Third, the proposed approach may be improved using morphological operations to fill in holes in the segmentation results. Fourth, the use of the nonlocal patch search strategy employing all patches in the SV may obtain more accurate estimations than the local patch search strategy 54. However, the nonlocal search method may increase the computational cost and also burden the next manifold embedding step.
Future research will focus on the following aspects. It is straightforward to extend our algorithm for segmentation problems with multiple structures simultaneously rather than segment a single structure processed in this study. In the future, we plan to apply LML for hippocampal subfields and whole‐brain segmentation. Moreover, we only used the Euclidean distance to reflect the relation of paired patches in the high‐dimensional space in this study. We will evaluate the effects of other metrics, such as normalized cross‐correlation 55 and mutual information 56, on low‐dimensional embedding. Duc et al. 28 have compared the effects of different manifold learning methods, that is, Isomap, Laplacian eigenmaps 57, and locally linear embedding 58, for atlas selection in multiatlas segmentation and found the locally linear embedding gives the best results. In future work, it would be interesting to compare these manifold learning techniques on the segmentation results under our proposed framework.
Conflict of Interest
The authors declare no conflict of interest.
Acknowledgments
This work was supported by the National Science Foundation of China (Nos. 81471731 and 81171403). Data collection and sharing for this project was funded by the Alzheimer's Disease Neuroimaging Initiative (ADNI) (National Institutes of Health Grant U01 AG024904). ADNI is funded by the National Institute on Aging, the National Institute of Biomedical Imaging and Bioengineering, and through generous contributions from the following: Abbott, AstraZeneca AB, Bayer Schering Pharma AG, Bristol‐Myers Squibb, Eisai Global Clinical Development, Elan Corporation, Genentech, GE Healthcare, GlaxoSmithKline, Innogenetics, Johnson and Johnson, Eli Lilly and Co., Medpace, Inc., Merck and Co., Inc., Novartis AG, Pfizer Inc, F. Hoffman‐La Roche, Schering‐Plough, and Synarc, Inc., as well as nonprofit partners the Alzheimer's Association and Alzheimer's Drug Discovery Foundation, with participation from the U.S. Food and Drug Administration. Private sector contributions to ADNI are facilitated by the Foundation for the National Institutes of Health (www.fnih.org). The grantee organization is the Northern California Institute for Research and Education, and the study was coordinated by the Alzheimer's Disease Cooperative Study at the University of California, San Diego. ADNI data were disseminated by the Laboratory for Neuro Imaging at the University of California, Los Angeles. This research was also supported by NIH grants P30 AG010129, K01 AG030514, and the Dana Foundation.
Appendix: The Alzheimer's Disease Neuroimaging Initiative
The ADNI was launched in 2003 by the National Institute on Aging (NIA), the National Institute of Biomedical Imaging and Bioengineering (NIBIB), the Food and Drug Administration (FDA), private pharmaceutical companies, and nonprofit organizations as a $60 million, 5‐year public–private partnership. The primary goal of ADNI has been to test whether serial magnetic resonance imaging (MRI), positron emission tomography (PET), other biological markers, and clinical and neuropsychological assessments can be combined to measure the progression of mild cognitive impairment (MCI) and early Alzheimer's disease (AD). Determination of sensitive and specific markers of very early AD progression is intended to aid researchers and clinicians to develop new treatments and monitor their effectiveness and decrease the time and cost of clinical trials. The Principal Investigator of this initiative is Michael W. Weiner, MD, VA Medical Center and University of California, San Francisco. ADNI is the result of efforts of many coinvestigators from a broad range of academic institutions and private corporations, and the subjects have been recruited from over 50 sites across the United States and Canada. The initial goal of ADNI was to recruit 800 subjects, but ADNI has been followed by ADNI‐GO and ADNI‐2. To date, these three protocols have recruited over 1500 adults (ages 55–90) to participate in the research consisting of cognitively normal older individuals, people with early or late MCI, and people with early AD. The follow‐up duration of each group is specified in the protocols for ADNI‐1, ADNI‐2, and ADNI‐GO. Subjects originally recruited for ADNI‐1 and ADNI‐GO had the option to be followed in ADNI‐2. For up‐to‐date information, see www.adni-info.org.
References
- 1. De Lanerolle N, Kim J, Robbins R, Spencer D. Hippocampal interneuron loss and plasticity in human temporal lobe epilepsy. Brain Res 1989;495:387–395. [DOI] [PubMed] [Google Scholar]
- 2. Wang L, Mamah D, Harms MP, et al. Progressive deformation of deep brain nuclei and hippocampal‐amygdala formation in schizophrenia. Biol Psychiatry 2008;64:1060–1068. [DOI] [PMC free article] [PubMed] [Google Scholar]
- 3. Braak H, Braak E. Neuropathological stageing of Alzheimer‐related changes. Acta Neuropathol 1991;82:239–259. [DOI] [PubMed] [Google Scholar]
- 4. Wang L, Khan A, Csernansky JG, et al. Fully‐automated, multi‐stage hippocampus mapping in very mild Alzheimer disease. Hippocampus 2009;19:541–548. [DOI] [PMC free article] [PubMed] [Google Scholar]
- 5. Ashton EA, Takahashi C, Berg MJ, Goodman A, Totterman S, Ekholm S. Accuracy and reproducibility of manual and semiautomated quantification of MS lesions by MRI. J Magn Reson Imaging 2003;17:300–308. [DOI] [PubMed] [Google Scholar]
- 6. Aljabar P, Heckemann R, Hammers A, Hajnal J, Rueckert D. Multi‐atlas based segmentation of brain images: Atlas selection and its effect on accuracy. NeuroImage 2009;46:726–738. [DOI] [PubMed] [Google Scholar]
- 7. Iglesias JE, Sabuncu MR, Van Leemput K. Improved inference in Bayesian segmentation using Monte Carlo sampling: Application to hippocampal subfield volumetry. Med Image Anal 2013;17:766–778. [DOI] [PMC free article] [PubMed] [Google Scholar]
- 8. Lötjönen JM, Wolz R, Koikkalainen JR, et al. Fast and robust multi‐atlas segmentation of brain magnetic resonance images. NeuroImage 2010;49:2352–2365. [DOI] [PubMed] [Google Scholar]
- 9. Asman AJ, Landman BA. Non‐local statistical label fusion for multi‐atlas segmentation. Med Image Anal 2013;17:194–208. [DOI] [PMC free article] [PubMed] [Google Scholar]
- 10. Asman AJ, Landman BA. Robust statistical label fusion through consensus level, labeler accuracy, and truth estimation (COLLATE). IEEE Trans Med Imaging 2011;30:1779–1794. [DOI] [PMC free article] [PubMed] [Google Scholar]
- 11. Cardoso MJ, Leung K, Modat M, et al. STEPS: Similarity and Truth Estimation for Propagated Segmentations and its application to hippocampal segmentation and brain parcelation. Med Image Anal 2013;17:671–684. [DOI] [PubMed] [Google Scholar]
- 12. Warfield SK, Zou KH, Wells WM. Simultaneous truth and performance level estimation (STAPLE): An algorithm for the validation of image segmentation. IEEE Trans Med Imaging 2004;23:903–921. [DOI] [PMC free article] [PubMed] [Google Scholar]
- 13. Heckemann RA, Hajnal JV, Aljabar P, Rueckert D, Hammers A. Automatic anatomical brain MRI segmentation combining label propagation and decision fusion. NeuroImage 2006;33:115–126. [DOI] [PubMed] [Google Scholar]
- 14. Artaechevarria X, Munoz‐Barrutia A, Ortiz‐de‐Solorzano C. Combination strategies in multi‐atlas image segmentation: Application to brain MR data. IEEE Trans Med Imaging 2009;28:1266–1277. [DOI] [PubMed] [Google Scholar]
- 15. Sabuncu MR, Yeo B, Van Leemput K, Fischl B, Golland P. A generative model for image segmentation based on label fusion. IEEE Trans Med Imaging 2010;29:1714–1729. [DOI] [PMC free article] [PubMed] [Google Scholar]
- 16. Isgum I, Staring M, Rutten A, Prokop M, Viergever MA, van Ginneken B. Multi‐atlas‐based segmentation with local decision fusion—Application to cardiac and aortic segmentation in CT scans. IEEE Trans Med Imaging 2009;28:1000–1010. [DOI] [PubMed] [Google Scholar]
- 17. Coupe P, Manjon JV, Fonov V, Pruessner J, Robles M, Collins DL. Patch‐based segmentation using expert priors: Application to hippocampus and ventricle segmentation. NeuroImage 2011;54:940–954. [DOI] [PubMed] [Google Scholar]
- 18. Rousseau F, Habas PA, Studholme C. A supervised patch‐based approach for human brain labeling. IEEE Trans Med Imaging 2011;30:1852–1862. [DOI] [PMC free article] [PubMed] [Google Scholar]
- 19. Wang H, Suh J, Das S, Pluta J, Craige C, Yushkevich P. Multi‐atlas segmentation with joint label fusion. IEEE Trans Pattern Anal Mach Intell 2013;35:611–623. [DOI] [PMC free article] [PubMed] [Google Scholar]
- 20. Wu G, Wang Q, Zhang D, Nie F, Huang H, Shen D. A generative probability model of joint label fusion for multi‐atlas based brain segmentation. Med Image Anal 2013;18:881–890. [DOI] [PMC free article] [PubMed] [Google Scholar]
- 21. Bhatia KK, Rao A, Price AN, Wolz R, Hajnal JV, Rueckert D. Hierarchical manifold learning for regional image analysis. IEEE Trans Med Imaging 2014;33:444–461. [DOI] [PubMed] [Google Scholar]
- 22. Aljabar P, Wolz R, Rueckert D. Manifold learning for medical image registration, segmentation, and classification In: Suzuki K, editor. Machine learning in computer‐aided diagnosis: Medical imaging intelligence and analysis. Hershey, PA: IGI Global, 2012;351–372. [Google Scholar]
- 23. Zhang Q, Souvenir R, Pless R. On manifold structure of cardiac MRI data: Application to segmentation In: IEEE Conference on Computer Vision and Pattern Recognition (CVPR), 2006;1092–1098. [Google Scholar]
- 24. Hamm J, Ye DH, Verma R, Davatzikos C. GRAM: A framework for geodesic registration on anatomical manifolds. Med Image Anal 2010;14:633–642. [DOI] [PMC free article] [PubMed] [Google Scholar]
- 25. Ye DH, Hamm J, Kwon D, Davatzikos C, Pohl KM. Regional manifold learning for deformable registration of brain MR images. Med Image Comput Comput Assist Interv, Springer, 2012;7512:131–138. [DOI] [PMC free article] [PubMed] [Google Scholar]
- 26. Aljabar P, Rueckert D, Crum WR. Automated morphological analysis of magnetic resonance brain imaging using spectral analysis. NeuroImage 2008;43:225–235. [DOI] [PubMed] [Google Scholar]
- 27. Dong Hye Y, Desjardins B, Hamm J, Litt H, Pohl KM. Regional manifold learning for disease classification. IEEE Trans Med Imaging 2014;33:1236–1247. [DOI] [PMC free article] [PubMed] [Google Scholar]
- 28. Duc AKH, Modat M, Leung KK, et al. Using manifold learning for atlas selection in multi‐atlas segmentation. PLoS One 2013;8:e70059. [DOI] [PMC free article] [PubMed] [Google Scholar]
- 29. Wolz R, Aljabar P, Hajnal JV, Hammers A, Rueckert DLEAP. Learning embeddings for atlas propagation. NeuroImage 2010;49:1316–1325. [DOI] [PMC free article] [PubMed] [Google Scholar]
- 30. Cao Y, Yuan Y, Li X, Turkbey B, Choyke PL, Yan P. Segmenting images by combining selected atlases on manifold. Med Image Comput Comput Assist Interv, Springer, 2011;6893:272–279. [DOI] [PMC free article] [PubMed] [Google Scholar]
- 31. Jia H, Yap P‐T, Shen D. Iterative multi‐atlas‐based multi‐image segmentation with tree‐based registration. NeuroImage 2012;59:422–430. [DOI] [PMC free article] [PubMed] [Google Scholar]
- 32. Asman AJ, Bryan FW, Smith SA, Reich DS, Landman BA. Groupwise multi‐atlas segmentation of the spinal cord's internal structure. Med Image Anal 2014;18:460–471. [DOI] [PMC free article] [PubMed] [Google Scholar]
- 33. Cao Y, Li X, Yan P. Multi‐atlas based image selection with label image constraint In: 11th International Conference on Machine Learning and Applications (ICMLA) 2012;311–316. [Google Scholar]
- 34. Sled JG, Zijdenbos AP, Evans AC. A nonparametric method for automatic correction of intensity nonuniformity in MRI data. IEEE Trans Med Imaging 1998;17:87–97. [DOI] [PubMed] [Google Scholar]
- 35. Karchemskiy A, Garrett A, Howe M, et al. Amygdalar, hippocampal, and thalamic volumes in youth at high risk for development of bipolar disorder. Psychiatry Res 2011;194:319–325. [DOI] [PMC free article] [PubMed] [Google Scholar]
- 36. Tong T, Wolz R, Coupé P, Hajnal JV, Rueckert D. Segmentation of MR images via discriminative dictionary learning and sparse coding: Application to Hippocampus labeling. NeuroImage 2013;76:11–23. [DOI] [PubMed] [Google Scholar]
- 37. Pipitone J, Park MTM, Winterburn J, et al. Multi‐atlas segmentation of the whole hippocampus and subfields using multiple automatically generated templates. NeuroImage 2014;101:494–512. [DOI] [PubMed] [Google Scholar]
- 38. Jenkinson M, Smith S. A global optimisation method for robust affine registration of brain images. Med Image Anal 2001;5:143–156. [DOI] [PubMed] [Google Scholar]
- 39. Tenenbaum JB, De Silva V, Langford JC. A global geometric framework for nonlinear dimensionality reduction. Science 2000;290:2319–2323. [DOI] [PubMed] [Google Scholar]
- 40. Morra JH, Tu Z, Apostolova LG, et al. Validation of a fully automated 3D hippocampal segmentation method using subjects with Alzheimer's disease mild cognitive impairment, and elderly controls. NeuroImage 2008;43:59–68. [DOI] [PMC free article] [PubMed] [Google Scholar]
- 41. Wang L, Gao Y, Shi F, et al. LINKS: Learning‐based multi‐source IntegratioN frameworK for Segmentation of infant brain images. NeuroImage 2015;108:160–172. [DOI] [PMC free article] [PubMed] [Google Scholar]
- 42. Wang H, Yushkevich PA. Spatial bias in multi‐atlas based segmentation In: IEEE Conference on Computer Vision and Pattern Recognition (CVPR), 2012;909–916. [DOI] [PMC free article] [PubMed] [Google Scholar]
- 43. Martin Bland J, Altman D. Statistical methods for assessing agreement between two methods of clinical measurement. Lancet 1986;327:307–310. [PubMed] [Google Scholar]
- 44. Cohen J. Statistical power analysis for the behavioral sciences. Hillsdale, NJ, England: L. Erlbaum Associates, 1988. [Google Scholar]
- 45. Heckemann RA, Keihaninejad S, Aljabar P, Rueckert D, Hajnal JV, Hammers A. Improving intersubject image registration using tissue‐class information benefits robustness and accuracy of multi‐atlas based anatomical segmentation. NeuroImage 2010;51:221–227. [DOI] [PubMed] [Google Scholar]
- 46. Collins DL, Pruessner JC. Towards accurate, automatic segmentation of the hippocampus and amygdala from MRI by augmenting ANIMAL with a template library and label fusion. NeuroImage 2010;52:1355–1366. [DOI] [PubMed] [Google Scholar]
- 47. Chupin M, Mukuna‐Bantumbakulu AR, Hasboun D, et al. Anatomically constrained region deformation for the automated segmentation of the hippocampus and the amygdala: Method and validation on controls and patients with Alzheimer's disease. NeuroImage 2007;34:996–1019. [DOI] [PubMed] [Google Scholar]
- 48. Khan AR, Cherbuin N, Wen W, Anstey KJ, Sachdev P, Beg MF. Optimal weights for local multi‐atlas fusion using supervised learning and dynamic information (SuperDyn): Validation on hippocampus segmentation. NeuroImage 2011;56:126–139. [DOI] [PubMed] [Google Scholar]
- 49. van der Lijn F, den Heijer T, Breteler MM, Niessen WJ. Hippocampus segmentation in MR images using atlas registration, voxel classification, and graph cuts. NeuroImage 2008;43:708–720. [DOI] [PubMed] [Google Scholar]
- 50. Kim H, Mansi T, Bernasconi N, Bernasconi A. Surface‐based multi‐template automated hippocampal segmentation: Application to temporal lobe epilepsy. Med Image Anal 2012;16:1445–1455. [DOI] [PubMed] [Google Scholar]
- 51. Hu S, Coupé P, Pruessner JC, Collins DL. Nonlocal regularization for active appearance model: Application to medial temporal lobe segmentation. Hum Brain Mapp 2014;35:377–395. [DOI] [PMC free article] [PubMed] [Google Scholar]
- 52. Wang H, Das SR, Suh JW, et al. A learning‐based wrapper method to correct systematic errors in automatic image segmentation: Consistently improved performance in hippocampus, cortex and brain segmentation. NeuroImage 2011;55:968–985. [DOI] [PMC free article] [PubMed] [Google Scholar]
- 53. Hao Y, Zhang X, Duan Y, Yu C, Jiang T, Fan Y. Local Label Learning (LLL) for subcortical structure segmentation. Hum Brain Mapp 2014;35:2674–2697. [DOI] [PMC free article] [PubMed] [Google Scholar]
- 54. Wang H, Pouch A, Takabe M, et al. Multi‐atlas segmentation with robust label transfer and label fusion In: Gee J, Joshi S, Pohl K, Wells W, Zöllei L, editors. Inf Process Med Imaging. Berlin, Heidelberg: Springer, 2013;548–559. [DOI] [PMC free article] [PubMed] [Google Scholar]
- 55. Tsai D‐M, Lin C‐T. Fast normalized cross correlation for defect detection. Pattern Recognit Lett 2003;24:2625–2631. [Google Scholar]
- 56. Wells WM, Viola P, Atsumi H, Nakajima S, Kikinis R. Multi‐modal volume registration by maximization of mutual information. Med Image Anal 1996;1:35–51. [DOI] [PubMed] [Google Scholar]
- 57. Belkin M, Niyogi P. Laplacian eigenmaps for dimensionality reduction and data representation. Neural Comput 2003;15:1373–1396. [Google Scholar]
- 58. Roweis ST, Saul LK. Nonlinear dimensionality reduction by locally linear embedding. Science 2000;290:2323–2326. [DOI] [PubMed] [Google Scholar]