Summary
Introduction
Gliomas are the most common primary brain tumors in adults and a significant cause of cancer‐related mortality. A 9‐gene signature was identified as a novel prognostic model reflecting survival situation obviously in gliomas.
Aims
To identify an mRNA expression signature to improve outcome prediction for patients with different glioma grades.
Results
We used whole‐genome mRNA expression microarray data of 220 glioma samples of all grades from the Chinese Glioma Genome Atlas (CGGA) database (http://www.cgga.org.cn) as a discovery set and data from Rembrandt and GSE16011 for validation sets. Data from every single grade were analyzed by the Kaplan–Meier method with a two‐sided log‐rank test. Univariate Cox regression and linear risk score formula were applied to derive a gene signature with better prognostic performance. We found that patients who had high risk score according to the signature had poor overall survival compared with patients who had low risk score. Highly expressed genes in the high‐risk group were analyzed by gene ontology (GO) and gene set variation analysis (GSVA). As a result, the reason for the divisibility of gliomas was likely due to cell life processes and adhesion.
Conclusion
This 9‐gene‐signature prediction model provided a more accurate predictor of prognosis that denoted patients with high risk score have poor outcome. Moreover, these risk models based on defined molecular profiles showed the considerable prospect in personalized cancer management.
Keywords: Biomarker, Gliomas, mRNA, Prognosis, Risk score
Introduction
Gliomas are the most common primary central nervous system tumor, which remain one of the most challenging diseases in humans with considerable mortality and posttreatment morbidity 1. Patients with newly diagnosed glioblastoma multiforme (GBM) have a median survival of approximately 1 year, with generally poor responses to all therapies. As such, scientific and clinical advances are required. Although adjuvant radiotherapy and chemotherapy improves survival, death occurs inevitably from either recurrent or progressive disease 2.
Introduction of molecular biomarkers in the management of patients with cancer may improve their clinical outcomes. Many biomarker candidates have been generated by high‐throughput technologies such as microarray gene expression profiling 3, which is a powerful and promising method for evaluating the expression of a large number of genes and evaluating changes in genome‐wide expression. The gene expression pattern of the primary tumor has been shown to predict the outcome for several malignancies, including lung cancer, head and neck cancer, and breast cancer. Numerous genes have been discovered to be important in the management of gliomas, with changes in gene expression having a close relationship with patient prognosis. However, it is unclear whether a signature is available to predict clinical outcomes in patients in every grade in Chinese population. In the present study, we utilized mRNA expression profiling of gliomas to identify a signature that could successfully divide patients into two groups with different overall survival.
Methods
Datasets
Whole‐genome mRNA expression microarray data were deposited from the Chinese Glioma Genome Atlas (CGGA) database 4 as a training set, and the following two datasets were obtained for validation: Repository for Molecular Brain Neoplasis Data (REMBRANDT, http://caintegrator.nci.nih.gov/rembrandt) and GSE16011 data (http://www.ncbi.nlm.nih.gov/geo/query/acc.cgi?acc=GSE16011).
Statistical Analysis
In those 220 glioma samples of all grades from the CGGA database, there were 97 grade II tumors, 34 grade III tumors, and 89 GBMs. Overall survival time (OS) was defined as the interval from the date of diagnosis to death or the last follow‐up. The prognostic difference of patients with high or low expression of a certain gene (higher or lower than the median value) was calculated by the Kaplan–Meier method with the two‐sided log‐rank test by two packages (survival and KMsurv) of R. The number of significant genes (P < 0.05) was 1095, 3397, and 1906 in grade II, III, and IV, respectively. We then chose the overlap of the three groups of genes above. As a result, nine genes remained, which were used for signature development.
To investigate the effectiveness of these nine genes as a mRNA‐based gene signature for clinical outcome prediction, a mathematical formula for survival prediction was constructed. More specifically, we assigned each patient a risk score according to a linear combination of the expression level of the mRNAs, weighted by the regression coefficients derived from the univariate Cox regression analyses 5. From our nine‐gene signature, the risk score for each patient was calculated as follows:
Patients having higher risk scores are expected to have shorter overall survival. We divided patients in the training dataset into high‐risk and low‐risk groups using the median mRNA signature risk score as the cutoff point. With regard to the validation sets, we used the same β. Considering genes with multiple probes, we calculated their average expression value and then subsequently excluded samples without prognostic information. The Kaplan–Meier method was used to estimate overall survival, and the differences in survival between high‐risk and the low‐risk patients were analyzed using the two‐sided log‐rank test.
Gene Ontology (GO) Analysis of Associated Genes in Every Grade
Significant analysis of microarray (SAM)was performed in every grade of gliomas identifying the differently expressed genes, and then, GO analysis of the top 3000 genes, highly expressed in the high‐risk group, was performed using DAVID 6 for function annotation (Table 1).
Table 1.
Ten gene ontology (GO) terms of associated genes in every grade
| Name | Count | P‐Value | Grade |
|---|---|---|---|
| GO:0060284~regulation of cell development | 39 | 0.010906 | II |
| GO:0010721~negative regulation of cell development | 13 | 0.015282171 | II |
| GO:0022403~cell cycle phase | 150 | 1.21E‐32 | III |
| GO:0007049~cell cycle | 222 | 1.15E‐30 | III |
| hsa04510~focal adhesion | 58 | 4.78E‐07 | III |
| GO:0042981~regulation of apoptosis | 146 | 6.89E‐05 | III |
| GO:0006915~apoptosis | 99 | 0.020368 | III |
| GO:0006350~transcription | 333 | 1.10E‐08 | IV |
| GO:0007049~cell cycle | 269 | 5.49E‐65 | IV |
| GO:0000278~mitotic cell cycle | 171 | 2.47E‐61 | IV |
Gene Set Variation Analysis (GSVA) with Gene Lists Expression
For another functional annotation, we also conducted GSVA by GSVA package 7 of R. Gene lists were from the following GO terms: 0000084, 0000236, 0043065, 0005925, 0045773, 0050771, and 0042789.
Results
Identification of 9‐Gene Signature and its Association with Survival and Expression from the Training Set
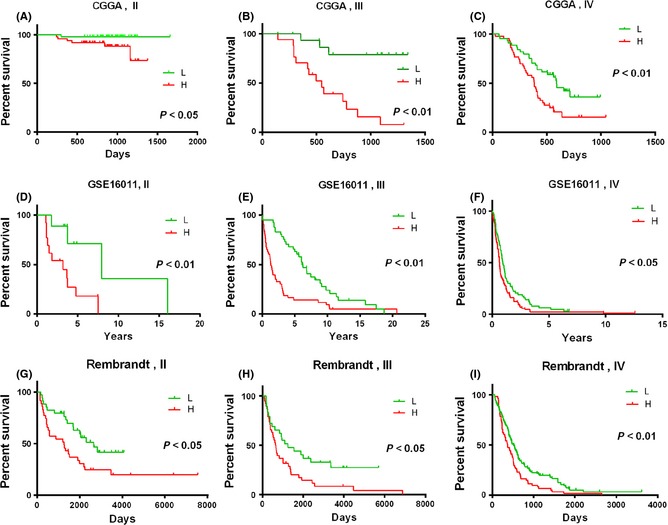
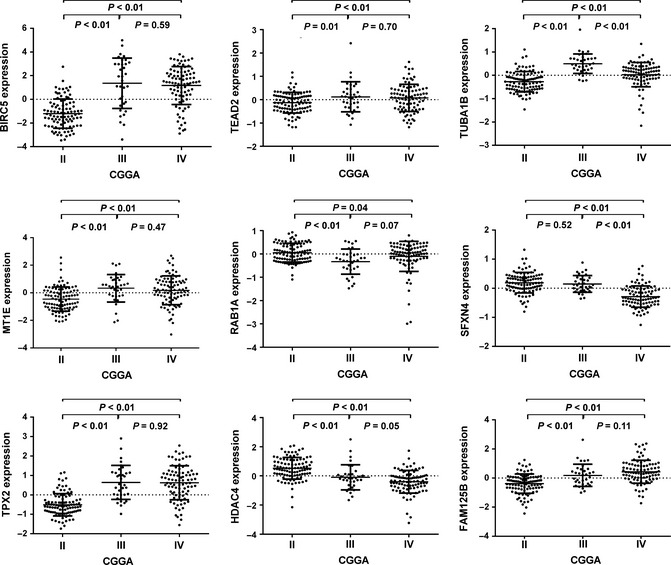
In the 220 glioma samples of all grades, we used a two‐sided log‐rank test to analyze each grade mRNA expression microarray data in the training set and identified nine genes that were the overlap of gene lists in each grade that were significantly associated with OS (P < 0.05, Table 2). We then applied the nine genes to develop a signature using the risk score method. The risk score was calculated for each of the 220 patients in the training set, and patients in every grade were then successfully divided into a high‐risk group and a low‐risk group based on the cutoff value (median risk score). We observed that patients in the high‐risk group had a shorter median OS than those in the low‐risk group (Figure 1A–C). Subsequently, we also found that nine genes were significantly differently expressed from II to IV grade (Figure 2).
Table 2.
Nine genes associated significantly with overall survival time (OS)
| Symbol | Hazard ratio | Parametric P‐value |
|---|---|---|
| BIRC5 | 1.653 | <0.001 |
| TEAD2 | 2.382 | <0.001 |
| TUBA1B | 2.942 | <0.001 |
| MT1E | 1.365 | 0.004 |
| RAB1A | 0.584 | 0.001 |
| SFXN4 | 0.22 | <0.001 |
| TPX2 | 2.588 | <0.001 |
| HDAC4 | 0.548 | <0.001 |
| FAM125B | 2.447 | <0.001 |
Figure 1.

These Kaplan–Meier estimates of overall survival in patients with each grade glioma were constructed by the signature. P‐values are indicated for the high‐risk and low‐risk groups stratified according to the signature risk score in the Chinese Glioma Genome Atlas (CGGA) data (A, B, and C), the GSE16011 data (D, E, and F), and the Rambrandt data (G, H, and I). H, high‐risk group; L, low‐risk group.
Figure 2.

The expression difference of 9‐gene signature in Chinese Glioma Genome Atlas (CGGA) dataset. A single spot was the gene expression value of an individual patient. Lines in the middle were the mean expression value.
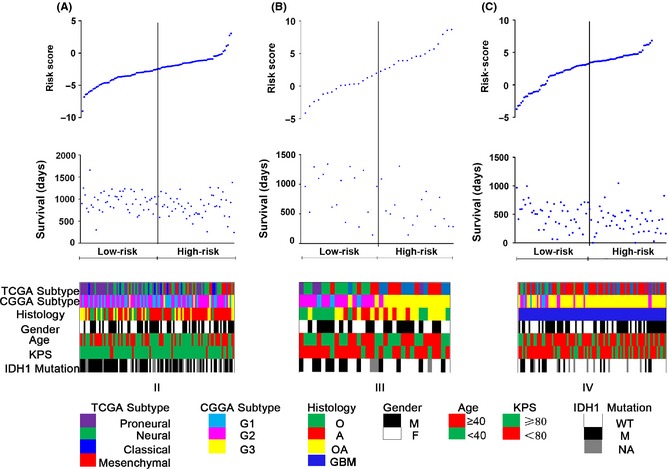
The related clinical information such as The Cancer Genome Atlas (TCGA) and CGGA subtype, which were annotated as previously reported 4, was listed as well as the isocitrate dehydrogenase (IDH) mutation status, histology, gender, age, Karnofsky performance status (KPS), which were obtained from CGGA database, some parameters also had a corresponding trend from low risk score to high risk score. Patients with high risk scores obviously appeared to display G3 and wild‐type IDH1 accumulation, and patients with low risk scores tended to show G1, G2, and IDH1 mutation accumulation. Patients with low risk scores had longer OS than those with high risk scores (Figure 3).
Figure 3.

Analysis of the signature risk score is illustrated for patients from grade II to IV (A, B, and C), including (Top) signature risk score distribution, (Middle) patient survival duration, and (Bottom) clinical and molecular information.
Confirmation of the Prognostic Value of the Gene Signature in Validation Sets
For validation, we downloaded the whole‐genome mRNA expression profiling of glioma patients from Rembrandt and GSE16011. With the remaining 319 and 256 glioma patients in the two datasets, we then used the same risk score formula obtained from the training set to get a risk score for each individual in each respective situation. In each grade, patients were divided into the high‐risk and low‐risk groups in line with the risk score, which was higher or lower than the cutoff. The prognostic value of the signature was validated in both of the datasets (Figure 1D–I).
Functional Annotation of the Signature
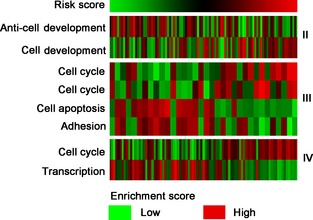
Using GO analysis, we found that the associated genes, which were obtained from those highly expressed in the high‐risk group, were mainly associated with evolution of cell life and adhesion. We also performed GSVA that showed that patients with a higher risk score tended to have a lower expression of anticell development‐, cell apoptosis‐ and adhesion‐, transcription‐associated genes, and a higher expression of regulation of cell development‐, mitotic cell cycle‐associated genes in each grade, respectively (Figure 4). These data may explain the different prognoses of the two groups divided by the signature.
Figure 4.

Gene set variation analysis samples from Chinese Glioma Genome Atlas (CGGA). The risk score (upper) was calculated with the formula described above and ranked from left to right. Gene set enrichment scores (lower) of cell cycle, development, apoptosis, adhere, and transcription were analyzed by gene set variation analysis (GSVA) package of R. Patients with high risk score tended to have a lower expression of anticell development (II), cell apoptosis and adhesion (III), transcription (IV), and higher expression of cell development (II), cell cycle (III), the first cell cycle denotes “phase of cell cycle”, and the second one means “mitotic prometaphase” (IV).
Gene Function Interpretation
The nine genes used in our signature were RAB1A, BIRC5, TEAD2, TUBA1B, MT1E, SFXN4, TPX2, HDAC4, and FAM125B. We found that the majority of these genes have similar functions including cell development, apoptosis, proliferation, and migration.
RAB1A is a member of the Rab family of small GTPases with a well‐characterized function in the regulation of vesicle trafficking from the endoplasmic reticulum to the Golgi apparatus and within Golgi compartments 8.
BIRC5 is preferentially expressed in human cancer cells and has multiple functions, including the inhibition of cell apoptosis 9, control of the cell cycle 10, 11, promotion of tumor angiogenesis 12, 13 resistance to chemotherapy or radiotherapy 14, acceleration of metastasis and recurrence 15, and regulation of cancer cell autophagy 16, all of which favor cancer cell survival and tumor maintenance.
TEAD2 encodes a protein that regulates a wide range of developmental processes, including skeletal and cardiac muscle development, skeletal muscle regeneration, neural crest development, and notochord development 17, 18, 19, 20, 21. The major roles of Tead2 appear to be the promotion of cell proliferation and suppression of cell death.
TUBA1B was more highly expressed in hepatocellular carcinoma (HCC) tumor tissues than in adjacent nontumor tissues, which was a significant predictor for poor overall survival of HCC patients 22.
MT1E (Metallothionein 1E) has been found to be highly expressed in motile cell lines and can enhance the migration and invasion of human glioma cells by inducing MMP‐9 inactivation via the upregulation of NF‐κB p50 23.
SFXN4 (comprising SFXN4a and SFXN4b) is widely expressed in almost all tissues examined, which suggests that functional redundancy is likely 24.
TPX2 is a mitotic regulator involved in the formation of the mitotic spindle and in oncogene‐induced mitotic stress. This protein is frequently overexpressed in human cancer, and its deregulation may participate in chromosome numeric aberrations as well as other forms of genomic instability in cancer cells 25.
HDAC4 (histone deacetylase 4) belongs to a class IIa of histone deacetylases, which are important regulators of gene expression, and controls pleiotropic cellular functions 26. HDAC4 was found to impinge on multiple and apparently contradictory cellular fates, including differentiation, apoptosis, survival, cell growth, and proliferation. HDAC4 is massively expressed in the proliferative compartment of the colon, and is downregulated during intestinal differentiation 27.
FAM125B is a component of the ESCRT‐I complex, a heterotetramer, which mediates the sorting of ubiquitinated cargo protein from the plasma membrane to the endosomal vesicle. However, it is unknown whether there is any correlation between its function and human tumors.
Discussion
As a common fatal central nervous system tumor, gliomas are diagnosed by histopathological criteria. The robust prognostic factors for the majority of these tumors are limited to tumor grade and gene variation. In recent years, the molecular classification of gliomas has developed rapidly. Several groups have reported classification systems based on mRNA expression 27, 28, 29, microRNA expression 3, or methylation 30, 31, and the majority of the classification systems are focused on mRNA expression. We hypothesized that a set of genes or gene profile would be predictive of survival after surgical resection in patients with glioma. The main objective of the present study was to evaluate the gene expression profiles, identify genes associated with outcome, and build a gene expression signature based on the risk score method to assess high‐ and low‐risk patients. Hence, we investigated the mRNA expression profile of CGGA data to identify a prognostic signature and found that patients with a high risk score had a poor survival time compared with patients who had a low risk score.
By GO and GSVA analysis, we inferred that the divisibility of glioma patients is likely related to cell life processes and adhesion. However, only MT1E that can enhance the migration and invasion of human gliomas cell had been published in gliomas. So, the other genes need us to further explore.
Accurate staging before treatment is important and facilitates the selection of appropriate treatment strategies. Despite improvements, however, the current clinical staging modalities have not proved very accurate 32, 33, 34. A better understanding of the biological behavior of a tumor will help to determine appropriate therapies, with the potential to improve the outcomes of patients with gliomas.
The analysis of the gene expression profiles associated with different outcomes may be useful for the careful selection of therapies and could also aid in tailoring treatment to the individual patient 36, 37.
Additionally, this approach may help to reduce the complexity and dimensionality of genomic data to provide biological insights that may translate into improved management of gliomas.
These observations lay the foundation for future development of a mechanistically based molecular risk estimation model in high‐grade gliomas. The signature might lend itself better to translation into clinical practice for two reasons. First, while the expression of an individual gene can vary over short periods of time in cancers, a gene signature is more static and more amenable to predictive screens. Second, the highly expressed genes of the signature in human cancers were associated with promotion of cell proliferation and enhancing cell migration, invasion, and frequency of genetic mutation. Further, in complex glioblastoma tumors, it is considered that multiple, rather than single, genes drive the disease process.
Conflict of Interest
The authors declare no conflict of interest.
Acknowledgments
This work was supported by grants from National High Technology Research and Development Program (No. 2012AA02A508), International Science and Technology Cooperation Program (No. 2012DFA30470), and National Natural Science Foundation of China (No. 91229121, 81272804, 81071011).
The first three authors contributed equally to this work.
Reference
- 1. Mischel PS, Cloughesy TF. Targeted molecular therapy of GBM. Brain Pathol 2003;13:52–61. [DOI] [PMC free article] [PubMed] [Google Scholar]
- 2. Wang Y, Jiang T. Understanding high grade glioma: molecular mechanism, therapy and comprehensive management. Cancer Lett 2013;331:139–146. [DOI] [PubMed] [Google Scholar]
- 3. Zhang W, Zhang J, Yan W, et al. Whole‐genome microRNA expression profiling identifies a 5‐microRNA signature as a prognostic biomarker in Chinese patients with primary glioblastoma multiforme. Cancer 2013;119:814–824. [DOI] [PubMed] [Google Scholar]
- 4. Verhaak RG, Hoadley KA, Purdom E, et al. Integrated genomic analysis identifies clinically relevant subtypes of glioblastoma characterized by abnormalities in PDGFRA, IDH1, EGFR, and NF1. Cancer Cell 2010;17:98–110. [DOI] [PMC free article] [PubMed] [Google Scholar]
- 5. Lossos IS, Czerwinski DK, Alizadeh AA, et al. Prediction of survival in diffuse large‐B‐cell lymphoma based on the expression of six genes. N Engl J Med 2004;350:1828–1837. [DOI] [PubMed] [Google Scholar]
- 6. da Huang W, Sherman BT, Lempicki RA. Systematic and integrative analysis of large gene lists using DAVID bioinformatics resources. Nat Protoc 2009;4:44–57. [DOI] [PubMed] [Google Scholar]
- 7. Hanzelmann S, Castelo R, Guinney J. GSVA: gene set variation analysis for microarray and RNA‐Seq data. BMC Bioinformatics 2013;14:7. [DOI] [PMC free article] [PubMed] [Google Scholar]
- 8. Wang C, Yoo Y, Fan H, Kim E, Guan KL, Guan JL. Regulation of Integrin beta 1 recycling to lipid rafts by Rab1a to promote cell migration. J Biol Chem 2010;285:29398–29405. [DOI] [PMC free article] [PubMed] [Google Scholar]
- 9. Yamamoto H, Ngan CY, Monden M. Cancer cells survive with survivin. Cancer Sci 2008;99:1709–1714. [DOI] [PMC free article] [PubMed] [Google Scholar]
- 10. Kanwar JR, Kamalapuram SK, Kanwar RK. Targeting survivin in cancer: patent review. Expert Opin Ther Pat 2010;20:1723–1737. [DOI] [PubMed] [Google Scholar]
- 11. Ryan BM, O'Donovan N, Duffy MJ. Survivin: a new target for anti‐cancer therapy. Cancer Treat Rev 2009;35:553–562. [DOI] [PubMed] [Google Scholar]
- 12. Wobser M, Keikavoussi P, Kunzmann V, Weininger M, Andersen MH, Becker JC. Complete remission of liver metastasis of pancreatic cancer under vaccination with a HLA‐A2 restricted peptide derived from the universal tumor antigen survivin. Cancer Immunol Immunother 2006;55:1294–1298. [DOI] [PMC free article] [PubMed] [Google Scholar]
- 13. O'Connor DS, Schechner JS, Adida C, et al. Control of apoptosis during angiogenesis by survivin expression in endothelial cells. Am J Pathol 2000;156:393–398. [DOI] [PMC free article] [PubMed] [Google Scholar]
- 14. Gimenez‐Bonafe P, Tortosa A, Perez‐Tomas R. Overcoming drug resistance by enhancing apoptosis of tumor cells. Curr Cancer Drug Targets 2009;9:320–340. [DOI] [PubMed] [Google Scholar]
- 15. Andersen MH, Svane IM, Becker JC, Straten PT. The universal character of the tumor‐associated antigen survivin. Clin Cancer Res 2007;13:5991–5994. [DOI] [PubMed] [Google Scholar]
- 16. Cheung CH, Cheng L, Chang KY, Chen HH, Chang JY. Investigations of survivin: the past, present and future. Front Biosci (Landmark Ed) 2011;16:952–961. [DOI] [PubMed] [Google Scholar]
- 17. Gupta MP, Amin CS, Gupta M, Hay N, Zak R. Transcription enhancer factor 1 interacts with a basic helix‐loop‐helix zipper protein, Max, for positive regulation of cardiac alpha‐myosin heavy‐chain gene expression. Mol Cell Biol 1997;17:3924–3936. [DOI] [PMC free article] [PubMed] [Google Scholar]
- 18. Karasseva N, Tsika G, Ji J, Zhang A, Mao X, Tsika R. Transcription enhancer factor 1 binds multiple muscle MEF2 and A/T‐rich elements during fast‐to‐slow skeletal muscle fiber type transitions. Mol Cell Biol 2003;23:5143–5164. [DOI] [PMC free article] [PubMed] [Google Scholar]
- 19. Milewski RC, Chi NC, Li J, Brown C, Lu MM, Epstein JA. Identification of minimal enhancer elements sufficient for Pax3 expression in neural crest and implication of Tead2 as a regulator of Pax3. Development 2004;131:829–837. [DOI] [PubMed] [Google Scholar]
- 20. Sawada A, Nishizaki Y, Sato H, et al. Tead proteins activate the Foxa2 enhancer in the node in cooperation with a second factor. Development 2005;132:4719–4729. [DOI] [PubMed] [Google Scholar]
- 21. Gupta M, Kogut P, Davis FJ, Belaguli NS, Schwartz RJ, Gupta MP. Physical interaction between the MADS box of serum response factor and the TEA/ATTS DNA‐binding domain of transcription enhancer factor‐1. J Biol Chem 2001;276:10413–10422. [DOI] [PubMed] [Google Scholar]
- 22. Lu C, Zhang J, He S, et al. Increased alpha‐Tubulin1b expression indicates poor prognosis and resistance to chemotherapy in hepatocellular carcinoma. Dig Dis Sci 2013. [Epub ahead of print]. [DOI] [PubMed] [Google Scholar]
- 23. Ryu HH, Jung S, Jung TY, et al. Role of metallothionein 1E in the migration and invasion of human glioma cell lines. Int J Oncol 2012;41:1305–1313. [DOI] [PubMed] [Google Scholar]
- 24. Zheng H, Ji C, Zou X, et al. Molecular cloning and characterization of a novel human putative transmembrane protein homologous to mouse sideroflexin associated with sideroblastic anemia. DNA Seq 2003;14:369–373. [DOI] [PubMed] [Google Scholar]
- 25. Perez de Castro I, Malumbres M. Mitotic stress and chromosomal instability in cancer: the case for TPX2. Genes Cancer 2012;3:721–730. [DOI] [PMC free article] [PubMed] [Google Scholar]
- 26. Cernotta N, Clocchiatti A, Florean C, Brancolini C. Ubiquitin‐dependent degradation of HDAC4, a new regulator of random cell motility. Mol Biol Cell 2011;22:278–289. [DOI] [PMC free article] [PubMed] [Google Scholar]
- 27. Rao V, Al‐Weshahy A. Plant‐based diets and control of lipids and coronary heart disease risk. Curr Atheroscler Rep 2008;10:478–485. [DOI] [PubMed] [Google Scholar]
- 28. Yan W, Zhang W, You G, et al. Molecular classification of gliomas based on whole genome gene expression: a systematic report of 225 samples from the Chinese Glioma Cooperative Group. Neuro Oncol 2012;14:1432–1440. [DOI] [PMC free article] [PubMed] [Google Scholar]
- 29. Phillips HS, Kharbanda S, Chen R, et al. Molecular subclasses of high‐grade glioma predict prognosis, delineate a pattern of disease progression, and resemble stages in neurogenesis. Cancer Cell 2006;9:157–173. [DOI] [PubMed] [Google Scholar]
- 30. Li A, Walling J, Ahn S, et al. Unsupervised analysis of transcriptomic profiles reveals six glioma subtypes. Cancer Res 2009;69:2091–2099. [DOI] [PMC free article] [PubMed] [Google Scholar]
- 31. Noushmehr H, Weisenberger DJ, Diefes K, et al. Identification of a CpG island methylator phenotype that defines a distinct subgroup of glioma. Cancer Cell 2010;17:510–522. [DOI] [PMC free article] [PubMed] [Google Scholar]
- 32. Zhang W, Yan W, You G, et al. Genome‐wide DNA methylation profiling identifies ALDH1A3 promoter methylation as a prognostic predictor in G‐CIMP‐ primary glioblastoma. Cancer Lett 2013;328:120–125. [DOI] [PubMed] [Google Scholar]
- 33. Luketich JD, Friedman DM, Weigel TL, et al. Evaluation of distant metastases in esophageal cancer: 100 consecutive positron emission tomography scans. Ann Thorac Surg 1999;68:1133–1136; discussion 1136–7. [DOI] [PubMed] [Google Scholar]
- 34. Kaushik N, Khalid A, Brody D, Luketich J, McGrath K. Endoscopic ultrasound compared with laparoscopy for staging esophageal cancer. Ann Thorac Surg 2007;83:2000–2002. [DOI] [PubMed] [Google Scholar]
- 35. May A, Gunter E, Roth F, et al. Accuracy of staging in early oesophageal cancer using high resolution endoscopy and high resolution endosonography: a comparative, prospective, and blinded trial. Gut 2004;53:634–640. [DOI] [PMC free article] [PubMed] [Google Scholar]
- 36. Quackenbush J. Microarray analysis and tumor classification. N Engl J Med 2006;354:2463–2472. [DOI] [PubMed] [Google Scholar]
- 37. Shimada Y, Sato F, Shimizu K, Tsujimoto G, Tsukada K. cDNA microarray analysis of esophageal cancer: discoveries and prospects. Gen Thorac Cardiovasc Surg 2009;57:347–356. [DOI] [PubMed] [Google Scholar]


