ABSTRACT
Objective: The oral microbiota is associated with the risk of type 2 diabetes (T2D), but the relationship between the oral microbiota and disease progression in the elderly population remains to be determined.
Design: In our study, we recruited 150 elderly Chinese residents and divided them into three groups according to their fasting glucose (FG) level: normal (N), high (H), and very high (VH). Their biochemical indexes were analyzed using blood samples. Saliva samples were collected and the oral microbiome was profiled by high-throughput sequencing of the V3-V4 area of the 16S rRNA gene.
Result: Our results revealed that the VH group showed deterioration of the metabolic phenotype and dysbiosis of the oral microbiota simultaneously when compared to the other two groups. Furthermore, potential disease-associated bacterial genera including Leptotrichia, Staphylococcus, Catonella, and Bulleidia were significantly enriched in the VH group.
Conclusions: These results suggest that dysbiosis of the oral microbiota may be a typical feature of hyperglycemia and might also contribute to disease aggravation in the progression of hyperglycemias.
KEYWORDS: Hyperglycemia, oral microbiome, high-throughput sequencing, fasting glucose, Chinese elderly
Introduction
Type 2 Diabetes (T2D) has become one of the most prevalent metabolic diseases throughout the world that has induced a serious public health crisis [1]. The main characteristics of diabetes are insulin resistance and hyperglycemia, which lead to systemic deterioration and various complications [2]. During the progression of hyperglycemia, the identification of disease signatures for each stage is crucial for comprehensive assessment and control of hyperglycemia.
Recently, growing evidences suggest that the human microbiota plays a crucial role in the onset and progression of many metabolic diseases associated with inflammation and insulin resistance, such as T2D, obesity, and non-alcoholic fatty liver disease [3–5]. The oral cavity is the gateway of the digestive tract, and the oral microbiota is the second most complex microbiota in the human body [6]. Therefore, the oral microbiota represents a relevant target for further investigation. Prior studies have revealed a structural shift in the oral microbiome in patients with diabetes compared to healthy controls [7,8]. The dysbiosis of the oral microbiota is highly associated with the development of periodontal disease, which can induce higher level of inflammation locally and systemically, and then contribute to aggravation of hyperglycemia [9]. Therefore, a bidirectional relationship has been proposed between hyperglycemia and oral health [10]. However, the oral microbial signatures for the progression of hyperglycemia are still vague. Therefore, further studies are needed to identify specific oral microbial signatures in diabetes etiology. Here, we examined the oral microbiota during the progression of hyperglycemia. Oral microbial signatures associated with hyperglycemia might be useful for pre-diagnosis and risk assessment of diabetes.
Material and methods
Study group
We conducted a community-based cross-sectional study of an elderly population in Shanghai, China. A total of 216 subjects, who were older than 60 years and local to Shanghai were originally recruited from the Zhangjiang and Beicai Community Health Service Center. The exclusion criteria were: (1) subjects with mental disorders, malignant tumors, and serious diseases; (2) antibiotic usage during the last three months; (3) refused to sign or comply with the written information. Following the exclusion criteria, 150 subjects were finally included in this study. A flow diagram of the study design and the subject inclusion/exclusion criteria are shown in Figure 1. The study was performed according to the guidelines of the Helsinki Declaration and approved by the Ethics Committee of the Shanghai University of Traditional Chinese Medicine.
Figure 1.
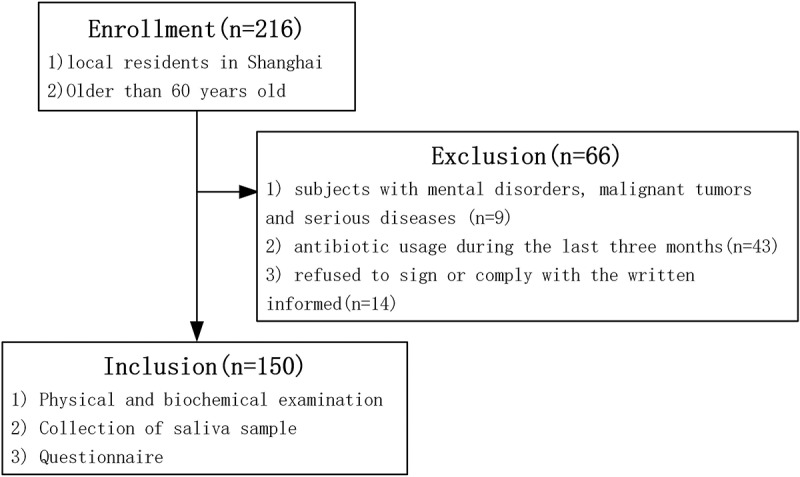
Flow diagram for the study design and subject recruitment.
Clinical investigation
Body weight and height were measured using an electronic instrument (Shengyuan; Zhengzhou, China) to calculate body mass index (BMI). Blood samples were collected after overnight fasting. Fasting plasma glucose (FPG), triglyceride, total cholesterol, high-density lipoprotein (HDL), low-density lipoprotein (LDL), alanine aminotransferase (ALT), aspartate aminotransferase (AST), white blood cells (WBCs), and monocyte count were measured using an automatic biochemistry analyzer (Hitachi, Tokyo, Japan). Routine blood tests were performed on a blood cell analyzer BC-2800 (Mairui, Shenzhen, China). Saliva samples were collected from all the subjects under 12 h of fasting and without tooth brushing, food intake, or smoking. All samples were immediately frozen on dry ice upon collection and stored at −80°C until further analysis. Life style and diabetes history of the subjects were collected using a questionnaire.
DNA extraction and 16S rRNA gene sequencing
Total microbial DNA was extracted from the saliva samples using the Fast DNA SPIN extraction kits (MP Biomedicals, Santa Ana, CA), according to the manufacturer’s instructions. Quantity and quality of the extracted DNA were determined using a NanoDrop ND-1000 spectrophotometer (Thermo Fisher Scientific, Waltham, MA) and agarose gel electrophoresis. A sequencing library of the 16S rRNA gene V3-V4 region was constructed using the following primers: primer 338F: 5ʹ-ACTCCTACGGGAGGCAGCA-3ʹ and 806R: 5ʹ-GGACTACHVGGGTWTCTAAT-3ʹ. Sequencing was done by using an Illumina MiSeq platform at Shanghai Personal Biotechnology Co., Ltd (Shanghai, China).
Analysis of oral microbiota data
The raw reads after sequencing were filtered to obtain high-quality reads. The data were analyzed using the QIIME (V1.8.0) pipeline {Caporaso, 2010 #644}[11]. The high-quality sequences were clustered into operational taxonomic units (OTUs) at 97% identity using UCLUST. OTU taxonomy was identified by BLAST based on the Greengenes Database. Partial least squares discriminant analysis (PLS-DA) was used as a model to illustrate the oral microbiota variation among the three groups in R package (V3.2.0). Differences based on Bray-Curtis distance of the whole microbiome structure among groups were calculated using a multivariate analysis of variance (MANOVA). Linear discriminant analysis effect size (LEfSe) was introduced to detect differential abundant genera among groups using non-parametric factorial Kruskal-Wallis (KW) sum-rank test to detect features with significant differential abundance and Linear Discriminant Analysis (LDA) to estimate the effect size of each differentially abundant feature [12]. The differential features with a LDA score higher than 2 were considered significant between groups.
Statistical analyses
Statistical analysis was carried out using Prism (GraphPad, CA). Student t-test or Mann–Whitney test was used for detecting variation of clinical parameters among groups, depending on the data distribution. Chi-square test was applied to examine sex ratio, smoking, and drinking among groups. *P < 0.05, **P < 0.01.
Results
Hyperglycemia is associated with whole-body metabolic deterioration
According to their FG level, 150 subjects were divided into three groups: Normal group (<6.1 mmol/L); High group (6.1 ~ 7mmol/L), and Very high group (>7 mmol/L). As shown in Table 1, no difference in age, sex, smoking, and drinking status was found among the three groups.
Table 1.
Basic characteristics of the study population.
| N group |
H group |
VH group |
P value |
|
|---|---|---|---|---|
| Number of subjects | 76 | 23 | 51 | |
| Age (years, mean ± SEM) | 72.3 ± 0.65 | 72.07 ± 2.24 | 72.24 ± 0.75 | 0.56a |
| Sex, F/M (%) | 49/27(64.5/35.5) | 14/9(60.9/39.1) | 29/22(56.9/43.1) | 0.69b |
| Smoking status | 0.50b | |||
| Never smoked (%) | 82.9 | 73.9 | 74.5 | |
| Former smoker (%) | 7.9 | 4.3 | 9.8 | |
| Current smoker (%) | 9.2 | 21.7 | 15.7 | |
| Drinking status | 0.47b | |||
| No drinking (%) | 86.8 | 73.9 | 88.2 | |
| Moderate drinker (%) | 6.6 | 8.7 | 3.9 | |
| Heavy drinker (%) | 6.6 | 17.4 | 7.8 |
N means normal group; H means high group; VH denotes very high group; SEM, Standard Error of Mean.
aFrom Student t-test.
bFrom Chi-square test.
Both the H group and VH group showed significant higher body weight compared to the N group. The H group also showed significantly higher BMI compared to the N group. Through comparison of the clinical parameters, we found that the VH group had a significantly increased level of triglyceride but a decreased level of HDL, a significantly increased level of ALT of white blood cells and monocyte count, compared to the N group but not the H group (Figure 2). Collectively, the data validated that older adults with clinical diabetes have abnormal lipid metabolism, liver function, and inflammation status. These clinical parameters indicated an overall deterioration of metabolic health in the VH group.
Figure 2.
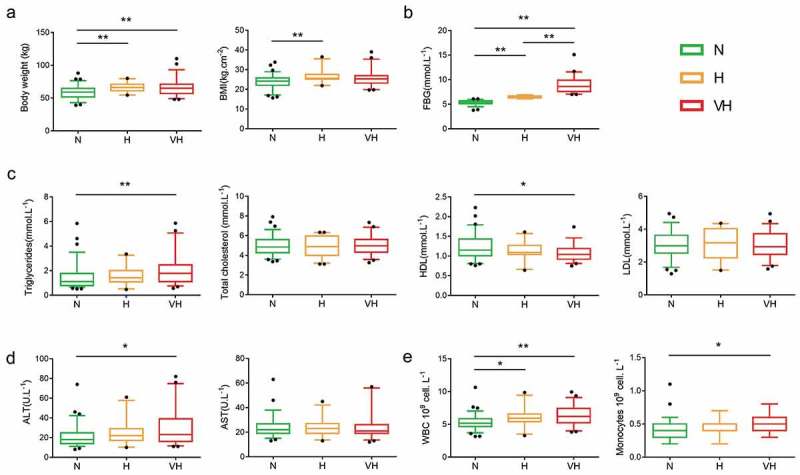
Clinical parameters among three groups. (a) Anthropometric markers. (b) Fasting blood glucose. (c) Plasma lipid homeostasis. (d) Hepatic function markers. (e) Inflammation-related markers. Boxes show the medians and the interquartile ranges, and outliers are shown as individual points. Mann-Whitney test was used to analyze the difference among the N, H, and VH groups. *P < 0.05, **P < 0.01. N group, n = 76; H group, n = 23; VH group, n = 51. BMI, body mass index; HDL, high-density lipoprotein; LDL, low-density lipoprotein; ALT, alanine aminotransferase; AST, aspartate aminotransferase; WBC, White blood cell count.
The whole structure of the oral microbiome of the VH group showed a trend to deviate from the other two groups
The oral microbiome was profiled by sequencing of the bacterial 16S rRNA gene V3-V4 region. For each sample 38,706 ± 4,321 (mean ± SD) high quality reads were obtained. OTUs (7,263) were obtained at 97% identity. A total of 13 phyla, 22 classes, 37 orders, 82 families, and 152 genera were detected through taxonomic assignments based on the Greengenes Database. The oral microbiota was characterized by relative taxonomic abundance. At the phylum level, the three groups were similar in composition, predominantly composed of Firmicutes, Proteobacteria, Bacteroidetes, Actinobacteria, and Fusobacteria (Figure 3(a)). Streptococcus, Neisseria, Prevotella, Rothia, Veillonella, Fusobacterium, Porphyromonas, Haemophilus, Leptotrichia, and Phascolarctobacterium were the 10 most abundant genera (Figure 3(b)). Among the abundant genera, the relative abundance of Streptococcus showed a trend to be higher in the VH group compared to the N group (Mann Whitney test, P value = 0.085), while the relative abundance of Leptotrichia in the VH group was significantly higher when compared to the H group (Mann Whitney test, P value = 0.014), and also showed a trend to be higher when compared to the N group (Mann Whitney test, P value = 0.085). We then used PLS-DA to profile the overall structure of the oral microbiome. The results revealed that the overall structure of the oral microbiome of the N and H group overlapped, while the VH group deviated from the other two groups (Figure 4(c)). MANOVA analysis confirmed that the N and V group were separated from the VH group (Figure 4(b)), but there was no statistical significance.
Figure 3.
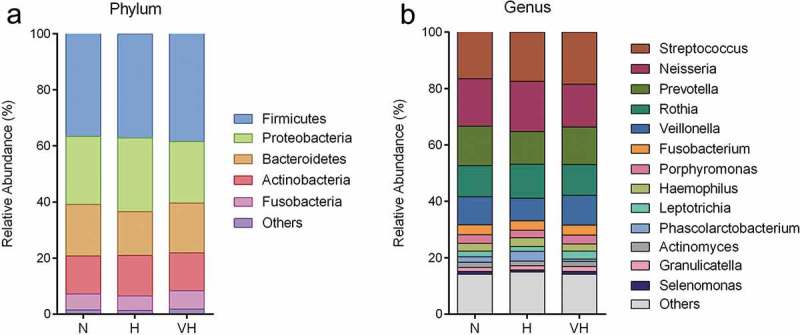
Composition of the oral microbial community at phylum (a) and genus (b) levels. Relative abundance is shown as the percentage of the total sequences. Phylum or genera with a relative abundance less than 1% are merged.
Figure 4.
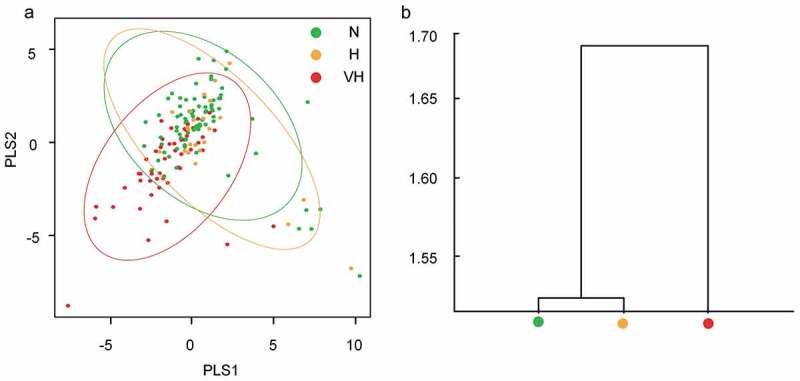
The overall structural profile of the oral microbiota among three groups. (a) PLS-DA of the oral microbiota based on genera. (b) Clustering of the microbiota based on Bray-Curtis distance calculated by MANOVA test.
Identification of hyperglycemia-associated oral bacterial genera by LEfSe
LEfSe was applied to identify differential bacterial genera among the groups. The cladogram represented the significantly different taxa among the three groups with a hierarchy reflecting the taxonomic rank from phylum to genus (Figure 5(a)). The LDA effect size in Figure 5(b) represented the contribution in group discrimination. All the significantly enriched taxa (LDA score ≥2) were from the VH group, which is consistent with the whole oral microbiota structure as shown in Figure 3(a). Two orders, Erysipelotrichales and Bacillales and one class, Erysipelotrichi were significantly enriched in the VH group. Three families, including Leptotrichiaceae, Erysipelotrichaceae, and Staphylococcaceae were significantly enriched in the VH group. Four genera, including Leptotrichia, Bulleidia, Staphylococcus, and Catonella were significantly enriched in the VH group. These bacteria could be considered as potential hyperglycemia-associated taxa and may play an important role in the early diagnosis and adjuvant treatment of T2D.
Figure 5.
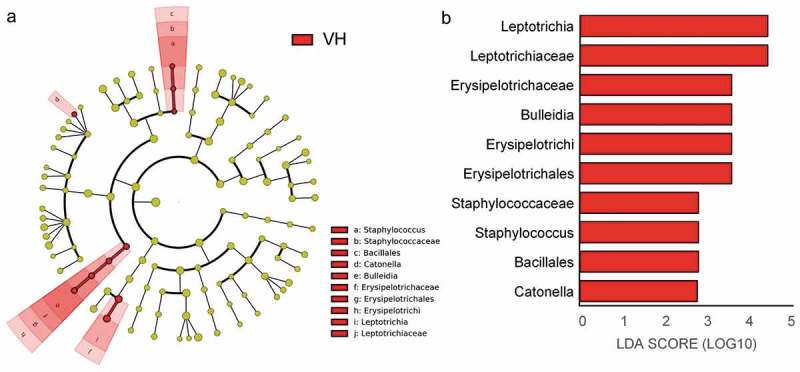
Key bacterial genera present in the three groups as identified by LefSe. (a) Cladogram of key bacterial taxa where each layer represents different taxanomy. (b) Key taxa ranked by LDA score. LDA score ≥ 2.0 were identified as key bacteria. Red color represents significantly abundant taxa in the VH group when compared to the N and H group.
Discussion
T2D is a multi-system disease featured by insulin resistance and hyperglycemia that could result in severe complications without control [2].The typical characters in the progression of hyperglycemia is crucial in the disease diagnosis and treatment [13]. In our study, we aimed at investigating the relationship between FPG levels and the oral microbiome, exploring specific oral microbial signatures in the progression of hyperglycemia.
Firstly, our results revealed deterioration of the metabolic phenotype along with increase in the FG level in the Chinese elderly cohort. Individuals with a FG level higher than ≥7 mmol/L (VH group), which could be diagnosed as T2D patients [14], showed overt disease phenotypes with abnormal lipid metabolism, liver function, and inflammation compared to their healthy controls. This finding is consistent with previous studies that the higher level of FG deteriorated healthy status [15,16].
Since T2D has been associated with increased severity of periodontal disease [10,17], it is quite natural to connect the pathogenesis of hyperglycemia with oral health. Several studies have linked dysbiosis of the oral microbiota with T2D. A structural shift in the oral microbiota has been reported in T2D patients when compared to healthy controls [7,8]. Then, it becomes an interesting question whether there will be oral microbial signatures along with the different levels of FG and when will these signatures appear? In this study, we revealed the oral microbial signature and key bacteria taxon level along with the increasing level of FG. The typical oral microbial features will appear along with the appearance of eminent metabolic differences induced by severe hyperglycemia. Our results suggest that the dysbiosis of the oral microbiota can be a possible indicator for the severity of hyperglycemia.
Several features of the oral microbiota have been reported to be related with T2D. Although using a small cohort of morbid obese patients, it has been reported that obese individuals with T2D showed lower levels of Bifidobacteria [7]. Another study revealed that the phylum Actinobacteria and genera such as Actinomyces and Atopobium, which belong to the phylum Actinobacteria, were significantly less abundant in patients with T2D compared to healthy controls [8]. However, in our study we reported an increase of several hyperglycemia-associated bacterial genera such as Leptotrichia, Staphylococcus, Catonella, and Bulleidia in the VH group. Leptotrichia has been previously linked with periodontal diseases [18]. Staphylococcus is a more common pathogenic genus which could induce cross-infection and dissemination from the oral cavity to other body sites [19,20]. Several species from the genus Catonella have been considered as candidate periodontal pathogens [21]. Bulleidia has also been reported to be enriched in children with dental caries [22]. It is now well accepted that the gut microbiota may induce systemic inflammation, which could result in the insulin resistance and T2D [23,24]. Although the amount of bacteria in the mouth is much less than in the gut, oral bacteria can migrate to other body sites, causing inflammation both locally and systemically [9,25]. The enrichment of these opportunistic pathogens in the elderly patients with diabetes may contribute to inflammation and insulin resistance. So, the oral dysbacteriosis may not only represent a typical feature of hyperglycemia, but might also contribute to the disease progression.
In summary, our result reported the structural shift of the oral microbiome along with the progression of hyperglycemia in a Chinese elderly cohort and revealed potential pathogens which may contribute to the aggravation of hyperglycemia. The hyperglycemia-associated oral bacterial genera might be useful for disease diagnosis, risk assessment and comprehensive treatment. Our study suggested a potential role of the oral microbiota in glycemic control that needs further investigation.
Funding Statement
This work was supported by the National Natural Science Foundation of China [No. 816220108030, No. 81603411, No. 81573814], China Postdoctoral Science Foundation [No.2018M630465], and Shanghai Sailing Program [19YF1449200].
Disclosure statement
No potential conflict of interest was reported by the authors.
References
- [1].Collaboration (NCD-RisC), Risk Factor NCD.. Worldwide trends in diabetes since 1980: a pooled analysis of 751 population-based studies with 4.4 million participants. Lancet. 2016;387(10027):1513–6. [DOI] [PMC free article] [PubMed] [Google Scholar]
- [2].Papatheodorou K, Papanas N, Banach M, et al. Complications of diabetes . J Diabetes Res. 2016;2016:6989453. [DOI] [PMC free article] [PubMed] [Google Scholar]
- [3].Qin J, Li Y, Cai Z, et al. A metagenome-wide association study of gut microbiota in type 2 diabetes. Nature. 2012;490:55–60. [DOI] [PubMed] [Google Scholar]
- [4].Ley RE, Turnbaugh PJ, Klein S, et al. Microbial ecology: human gut microbes associated with obesity. Nature. 2006;444:1022–1023. [DOI] [PubMed] [Google Scholar]
- [5].Le Roy T, Llopis M, Lepage P, et al. Intestinal microbiota determines development of non-alcoholic fatty liver disease in mice. Gut. 2012;62:1787–1794. [DOI] [PubMed] [Google Scholar]
- [6].Zhang Y, Wang X, Li H, et al. Human oral microbiota and its modulation for oral health. Biomed Pharmacother. 2018;99:883–893. [DOI] [PubMed] [Google Scholar]
- [7].Shillitoe E, Weinstock R, Kim T, et al. The oral microflora in obesity and type-2 diabetes. J Oral Microbiol. 2012;4:19013. [DOI] [PMC free article] [PubMed] [Google Scholar]
- [8].Long J, Cai Q, Steinwandel M, et al. Association of oral microbiome with type 2 diabetes risk. J Periodontal Res. 2017;52(3):636–643. [DOI] [PMC free article] [PubMed] [Google Scholar]
- [9].Xiao E, Mattos M, Vieira GHA, et al. Diabetes enhances IL-17 expression and alters the oral microbiome to increase its pathogenicity. Cell Host Microbe. 2017;22(1):120–128.e4. [DOI] [PMC free article] [PubMed] [Google Scholar]
- [10].Ohlrich EJ, Cullinan MP, Leichter JW. Diabetes, periodontitis, and the subgingival microbiota. J Oral Microbiol. 2010;2:5818. [DOI] [PMC free article] [PubMed] [Google Scholar]
- [11].Caporaso JG, Kuczynski J Stombaugh J, Qiime allows analysis of high-throughput community sequencing data. Nat Methods. 2010;7(5):335–336. [DOI] [PMC free article] [PubMed] [Google Scholar]
- [12].Segata N, Izard J, Waldron L, et al. Metagenomic biomarker discovery and explanation. Genome Biol. 2011;12(6):R60. [DOI] [PMC free article] [PubMed] [Google Scholar]
- [13].Davies MJ, Raymond NT, Day JL, et al. Impaired glucose tolerance and fasting hyperglycaemia have different characteristics. Diabet Med. 2000;17(6):433–440. [DOI] [PubMed] [Google Scholar]
- [14].Alberti KG, Zimmet PZ. Definition, diagnosis and classification of diabetes mellitus and its complications. part 1: diagnosis and classification of diabetes mellitus provisional report of a WHO consultation. Diabet Med. 1998;15(7):539–553. [DOI] [PubMed] [Google Scholar]
- [15].Cali AM, Bonadonna RC, Trombetta M, et al. Metabolic abnormalities underlying the different prediabetic phenotypes in obese adolescents. J Clin Endocrinol Metab. 2008;93(5):1767–1773. [DOI] [PMC free article] [PubMed] [Google Scholar]
- [16].Bock G, Chittilapilly E, Basu R, et al. Contribution of hepatic and extrahepatic insulin resistance to the pathogenesis of impaired fasting glucose - role of increased rates of gluconeogenesis. Diabetes. 2007;56:1703–1711. [DOI] [PubMed] [Google Scholar]
- [17].Khader YS, Dauod AS, El-Qaderi SS, et al. Periodontal status of diabetics compared with nondiabetics: a meta-analysis. J Diabetes Complications. 2006;20(1):59–68. [DOI] [PubMed] [Google Scholar]
- [18].Liu B, Faller LL, Klitgord N, et al. Deep sequencing of the oral microbiome reveals signatures of periodontal disease. PLoS One. 2012;7(6):e37919. [DOI] [PMC free article] [PubMed] [Google Scholar]
- [19].Wade JC, Schimpff SC, K A N, et al. Staphylococcus epidermidis: an increasing cause of infection in patients with granulocytopenia. Ann Intern Med. 1982;97(4):503–508. [DOI] [PubMed] [Google Scholar]
- [20].McCormack MG, Smith AJ, Akram AN, et al. Staphylococcus aureus and the oral cavity: an overlooked source of carriage and infection? Am J Infect Control. 2015;43(1):35–37. [DOI] [PubMed] [Google Scholar]
- [21].Kumar PS, Griffen AL, Moeschberger ML, et al. Identification of candidate periodontal pathogens and beneficial species by quantitative 16S clonal analysis. J Clin Microbiol. 2005;43:3944–3955. [DOI] [PMC free article] [PubMed] [Google Scholar]
- [22].Kim B-S, Han D-H, Lee H, et al. Association of salivary microbiota with dental caries incidence with dentine involvement after 4 years. J Microbiol Biotechnol. 2018;28(3):454–464. [DOI] [PubMed] [Google Scholar]
- [23].Cani PD, Bibiloni R, Knauf C. Changes in gut microbiota control metabolic endotoxemia-induced inflammation in high-fat diet-induced obesity and diabetes in mice. Diabetes. 2008;57(6):1470–1481. [DOI] [PubMed] [Google Scholar]
- [24].Zhao L, Zhang F, Ding X, et al. Gut bacteria selectively promoted by dietary fibers alleviate type 2 diabetes. Science. 2018;359(6380):1151–1156. [DOI] [PubMed] [Google Scholar]
- [25].Gao L, Xu T, Huang G. Oral microbiomes: more and more importance in oral cavity and whole body. Protein Cell. 2018;9(5):488–500. [DOI] [PMC free article] [PubMed] [Google Scholar]


