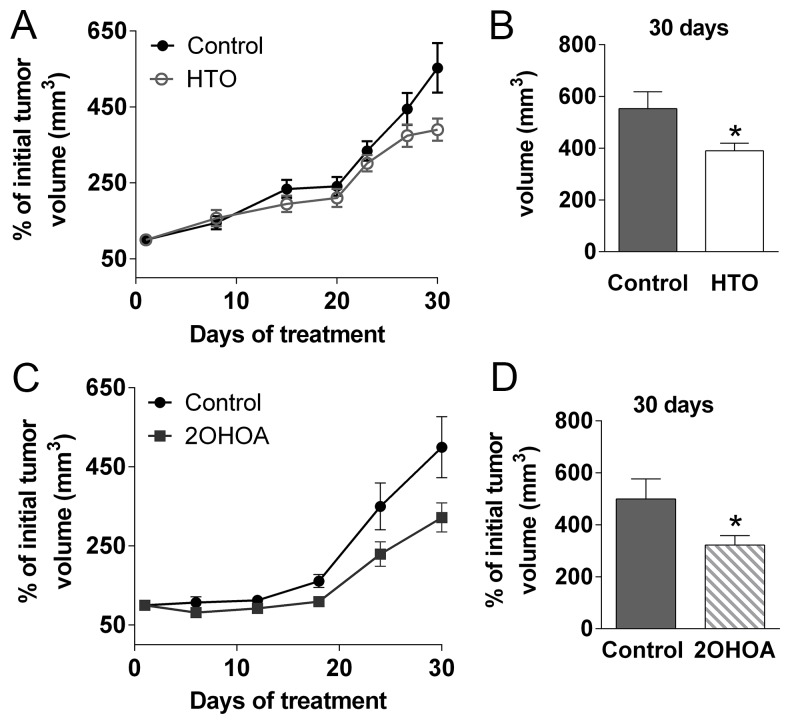
Figure 9. HTO and 2OHOA inhibit tumor progression in vivo.
MDA-MB-231 cells (7.5 × 10⁶) were injected subcutaneously into nude mice, which were then treated orally for 30 days with HTO (400 mg/kg per day -A) or its fatty acid, 2OHOA (C). Tumor size (A, C) was measured with a digital caliper and the tumor volume was expressed relative to the volume at the beginning of the treatment (mean ± SEM; n = 9 for control, n = 8 for HTO, n = 10 for 2OHOA): *p < 0.05 (Student’s t test). Solid circles correspond to the control group, open circles to the HTO group and the solid squares to 2OHOA treatment. (B, D) The mean tumor size in animals treated with HTO or 2OHOA is compared to the controls (day 30).

