

SUMMARY
Aims: To determine the extent to which autophagy contributes to neuronal death in cerebral hypoxia and ischemia. Methods: We performed immunocytochemistry, western blot, cell viability assay, and electron microscopy to analyze autophagy activities in vitro and in vivo. Results: In both primary cortical neurons and SH‐SY5Y cells exposed to oxygen and glucose deprivation (OGD)for 6 h and reperfusion (RP) for 24, 48, and 72 h, respectively, an increase of autophagy was observed as determined by the increased ratio of LC3‐II to LC3‐I and Beclin‐1 (BECN1) expression. Using Fluoro‐Jade C and monodansylcadaverine double‐staining, and electron microscopy we found the increment in autophagy after OGD/RP was accompanied by increased autophagic cell death, and this increased cell death was inhibited by the specific autophagy inhibitor, 3‐methyladenine. The presence of large autolysosomes and numerous autophagosomes in cortical neurons were confirmed by electron microscopy. Autophagy activities were increased dramatically in the ischemic brains 3–7 days postinjury from a rat model of neonatal cerebral hypoxia/ischemia as shown by increased punctate LC3 staining and BECN1 expression. Conclusion: Excessive activation of autophagy contributes to neuronal death in cerebral ischemia.
Keywords: Autophagic neuron death, Autophagy, Cortical neurons, Hypoxia/ischemia, Oxygen and glucose deprivation (OGD)
Aims
Autophagy is a highly regulated process that involves the degradation of a cell's cytoplasmic macromolecules and organelles in mammalian cells by the lysosomal system. It plays a normal part in cell growth, development, and homeostasis, helping to maintain a balance between the synthesis, degradation, and subsequent recycling of cellular products. Studies reported that autophagy had a neuroprotective role. For example, suppression of basal autophagy in neural cells causes neurodegenerative disease in mice, and insufficient autophagy contributes to pathogenesis in Huntington's disease), Alzheimer disease, and amyotrophic lateral sclerosis [1, 2, 3, 4, 5, 6, 7, 8]. Other studies, however, suggest that accelerated autophagy might contribute to neuronal death in various pathological conditions including cerebral ischemia [9, 10, 11, 12]. However, controversies exist whether increased autophagic activities contribute to autophagic neuronal death [13].
Using a combination of techniques and models, this study aimed to investigate the activation of autophagy in primary cortical neurons and its contribution to hypoxia/ischemia (H/I) induced neuron death. H/I injury was induced by oxygen and glucose deprivation (OGD) followed by reperfusion (RP) on primary cortical neurons in vitro. Cerebral ischemia was induced by unilateral common carotid artery occlusion and hypoxia in neonatal rats in vivo. We observed a dramatic increase of autophagy in human neuroblastoma cells and in primary cortical neurons after H/I injury, which paralleled to the increment of autophagic neuron death rates. Inhibition of autophagy with 3‐methyladenine (3‐MA) significantly reduced neuronal death. Our data suggests that excessive autophagy is a contributing factor of neuronal death in cerebral ischemia and hypoxia.
Methods
Cell Culture and Treatment
All animal protocols were approved by the University of Manitoba Animal Care Ethics Committee. For primary cortical neuron culture, pregnant female Sprague–Dawley rats were anesthetized with 5% isoflurane. Primary cortical neurons were separated from embryonic 18 days (E18) rat brains using our standardized protocol [14] and neuronal cultures were prepared as described previously [15]. Cells were plated in neurobasal medium (Invitrogen) supplemented with 5 mmol/L HEPES, 1.2 mmol/L glutamine, 10% fetal bovine serum (FBS), 2% B27, and 25 μg/mL gentamicin at a density of 2 × 10⁵ cells/cm2 on plates or cover slips coated with poly‐d‐lysine. The medium was replaced with neurobasal without FBS after 24 h. After 7 days, glutamine was removed from the medium. SH‐SY5Y (human SH‐SY5Y neuroblastoma cell line) cells were maintained in Dulbecco's Modified Eagle Medium plus 10% FBS in the presence of penicillin (100 units/mL), streptomycin (100 μg/mL), and 2 mM l‐glutamine. Before OGD treatment, cells were washed twice and incubated with glucose‐free Earle's Balanced Salt Solution (EBSS) at pH 7.4 in a Forma Series II Water Jacketed CO2 Incubator (Thermo Scientific, Waltham, MA, USA) with an atmosphere of 94% N2, 5% CO2, and 1% O2 at 37°C for the designed length of time. OGD was terminated by replacing the glucose‐free EBSS with complete medium and incubating the cultures in normoxic conditions.
Transmission Electron Microscopy
To observe the time course of H/I‐induced the formation of autophagosomes and morphologic changes of cell organelles with transmission electron microscopy examination, primary cortical neurons were digested by 0.25% trypsin for 15 min and collected and compacted to solid pallets by centrifugation at 1200 g for 3 min. The pallets of neurons were then treated as tissue blocks, which were fixed first immersed in 2.5% glutaraldehyde in 0.1 mol/L phosphate buffer (pH 7.2) with 8% sucrose, postfixed in 1% osmium tetroxide in 0.1 mol/L phosphate buffer (pH 7.4), dehydrated in graded ethanol series, and flat embedded in Araldite. Ultrathin sections (40–60 nm thick) were placed on grids (200 mesh), and double stained with uranyl acetate and lead citrate. The grids containing the sections were observed under a Philips 201 (Philips Electron Optics, B.V. Eindhoven, The Netherlands) electron microscope.
Neonatal H/I Brain Injury
Neonatal H/I brain injury was induced in Sprague–Dawley rats on postnatal day 7 after the Rice–Vannucci model (unilateral common carotid artery ligation with hypoxia) [16], with minor modifications. In brief, after the rats were deeply anesthetized with isoflurane (2%), the right common carotid artery was dissected and ligated with silk sutures (4/0). After the surgical procedure, the rat pups were allowed to recover for 1 h and then placed in chambers maintained at 37°C, through which 8% humidified oxygen (balanced with nitrogen) flowed for 90 min. After hypoxic exposure, the pups were returned to their dams. The animals were allowed to recover for 24 h, 72 h, or 7 days before being euthanized. At each stage, brains were processed for biochemical and morphological analyses. This procedure resulted in brain injury in the ischemic hemisphere, consisting of cerebral infarction mainly in the forebrain. Control littermates were neither operated on nor subjected to hypoxia. N = 3 for each group.
Quantification of Neuronal Death
To examine the contribution of autophagy to the OGD‐induced death of rat cortical neurons, neurons were treated with 5 mM 3‐MA during and after OGD. Lactate dehydrogenase (LDH) leakage was measured after 6 h of OGD followed by RP at 0, 24, 48, or 72 h. In brief, after OGD treatment, the supernatant of the cell culture was reserved. Neurons were lysed with lysis buffer at 37°C for 30 min. Then samples of supernatants and cell lysates were prepared following the manufacturer's instructions for the LDH‐Cytotoxicity Assay Kit II (BioVision, Milpitas, CA, USA. Cat: #K313‐500). The absorbance value at 450 nm was determined on a Wallac VICTOR 3 microplate reader (Perkin Elmer Life Sciences, Waltham, MA, USA). Cell death rate was calculated according to the manufacturer's instruction.
Monodansylcadaverine Staining
Cells were seeded at a density of 2 × 10⁵ cells/cm2 on 96‐well plates. After the OGD and RP treatment, cells were incubated in 100 μM monodansylcadaverine (MDC; Fluka, Oakville, ON, Canada. Cat: 30432) solution for 1 h at 37°C in the dark. Cells were then washed with one rinse of phosphate buffered saline (PBS) and fixed with 4% PFA for 15 min. Then cells were washed with three rinses of PBS, and measurement of fluorescence was performed on a Wallac VICTOR 3 microplate reader (Perkin Elmer Life Sciences). The excitation wavelength of MDC is 360 nm and emission wavelength is 457 nm. For each time point, there were at least 18 parallel wells and we repeated the experiment three times.
Because the total cell number changed after different lengths of OGD and RP treatment times, we added 100 μg/mL ethidium bromide (EB) solution into each well and stained nuclei of the leftover cells. Then the fluorescence was detected on a Wallac VICTOR 3 microplate reader (Perkin Elmer Life Sciences) with an excitation wavelength of 480 nm. We calculated the normalized MDC fluorescence intensity for each experiment.
Acridine Orange Staining
Cells were seeded at a density of 2 × 10⁵ cells/cm2 on 96‐well plates. After OGD/RP, cells were incubated in PBS with 1 μg/mL acridine orange (AO; Sigma, Oakville, ON, Canada. Cat: 318337) for 10 min at room temperature (RT) in the dark. Cells were then washed with one rinse of phosphate buffered saline (PBS) and fixed with 4% PFA for 15 min. Then cells were washed with three rinses of PBS and measurement of fluorescence was performed on a Wallac VICTOR 3 microplate reader (Perkin Elmer Life Sciences). The excitation filters were 550 and 485 nm for red and green fluorescence, with emission filters 590 and 535 nm, respectively. Then we used the ratio of red fluorescence to green fluorescence to quantify autophagic activities. For each time point, there were at least 18 parallel wells and we repeated the experiment three times.
Fluoro‐Jade C/MDC Staining of Autophagic Neurons and Quantification of Autophagic Neuron Death
Cells were seeded on cover slips, which were placed in 24‐well plates. After the OGD and RP treatment, cells were incubated in 100 μM MDC (Fluka, Cat: 30432) solution for 1 h at 37°C in the dark. Then cells were fixed in 4% paraformaldehyde on ice for 15 min and washed with three rinses of PBS. 0.0004% Fluoro‐Jade C (Millipore, Billerica, MA, USA. Cat: AG325) working solution was added in each well for 1 h at 37°C to stain the degenerating neurons. Cells were washed with two rinses of PBS (with 0.1% tween‐20), 10 min each time. The cover slips were mounted on glass slides and fluorescent images were taken on a Nikon TE2000‐E microscope equipped with a RETIGA camera (QImaging, Surrey, BC, Canada.). For each time point there were at least eight parallel wells, and for each well at least three pictures under different visual fields were taken. The magnification was 40×.
Immunocytochemistry
Cells were seeded on cover slips, which were placed in 24‐well plates. After OGD/RP treatment cells were fixed in 4% paraformaldehyde on ice for 20 min, washed with PBS for 3 × 5 min, then blocked with 1% BSA (Sigma) at RT for 1 h, and incubated with primary antibodies (Autophagy APG8 microtubule‐associated protein 1 light chain 3 [LC3], 1:100; Beclin‐1 [BECN1], 1: 100) at 4°C overnight. Incubation with the second antibody (Alexa 594‐labeled goat F(ab’)2 anti‐(mouse IgG) and Alexa 488‐labeled goat F(ab’)2 anti‐(rabbit IgG) from Invitrogen) was carried out at RT for 1 h. Nuclei were stained by Hoechst 33342 (Calbiochem, Mississauga, ON, Canada). The cover slips were mounted on glass slides and fluorescent images were taken on a Nikon TE2000‐E microscope equipped with a RETIGA camera (QImaging).
Western Blotting
Total cell lysates were separated from cells after OGD/RP treatment. Protein concentrations were determined by a reducing agent‐compatible BCA assays kit (Pierce, Nepean, ON, Canada). Protein samples were separated on 12% polyacrylamide gels and electrotransferred to polyvinylidene difluoride membranes. The primary antibodies included: rabbit polyclonal autophagy APG8 (1:1000; Abgent, San Diego, CA, USA), goat polyclonal BECN1 (1:1000; Santa Cruz Biotechnology, and mouse monoclonal β‐actin (1:2000; Santa Cruz Biotechnology, Santa Cruz, CA, USA)). The secondary antibodies were horseradish peroxidase‐conjugated sheep antimouse (1:5000; GE Healthcare, Baie d’Urfe, QC, Canada) and donkey antirabbit IgG (1:5000; Thermo scientific) and donkey antigoat IgG (1:5000; Santa Cruz Biotechnology). Immunoblotting was detected by Enhanced Chemiluminescence (Amersham, Baie d’Urfe, QC, Canada.) and imaged on a FluorChem 8900 imager (Alpha Innotech, San Leandro, CA, USA). Western blot band densities were quantified using the BIO‐RAD Laboratories (Mississauga, ON, Canada) Quantity One software.
Statistical Analysis
Statistical differences were determined using Student's t‐test or one‐way ANOVA. A difference was considered significant at *P < 0.05, **P < 0.01, and ***P < 0.001.
Results
Excessive Activation of Autophagy in Primary Rat Cortical Neurons after OGD/RP Injury
Transmission electron microscopy was used to identify ultrastructural changes in primary cortical neurons 48 and 72 h after 6‐h OGD injury. Control neurons showed normal appearance of cytoplasm, organelles, nucleus, and chromatin (Figure 1A). After RP for 72 h, numerous autophagic vacuoles (AVs) with characteristic morphological features of autophagosomes were detected in neurons (Figure 1B). Swelling and dilated mitochondria were frequently found (Figure 1B). Abundant double‐membrane structures and double‐membrane autophagosomes, which surrounded parts of cytoplasm and organelles, formed in neurons following OGD/RP treatment (Figure 1D–H). Lysosomes showed a darkened appearance, indicating the activation of lysosomes after RP 72 h (Figure 1E and F). Fusion of autophagosomes with lysosomes was frequently seen (Figure 1E). Meanwhile, coexistence of morphological features of normal neurons (Figure 1C and E), autophagic cell death, necrosis, and apoptosis could be found in the same group of neurons treated by OGD for 6 h followed by RP for 48 h (Figure 1D).
Figure 1.
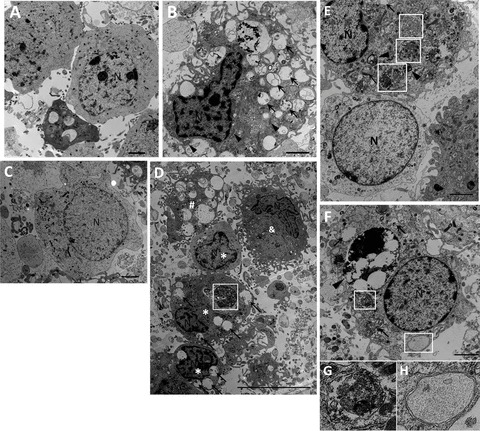
Ultrastructural changes in primary cortical neurons after OGD/RP injury. Primary neurons were subjected to OGD for 6 h then followed by RP for 48 h (C and D) and 72 h (B and E–H) and were fixed for EM examination. Electron microscopy (EM) images showing: Normal appearance of cytoplasm, organelles, and nucleus in control neurons (A). N, nucleus; Ultrastructural features of autophagic cell death were detected in neurons treated by OGD 6 h followed by RP 72 h. Cell shrinkage, nuclear condensation (without fragmentation), loss of cellular organelles, and formation of numerous autophagic vacuoles (black arrows) were shown in the picture (B, D, E, F). Mitochondria also displayed swelling and dilation as indicated by black arrowheads (B). Coexistence of morphological features of normal neurons (C, and lower cell in E), autophagic cell death (*), necrosis (#), and apoptosis (&) can be found in the same group of neurons treated by OGD 6 h followed by RP 48 h (D). White boxes represent autophagosomes; Black arrows represent autophagic vacuoles. Abundant double‐membrane structures and double‐membrane autophagosomes formed in neurons after OGD/RP treatment (D–H, as indicated by White boxes). Lysosomes stained darkened, indicating the activation of lysosomes (as shown by black arrowheads). An autophagosome fused with a lysosome. (E, as indicated by the lowest white box with beside black arrowhead). N = nucleus; Black arrows represent autophagic vacuoles; (G) and (H) showed the enlarged autophagosomes in (F). Scale bars = 2 μm in (A–C, E–F); Scale bar = 10 μm in (D).
Autophagy is also characterized by the development of acidic vesicular organelles (AVOs), which include lysosomes as well as autophagosomes that can be detected and quantified by AO staining [17]. AO is a nucleic acid selective fluorescent cationic dye useful for cell cycle determination. This pH‐sensitive dye is cell permeable and stains the nucleus and cytoplasm green and any acidic compartments red [18, 19]. In primary cortical neurons, AVO production was increased from 19.99% in normal condition to 29.19% after 6‐h OGD followed by RP 72 h (Figure 2A). The percentage of AVO‐positive neurons to total neurons in the 6‐h OGD group was much greater compared to that of 3‐h OGD, indicating that longer OGD injury activated higher autophagic activity. Second, we used MDC, an autofluorescent substance that accumulates in acidic AVs, as a specific marker for AVs [20, 21, 22]. Compared to the control group (con), there was a significant increase in the MDC fluorescence starting at 0 h and peaking at 48–72 h after 6‐h OGD treatment (Figure 2B), suggesting an increase of autophagy in neurons after OGD/RP. Third, we detected the processing and translocation of endogenous LC3 protein by immunocytochemistry and Western Blotting. We observed that the level of LC3 punctuate staining in the rat cortical neurons after 3‐h OGD increased dramatically according to the elongation of RP time, which represents an intense activation of autophagy after H/I and RP injury (Figure 2D). Finally, we combined Fluoro‐Jade C and MDC staining together to quantify the number of autophagic neurons. This method helped us identify those double‐stained neurons, which were most possibly degenerating neurons also undergoing autophagy. We found that the increase of autophagic neurons after OGD and RP injury corresponded well to the increase of AO and MDC fluorescence (Figure 2C).
Figure 2.
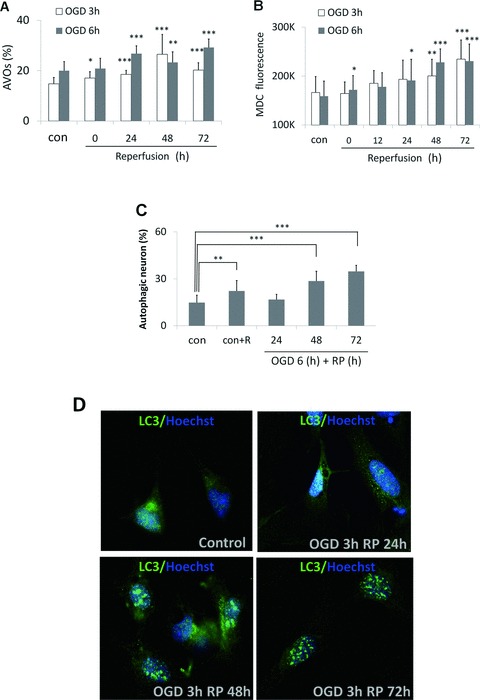
The increase of autophagic activity in OGD/RP‐challenged cortical neurons. Acridine orange staining (A) and MDC/EB double‐staining (B) were used to measure the intensity of autophagy in neurons after OGD/RP. MDC and Fluoro‐Jade C double‐staining (C) was used to quantify the autophagic neurons under 40× magnification. *P < 0.05, **P < 0.01, ***P < 0.001 versus control without OGD/RP. In (C), “control” represented “group with neither rapamycin nor OGD/RP treatment”; whereas “con+R” represented “group with rapamycin treatment (250 nM, refer to Section “OGD/RP Injury Increases Autophagy Marker Protein Levels in Cortical Neurons and SH‐SY5Y Cells”) but without OGD/RP.” OGD/RP treatment increases punctuate staining of LC3 protein (D). Neurons were treated with OGD for 3 h and followed by different times of RP (24, 48, or 72 h). Immunocytochemistry was used to demonstrate the punctuate staining of LC3 protein. Control group (con) was without OGD/RP.
OGD/RP Injury Induced Autophagic Cell Death in Rat Cortical Neurons
As shown in Figure 3, when neurons were viewed with a fluorescence microscopy after OGD/RP treatment, the AVs labeled by MDC seemed as distinct dot‐like structures distributed in the cytoplasm, in the perinuclear regions and in the processes (Figure 3). Fluoro‐Jade C labels degenerating neurons. Some Fluoro‐Jade C‐positive neurons were stained with intense MDC particles. We counted these cells as autophagic neurons (Figure 3E–F). When the stimulus became stronger, the number of neurons with intense MDC staining and a condensed nucleus increased substantially (Figure 3E and G–H, red arrows). The two features were taken together as the criteria for neurons undergoing autophagic cell death. We counted the cell numbers for different morphology under 40× magnification and did the statistical analysis to get the autophagic neuron rate (Figure 2C) and autophagic neuronal death rate (Figure 3I). It was obvious that prolonged RP after OGD injury resulted in a small but significantly increase in the autophagic neuronal death rate in cortical neurons in a time‐dependent fashion.
Figure 3.
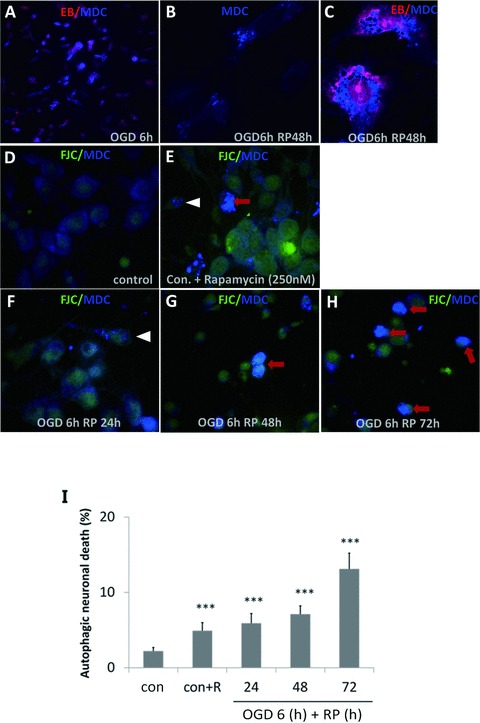
OGD/RP induces autophagic cell death in rat cortical neurons. Autophagic vacuoles (AVs) labeled by MDC appeared as distinct blue dot‐like structures distributed in the cytoplasm. Pictures were taken under 60× (A) and 100× magnification (B–C), when nuclei were stained by EB. MDC and Fluoro‐Jade C double‐staining was used to identify and quantify the autophagic neurons (white arrowheads) and autophagic neuron death (red arrows) under 40× magnification, D–H were representative pictures showing the different morphology under 100× magnification. Quantification of autophagic neuronal death rate (I) in cortical neurons after 6‐h OGD followed by RP 24, 48, or 72 h, respectively. *P < 0.05, *P < 0.01, *P < 0.001 versus control without OGD/RP.
OGD/RP Injury Increases Autophagy Marker Protein Levels in Cortical Neurons and SH‐SY5Y Cells
As in Figure 4A, we proved that ammonium chloride (NH4Cl) prevented the degradation of LC3 in autophagosomes and that the accumulated amount of LC3‐II increased after 6 h of OGD in rat cortical neurons compared to the control (Figure 4A). We determined that the optimal working concentration for NH4Cl was 20 and 30 mM on cortical neurons and SH‐SY5Y cell line, respectively (data not shown). We used rapamycin, a specific autophagy inducer, in our positive control group (Figure 4B). The ratio of LC3‐II to LC3‐I was increased dramatically from 0.79 to 1.19 by rapamycin in a dose‐dependent fashion (Figure 4C). Later, we consistently used 250 and 500 nM rapamycin as the optimal working concentrations on cortical neurons and SH‐SY5Y cells, respectively.
Figure 4.
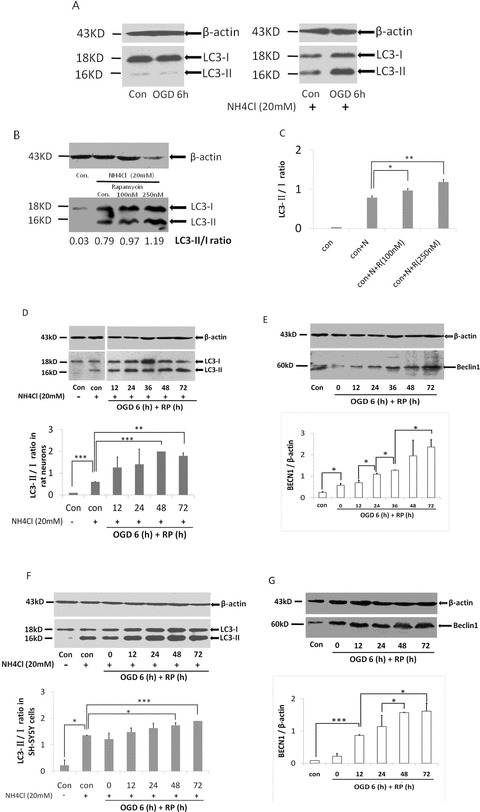
OGD/RP upregulates Beclin‐1 expression and induces LC3 conversion in cortical neurons and SH‐SY5Y cells. Neurons received 6 h of OGD: (A) Effects of NH4Cl (20 mM) on accumulation of LC3‐II on cortical neurons; (B) Effects of autophagy inducer rapamycin on cortical neurons; (C) Statistical analysis of (B). Cells were deprived of oxygen and glucose for 6 h and then treated with RP for different length of time. LC3 and Beclin‐1 were detected by Western blot: β‐actin (43 kD) was included as loading control; (D–E) Representative bands of cortical neurons; (F–G) Representative bands of SH‐SY5Y cells. The ratios of LC3‐II to LC3‐I were calculated by Quantity One software. n = 3 for each group.*P < 0.05, **P < 0.01, ***P < 0.001 versus control group.
Upon OGD/RP injury, BECN1 levels in the cortical neurons and SY5Y cells were up regulated. Changes of BECN1 levels in both cells occurred after 6‐h OGD, and the expression kept increasing for at least 3 days posttreatment (Figure 4E and G). When cytosolic LC3‐I conjugates to phosphatidyl‐ethanolamine and forms LC3‐II, its molecular weight will be changed from 18 to 16 kD. As shown in Figure 4, a dramatic increase in the ratio of LC3‐II/LC3‐I was observed in neurons as well as in SH‐SY5Y cells after OGD/RP injury (Figure 4D and F). The time course and levels of BECN1 expression correlated with the increase of LC3‐II to LC3‐I ratios, and the time course of LC3‐II to LC3‐I ratios increase corresponded to the increased autophagic neuronal death rate (Figure 3I).
Autophagy Inhibitor 3‐MA Reduces OGD/RP‐Induced Neuronal Death
To determine the role of autophagy in OGD/RP‐induced neuronal injury, rat cortical neurons were treated with the autophagy inhibitors 3‐MA during OGD and RP. 3‐MA (PI3K inhibitor) inhibits the formation of autophagosome, thus acts as a specific inhibitor of autophagic/lysosomal protein degradation [23]. It has been useful in defining the role of autophagy under various physiological conditions, such as cerebral ischemia [9, 24]. 3‐MA at the concentration of 1 mM effectively blocked the activation of autophagy as evidenced by inhibiting the production of LC3‐II (Figure 5A and B). We also used LDH assay to quantify the effects of 3‐MA on OGD‐induced neuronal death. The results showed that LDH leakage was markedly increased in cortical neurons after 6 h of OGD that was followed by prolonged RP. 3‐MA treatment resulted in a small but significantly decrease in the leakage of LDH in a time‐dependent fashion (Figure 5C). Interestingly, before 24‐h RP, the 3‐MA treatment groups showed a higher neuronal death rate compared to the control. However, when the RP time was extended to 48 and 72 h, 3‐MA demonstrated a greater protective effect on the OGD‐challenged neurons. This result is most possibly because of the “role‐switch” effect of autophagy during this process (see Section “Discussion”).
Figure 5.
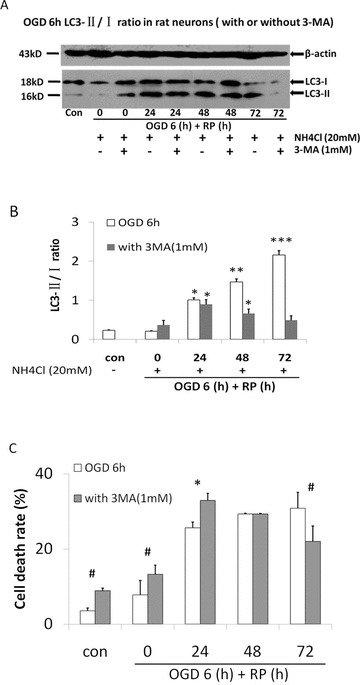
Autophagy inhibitor 3‐MA reduces OGD/RP induced‐neuronal death. 3‐MA (1 mM) was added into EBSS solution before OGD treatment on cortical neurons. After 6‐h OGD, fresh regular culture medium with 1 mM 3‐MA was used when neurons underwent prolonged RP (24, 48, or 72 h). (A) LC3 was detected by western blot. β‐actin (43 kD) was included as loading control. (B) The ratios of LC3‐II to LC3‐I were calculated by Quantity One software. (C) Time course of cell death rate in OGD/RP‐challenged neurons with or without presence of 1 mM 3‐MA, by using LDH assay. n = 3 for each group. *P < 0.05 versus control group without OGD/RP; # P < 0.001 versus OGD/RP treatment group without 3‐MA.
Activation of Autophagy in Ischemic Brains
We challenged Neonatal Day 7 rats by focal cerebral ischemia and followed by whole brain hypoxia, then detected elevations of BECN1 levels at different time points postischemia in the cortex. We found the alterations in BECN1 levels in the cortex lasted for several days and peaked at 7 days postischemia. BECN1 immunoreactivity in the ipsilateral ischemic hemisphere was significantly enhanced than in the contralateral part (Figure 6A–D). We also probed brain sections with LC3 antibody that detects both forms of LC3. Whereas only diffused LC3 distribution was observed in contralateral side (Figure 6E–G), strong LC3 punctuate staining was observed in ipsilateral part after RP 7 days (Figure 6H–J). Western blot analysis showed that BECN1 levels were increased in a time‐dependent fashion according to the RP time in the ipsilateral ischemic hemisphere, whereas there is no change in BECN1 levels between the contralateral parts (Figure 6K). In addition, we performed immunoblot analyses and densitometry of LC3 in whole brain extracts. With the used antibody, we detected only one band and not an obvious change in the density on the ipsilateral sides of ischemic brains (Figure 6K).
Figure 6.
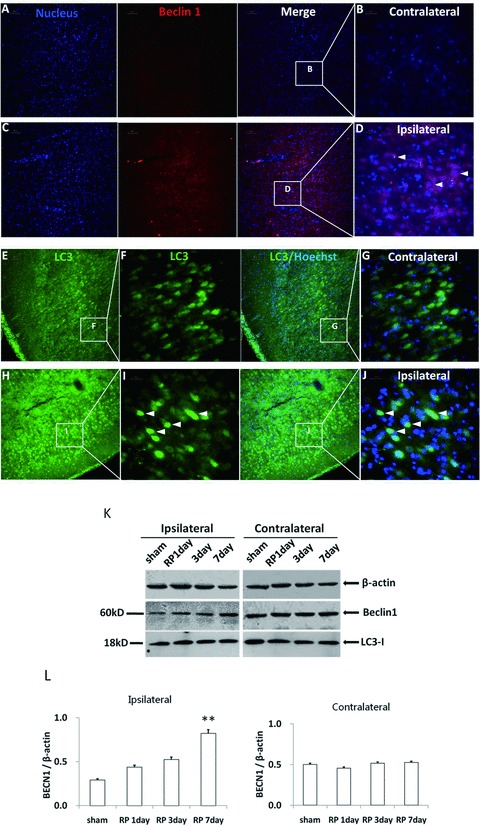
Autophagy was activated in brain tissue after neonatal hypoxia/ischemia. Beclin‐1 immunoreactivity in brain sections seven days postischemia on the ischemic side (C and D) and on the contralateral side (A and B). LC3 immunoreactivity in brain sections 7 days postischemia on the ischemic side (H–J) and on the contralateral side (E–G). A, C, E, and H were taken under 20× magnification (Scale bars = 50 μm) whereas B, D, F, G, I, and J were taken under 60× magnification (Scale bars = 20 μm). Western blot analysis showed that Beclin‐1 levels were increased in the ipsilateral ischemic hemisphere according to the RP time, whereas there was no change in the contralateral parts (K). N = 3 for each group. *P < 0.05, **P < 0.01, ***P < 0.001 versus shamoperation group (L).
Conclusion and Discussion
In this study, we explored the role of autophagy in the OGD as well as neonatal stroke model. Although autophagy has been investigated in many contexts, it has not yet been directly studied on the OGD‐challenged primary cortical neurons. Both hypoxia and hypoglycemia are involved in the ischemic stroke, accordingly we chose the OGD model in cultured cortical neurons as an in vitro approach to mimic the in vivo situation [25, 26]. In addition, during RP period in stroke and brain trauma, inflammation response occurs and causes injury. Because this RP‐induced injury is involved in the brain's ischemic cascade and reintroduction of oxygen within cells may cause damage to cellular proteins, DNA, and the plasma membrane [27], we furthermore detected the effects of reoxygenation to the cultured primary neurons as well as human neuroblastoma cells (SH‐SY5Y) in our experiments. We included the well‐established human neuroblastoma SH‐SY5Y cell line because a remarkable feature of this cell line described so far is the expression of biochemical properties characteristic of normal neuronal cells [28]. Because 3‐MA interferes with the MTT assay, we used LDH leakage as an index of cell death after OGD/RP on neurons [29, 30]. We found that our OGD/RP model works well in terms of neuronal damage so far. We therefore consistently used this model in our following experiments.
To determine whether OGD/RP can activate excessive autophagy in cortical neurons, we performed both biochemical and morphological methods combined with various autophagy‐related markers. Those markers included specific fluorescent compounds (e.g., AO, MDC, EB, and Fluoro‐Jade C) and autophagy marker protein, LC3. All the markers were used alone or in combination in our OGD/RP model. Autophagosome formation involves the conversion of LC3 (mammalian ATG8) from LC3‐I to LC3‐II [ 31 ]. Cytoplasmic form LC3 (LC3‐I) is distributed in the cytoplasm diffusely [32]. During autophagy, processed form (LC3‐II) will be transported to the outer membrane of autophagosomes [31, 33], generating a punctate pattern of LC3 expression. When cytosolic LC3‐I is conjugated to phosphatidyl‐ethanolamine and forms LC3‐II, its molecular weight changes from 18 to 16 kD. Thus, an increase in the amount of the smaller molecular weight LC3‐II protein can be detected and the increase in the LC3‐II/I ratio can be used as a hallmark of up‐regulated autophagy. This process is usually accompanied with an increased number of autophagosomes as well [31]. We detected the intensive signals of multiple AVs, the translocation of LC3‐II to autophagosome, and the conversion of LC3‐ I to LC3‐II and found that, at the cellular level, pronounced autophagy could accelerate damaging of cortical neurons.
Autophagic cell death or type II programmed cell death is characterized by extensive autophagic degradation of cellular organelles before nuclear destruction [34, 35]. The most representative morphological feature of autophagic cell death is the formation of numerous autophgic vacuoles or autophagosomes in the cytoplasm with condensed nucleus [36]. By transmission electron microscopy, we observed occurrence of abundant AVs in the cytoplasm, and numerous double‐membrane autophagosomes formed in neurons after OGD/RP treatment. Using MDC as a specific marker for AVs and Fluoro‐Jade C for degenerating neurons to identify and quantify neurons undergoing autophagic cell death after OGD/RP injury. Fluoro‐Jade C, like its predecessors Fluoro‐Jade and Fluoro‐Jade B, was found to stain all degenerating neurons, regardless of insults or mechanisms of cell death. Specifically, Fluoro‐Jade C exhibited a stain of maximal contrast and affinity for degenerating neurons [37]. We demonstrated that prolonged RP following OGD resulted in a significant increase of autophagic neuron death rates.
Degradation and recycling of cellular constituents by autophagy is a continuous process that is usually described as “autophagic flux.” To measure autophagic flux, as compared to steady‐state levels of AVs, LC3‐II turnover is measured at different time points in the presence and absence of a lysosomal inhibitor, NH4Cl [8, 38, 39]. We proved that NH4Cl prevented the degradation of LC3 in autophagosomes, and led to the accumulation of LC3‐II after OGD/RP treatment. The amount of LC3‐II that was elevated in response to the presence of degradation inhibitor represented an estimate of flux. Rapamycin (mTOR inhibitor), which mimics cellular starvation by blocking signals required for cell growth and proliferation, has become one of the most widely‐used autophagy inducers [40, 41]. We used rapamycin as a positive control and found the ratio of LC3‐II to LC3‐I increased dramatically when compare to the control group.
BECN1, the mammalian homologue of yeast Atg6, was first described as a Bcl‐2‐interacting protein and was formerly found to promote autophagy [31]. Cells with reduced BECN1 expression exhibit decreased autophagic activity [2, 42]. A dramatic elevation in BECN1 has been found in the penumbra of rats after cerebral ischemia [43]. As expected, we found that after OGD/RP, BECN1 expression in the cortical neurons and SY5Y cells were up regulated. Alternations in the levels of BECN1 protein in both cells occurred after 6‐h OGD, and the expression kept increasing for at least 3 days of RP (Figure 4E–G). Interestingly, the time courses and levels of BECN1 expression correlated well with the increase of LC3‐II to LC3‐I ratios.
We believe that autophagy plays a death‐promoting role in neuronal death after stroke because the introduction of autophagy inhibitor, 3‐MA showed obvious neuroprotective effects at the late stages of OGD/RP. This result was in agreement with Puyal and Clarke's study that postischemic intracerebro–ventricular injections of the autophagy inhibitor 3‐MA blocked the ischemia‐induced increment in LC3‐II and powerfully reduced the lesion volume by 46%[44]. We observed the dual role of 3‐MA in different stage of re‐oxygenation: before 24 h 3‐MA triggered a higher neuronal death rates, whereas after RP 48 h and 72 h, 3‐MA significantly protected neurons from dying. We believe that prolonged OGD/RP triggers autophagy to switch its role from protective to death inducing in a sequential manner. After a shorter time of RP, the role of autophagy is primarily to eliminate damaged organelles to rescue cells. Although prolonged RP triggers massive autophagy leading to autophagic cell death. As a consequence, inhibition of autophagy at an early stage may lead to further cell damage when compared to inhibition at a later stage. Our results showed the early stage (protective autophagy) lasted for around 1 day after OGD injury before autophagic cell death occurred.
BECN1 was expressed in many areas including cerebral cortex, hippocampus, and cerebellum in the rat brain [45, 46]. In neonatal cerebral H/I (unilateral common carotid artery ligation followed by whole‐brain hypoxia) on postnatal Day 7 rat pups, we demonstrated upregulation of BECN1 in the cortex, which lasted for several days and peaked at 7 days postischemia. We detected only one band of LC3. There was no obvious change in the LC3 density on the ipsilateral sides of ischemic brains. This is in accordance with the result of Adhami et al. [11]. The lack of second bands of lipid‐conjugated form of LC3 and parallel increase in LC3 density on the Western blot level might be because of the rapid turnover of LC3 proteins by autophagosome‐lysosome processing after the H/I insult.
In a recent article, we showed the contribution of BNIP3, a death‐inducing mitochondrial protein, to delayed neuronal death following stroke [14]. Elmore et al. and Twig et al. have provided evidence that BNIP3 could trigger mitochondrial depolarization and cause mitochondrial autophagy and clearance [47, 48]. Zhang et al. hypothesized that BNIP3 could compete with Bcelin‐1 for binding to Bcl‐2/Bcl‐xL and thus released BECN1 in cell would trigger excessive autophagy [49]. Alternatively, as loss of mitochondrial permeability transition would induce autophagy (mitophagy), BNIP3 might also induce autophagy indirectly as a consequence of such mitochondrial injury.
In summary, we systematically studied the extent to which autophagy contributes to neuronal death in cerebral hypoxia and ischemia. We showed that autophagy was dramatically increased in neurons after H/I injury. The increase of autophagy was accompanied with an increment of autophagic neuronal death. Inhibition of autophagy significantly reduced autophagic neuronal death. Our data suggests that excessive autophagy is a contributing factor of neuronal death in cerebral ischemia.
Conflict of Interest
The authors declare that they have no conflict of interest.
Acknowledgments
We thank Dr. James Thliveris and Mr. Lin Zhang for assistance in electron microscopy. We also thank Teng Guan, Shenghua Zhu, and Jacqueline Hogue for their insightful comments on the manuscript. This work was supported by grants from Canadian Institutes of Health Research, Canadian Stroke Network, and Manitoba Health Research Council to JK. RS is a recipient of graduate studentships from the Manitoba Health Research Council and Manitoba Institute of Child Health.
References
- 1. Hara T, Nakamura K, Matsui M, et al Suppression of basal autophagy in neural cells causes neurodegenerative disease in mice. Nature 2006;441:885–889. [DOI] [PubMed] [Google Scholar]
- 2. Komatsu M, Waguri S, Chiba T, et al Loss of autophagy in the central nervous system causes neurodegeneration in mice. Nature 2006;441:880–884. [DOI] [PubMed] [Google Scholar]
- 3. Martinez‐Vicente M, Talloczy Z, Wong E, et al Cargo recognition failure is responsible for inefficient autophagy in Huntington's disease. Nat Neurosci 2010;13:567–576. [DOI] [PMC free article] [PubMed] [Google Scholar]
- 4. Fornai F, Longone P, Ferrucci M, et al Autophagy and amyotrophic lateral sclerosis: The multiple roles of lithium. Autophagy 2008;4:527–530. [DOI] [PubMed] [Google Scholar]
- 5. Pickford F, Masliah E, Britschgi M, et al The autophagy‐related protein beclin 1 shows reduced expression in early Alzheimer disease and regulates amyloid beta accumulation in mice. J Clin Invest 2008;118:2190–2199. [DOI] [PMC free article] [PubMed] [Google Scholar]
- 6. Green DR, Galluzzi L, Kroemer G. Mitochondria and the autophagy‐inflammation‐cell death axis in organismal aging. Science 2011;333:1109–1112. [DOI] [PMC free article] [PubMed] [Google Scholar]
- 7. Nixon RA, Wegiel J, Kumar A, et al Extensive involvement of autophagy in Alzheimer disease: An immuno‐electron microscopy study. J Neuropathol Exp Neurol 2005;64:113–122. [DOI] [PubMed] [Google Scholar]
- 8. Kabuta T, Suzuki Y, Wada K. Degradation of amyotrophic lateral sclerosis‐linked mutant Cu,Zn‐superoxide dismutase proteins by macroautophagy and the proteasome. J Biol Chem 2006;281:30524–30533. [DOI] [PubMed] [Google Scholar]
- 9. Qin AP, Liu CF, Qin YY, et al Autophagy was activated in injured astrocytes and mildly decreased cell survival following glucose and oxygen deprivation and focal cerebral ischemia. Autophagy 2010;6:738–753. [DOI] [PubMed] [Google Scholar]
- 10. Koike M, Shibata M, Tadakoshi M, et al Inhibition of autophagy prevents hippocampal pyramidal neuron death after hypoxic‐ischemic injury. Am J Pathol 2008;172:454–469. [DOI] [PMC free article] [PubMed] [Google Scholar]
- 11. Adhami F, Liao G, Morozov YM, et al Cerebral ischemia‐hypoxia induces intravascular coagulation and autophagy. Am J Pathol 2006;169:566–583. [DOI] [PMC free article] [PubMed] [Google Scholar]
- 12. Uchiyama Y, Koike M, Shibata M. Autophagic neuron death in neonatal brain ischemia/hypoxia. Autophagy 2008;4:404–408. [DOI] [PubMed] [Google Scholar]
- 13. Wong E, Cuervo AM. Autophagy gone awry in neurodegenerative diseases. Nat Neurosci 2010;13:805–811. [DOI] [PMC free article] [PubMed] [Google Scholar]
- 14. Zhang Z, Yang X, Zhang S, Ma X, Kong J. BNIP3 upregulation and EndoG translocation in delayed neuronal death in stroke and in hypoxia. Stroke 2007;38:1606–1613. [DOI] [PubMed] [Google Scholar]
- 15. Brewer GJ. Serum‐free B27/neurobasal medium supports differentiated growth of neurons from the striatum, substantia nigra, septum, cerebral cortex, cerebellum, and dentate gyrus. J Neurosci Res 1995;42:674–683. [DOI] [PubMed] [Google Scholar]
- 16. Rice JE, 3rd , Vannucci RC, Brierley JB. The influence of immaturity on hypoxic‐ischemic brain damage in the rat. Ann Neurol 1981;9:131–141. [DOI] [PubMed] [Google Scholar]
- 17. Paglin S, Hollister T, Delohery T, et al A novel response of cancer cells to radiation involves autophagy and formation of acidic vesicles. Cancer Res 2001;61:439–444. [PubMed] [Google Scholar]
- 18. Parks DR, Bryan VM, Oi VT, Herzenberg LA. Antigen‐specific identification and cloning of hybridomas with a fluorescence‐activated cell sorter. Proc Natl Acad Sci U S A 1979;76:1962–1966. [DOI] [PMC free article] [PubMed] [Google Scholar]
- 19. Azad MB, Chen Y, Henson ES, et al Hypoxia induces autophagic cell death in apoptosis‐competent cells through a mechanism involving BNIP3. Autophagy 2008;4:195–204. [DOI] [PMC free article] [PubMed] [Google Scholar]
- 20. Biederbick A, Kern HF, Elsasser HP. Monodansylcadaverine (MDC) is a specific in vivo marker for autophagic vacuoles. Eur J Cell Biol 1995;66:3–14. [PubMed] [Google Scholar]
- 21. Munafo DB, Colombo MI. A novel assay to study autophagy: Regulation of autophagosome vacuole size by amino acid deprivation. J Cell Sci 2001;114:3619–3629. [DOI] [PubMed] [Google Scholar]
- 22. Bellot G, Garcia‐Medina R, Gounon P, et al Hypoxia‐induced autophagy is mediated through hypoxia‐inducible factor induction of BNIP3 and BNIP3L via their BH3 domains. Mol Cell Biol 2009;29:2570–2581. [DOI] [PMC free article] [PubMed] [Google Scholar]
- 23. Seglen PO, Gordon PB. 3‐Methyladenine: Specific inhibitor of autophagic/lysosomal protein degradation in isolated rat hepatocytes. Proc Natl Acad Sci U S A 1982;79:1889–1892. [DOI] [PMC free article] [PubMed] [Google Scholar]
- 24. Scarlatti F, Bauvy C, Ventruti A, et al Ceramide‐mediated macroautophagy involves inhibition of protein kinase B and up‐regulation of beclin 1. J Biol Chem 2004;279:18384–18391. [DOI] [PubMed] [Google Scholar]
- 25. Hossmann KA. Pathophysiology and therapy of experimental stroke. Cell Mol Neurobiol 2006;26:1057–1083. [DOI] [PubMed] [Google Scholar]
- 26. Lin CH, Chen PS, Gean PW. Glutamate preconditioning prevents neuronal death induced by combined oxygen‐glucose deprivation in cultured cortical neurons. Eur J Pharmacol 2008;589:85–93. [DOI] [PubMed] [Google Scholar]
- 27. Wieloch T, Siesjo BK. Ischemic brain injury: The importance of calcium, lipolytic activities, and free fatty acids. Pathol Biol (Paris) 1982;30:269–277. [PubMed] [Google Scholar]
- 28. Biedler JL, Roffler‐Tarlov S, Schachner M, Freedman LS. Multiple neurotransmitter synthesis by human neuroblastoma cell lines and clones. Cancer Res 1978;38:3751–3757. [PubMed] [Google Scholar]
- 29. Zheng Z, Kim JY, Ma H, Lee JE, Yenari MA. Anti‐inflammatory effects of the 70 kDa heat shock protein in experimental stroke. J Cereb Blood Flow Metab 2008;28:53–63. [DOI] [PubMed] [Google Scholar]
- 30. Yan CH, Liang ZQ, Gu ZL, Yang YP, Reid P, Qin ZH. Contributions of autophagic and apoptotic mechanisms to CrTX‐induced death of K562 cells. Toxicon 2006;47:521–530. [DOI] [PubMed] [Google Scholar]
- 31. Kabeya Y, Mizushima N, Ueno T, et al LC3, a mammalian homologue of yeast Apg8p, is localized in autophagosome membranes after processing. EMBO J 2000;19:5720–5728. [DOI] [PMC free article] [PubMed] [Google Scholar]
- 32. Mann SS, Hammarback JA. Molecular characterization of light chain 3. A microtubule binding subunit of MAP1A and MAP1B. J Biol Chem 1994;269:11492–11497. [PubMed] [Google Scholar]
- 33. Mizushima N. Methods for monitoring autophagy. Int J Biochem Cell Biol 2004;36:2491–2502. [DOI] [PubMed] [Google Scholar]
- 34. Schwartz LM, Smith SW, Jones ME, Osborne BA. Do all programmed cell deaths occur via apoptosis? Proc Natl Acad Sci U S A 1993;90:980–984. [DOI] [PMC free article] [PubMed] [Google Scholar]
- 35. Bursch W, Ellinger A, Gerner C, Frohwein U, Schulte‐Hermann R. Programmed cell death (PCD). Apoptosis, autophagic PCD, or others? Ann N Y Acad Sci 2000;926:1–12. [DOI] [PubMed] [Google Scholar]
- 36. Bursch W, Hochegger K, Torok L, Marian B, Ellinger A, Hermann RS. Autophagic and apoptotic types of programmed cell death exhibit different fates of cytoskeletal filaments. J Cell Sci 2000;113(Pt 7):1189–1198. [DOI] [PubMed] [Google Scholar]
- 37. Schmued LC, Stowers CC, Scallet AC, Xu L. Fluoro‐Jade C results in ultra high resolution and contrast labeling of degenerating neurons. Brain Res 2005;1035:24–31. [DOI] [PubMed] [Google Scholar]
- 38. Chu CT, Plowey ED, Dagda RK, Hickey RW, Cherra SJ, 3rd , Clark RS. Autophagy in neurite injury and neurodegeneration: in vitro and in vivo models. Methods Enzymol 2009;453:217–249. [DOI] [PMC free article] [PubMed] [Google Scholar]
- 39. Chen Y, McMillan‐Ward E, Kong J, Israels SJ, Gibson SB. Mitochondrial electron‐transport‐chain inhibitors of complexes I and II induce autophagic cell death mediated by reactive oxygen species. J Cell Sci 2007;120:4155–4166. [DOI] [PubMed] [Google Scholar]
- 40. Jung CH, Ro SH, Cao J, Otto NM, Kim DH. mTOR regulation of autophagy. FEBS Lett 2010;584:1287–1295. [DOI] [PMC free article] [PubMed] [Google Scholar]
- 41. Law BK. Rapamycin: An anti‐cancer immunosuppressant? Crit Rev Oncol Hematol 2005;56:47–60. [DOI] [PubMed] [Google Scholar]
- 42. Levine B, Klionsky DJ. Development by self‐digestion: Molecular mechanisms and biological functions of autophagy. Dev Cell 2004;6:463–477. [DOI] [PubMed] [Google Scholar]
- 43. Rami A. Upregulation of Beclin 1 in the ischemic penumbra. Autophagy 2008;4:227–229. [DOI] [PubMed] [Google Scholar]
- 44. Puyal J, Clarke PG. Targeting autophagy to prevent neonatal stroke damage. Autophagy 2009;5:1060–1061. [DOI] [PubMed] [Google Scholar]
- 45. Liang XH, Kleeman LK, Jiang HH, et al Protection against fatal Sindbis virus encephalitis by beclin, a novel Bcl‐2‐interacting protein. J Virol 1998;72:8586–8596. [DOI] [PMC free article] [PubMed] [Google Scholar]
- 46. Yu L, Alva A, Su H, Regulation of an ATG7‐beclin 1 program of autophagic cell death by caspase‐8. Science 2004;304:1500–1502. [DOI] [PubMed] [Google Scholar]
- 47. Elmore SP, Qian T, Grissom SF, Lemasters JJ. The mitochondrial permeability transition initiates autophagy in rat hepatocytes. FASEB J 2001;15:2286–2287. [DOI] [PubMed] [Google Scholar]
- 48. Twig G, Elorza A, Molina AJ, et al Fission and selective fusion govern mitochondrial segregation and elimination by autophagy. EMBO J 2008;27:433–446. [DOI] [PMC free article] [PubMed] [Google Scholar]
- 49. Zhang H, Bosch‐Marce M, Shimoda LA, et al Mitochondrial autophagy is an HIF‐1‐dependent adaptive metabolic response to hypoxia. J Biol Chem 2008;283:10892–10903. [DOI] [PMC free article] [PubMed] [Google Scholar] [Retracted]