Abstract
The growth rate of climate forcing by measured greenhouse gases peaked near 1980 at almost 5 W/m2 per century. This growth rate has since declined to ≈3 W/m2 per century, largely because of cooperative international actions. We argue that trends can be reduced to the level needed for the moderate “alternative” climate scenario (≈2 W/m2 per century for the next 50 years) by means of concerted actions that have other benefits, but the forcing reductions are not automatic “co-benefits” of actions that slow CO2 emissions. Current trends of climate forcings by aerosols remain very uncertain. Nevertheless, practical constraints on changes in emission levels suggest that global warming at a rate +0.15 ± 0.05°C per decade will occur over the next several decades.
Keywords: climate change|greenhouse gases|aerosols|air pollution
Global surface temperature increased in the past century by more than 0.5°C (1, 2). This warming is, at least in part, a result of anthropogenic climate forcing agents (3).
A climate forcing is an imposed, natural, or anthropogenic perturbation of the Earth's energy balance with space (3, 4). Increasing anthropogenic greenhouse gases (GHGs) cause the largest positive (warming) forcing. Thus the proposed Kyoto Protocol (http://www.unfccc.org/resource/docs/convkp/kpeng.html) is designed to slow emissions of several GHGs.
We calculate the trend of climate forcing caused by measured changes in GHGs and discuss implications. We emphasize the importance of other forcings that are not well measured.
Climate Forcings
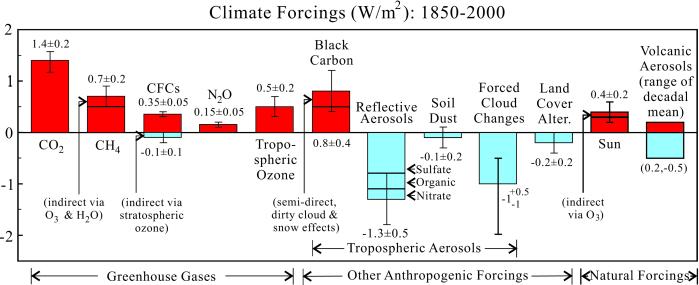
Fig. 1 shows estimates of climate forcings since 1850. Most of these are similar to previous estimates (3, 5), but a few key forcings warrant discussion.
Figure 1.
Estimated climate forcings; error bars are partly subjective 1σ uncertainties.
Methane.
The estimated CH4 forcing is half as large as that for CO2. CH4 is included in the Kyoto Protocol but with a small weight compared with CO2. We will argue that CH4 deserves greater attention and should not be lumped together with CO2.
The CH4 forcing of 0.7 W/m2, composed of 0.5 W/m2 direct forcing and 0.2 W/m2 indirect forcing, is based on line-by-line radiation calculations using current absorption line data (5). Recent estimates of the direct forcing based in part on satellite measurements of CH4 (6, 7) are slightly larger than our value, whereas the Intergovernmental Panel on Climate Change (IPCC) estimate of 0.49 W/m2 for 1750–2000 (3) is slightly smaller.
Our calculated indirect forcing of 0.1 W/m2 for CH4 oxidized to H2O in the stratosphere (5), based on a chemical transport model (8), requires only one-third of the observed stratospheric H2O increase (9) to be ascribed to CH4. The indirect forcing of 0.1 W/m2 for the effect of increasing CH4 on O3 (5) requires one-eighth to one-quarter of the tropospheric O3 increase to be ascribed to CH4.
Troposphere Ozone.
Recent research (ref. 10; D. Shindell, personal communication) suggests that the O3 forcing could be 0.7–0.8 W/m2, rather than the 0.3–0.4 W/m2 commonly assumed (3). Limited observations of ozone in the 19th century imply the larger forcing, but calibration of that data is uncertain and atmospheric chemistry models did not yield such a large change. However, Mickley et al. (10) show that uncertainties in the magnitude of natural ozone precursors, especially NOX from lightning and soils, are enough to permit the larger ozone change. We conclude that the O3 forcing is probably in the range 0.4 to 0.8 W/m2.
Black Carbon (BC).
BC aerosols (soot), formed by incomplete combustion, cause a positive climate forcing by absorbing sunlight and heating the lower atmosphere (12). IPCC (3) estimates the BC forcing as +0.25 W/m2, but it is very uncertain. Jacobson (13) calculates a BC forcing of ≈0.5 W/m2, including enhanced absorption that occurs with internal mixing of aerosols.
Hansen (14) suggests that indirect effects of BC may increase its net forcing to 0.5–1 W/m2. A decrease in the mean albedo of snow and sea ice by 0.02, for example, would cause a forcing of 0.25 W/m2. Limited data (15, 16) for the effect of BC on snow and sea ice albedo in the Northern Hemisphere suggest a forcing at least that large. Perhaps this effect contributes to observed sea ice loss in the Northern Hemisphere (17).
Observations of BC aerosols are inadequate to define their forcing. However, from a survey of observations we estimate the mean single scatter albedo of anthropogenic aerosols, weighted by optical depth, as ≈0.95. The aerosol absorption, mainly caused by BC, reduces the negative aerosol forcing by sulfates, nitrates, and organic carbon by about half (4). Thus the reflective aerosol forcing (Fig. 1) implies a direct BC forcing of ≈0.6 W/m2 and supports inference of a net BC forcing of 0.5–1 W/m2.
Reflective Aerosols.
Estimates of climate forcing by sulfate aerosols fall mainly in the range −0.3 to −1.0 W/m2 (3). However, the smaller values do not fully account for the swelling of sulfate aerosols in regions of high humidity (18). Thus the sulfate forcing probably falls in the range −0.6 to −1.0 W/m2.
Organic aerosols come from biomass burning, fossil fuels, and atmospheric oxidation of biogenic and anthropogenic volatile organic compounds. The estimated anthropogenic forcing, −0.3 W/m2, is uncertain by about a factor of 2 (3).
Ammonium nitrate is estimated to cause a climate forcing of about −0.2 W/m2 (18). Nitrates are not included in the IPCC estimates of climate forcing (3). The magnitude of the forcing estimated here (Fig. 1) for reflective aerosols and soil dust (−1.4 ± 0.5 W/m2) is about double the central IPCC estimate, but it is within their range of uncertainty (chapter 5 in ref. 3).
Net Climate Forcing.
Other climate forcings in Fig. 1 are discussed elsewhere (3, 5). The sum of all of the positive forcings is 4.3 ± 0.6 W/m2, about three times greater than the CO2 forcing (1.4 ± 0.2 W/m2). The sum of the negative forcings is −2.7 ± 0.9 W/m2, and the net forcing is 1.6 ± 1.1 W/m2.
Most climate simulations, as summarized by the IPCC (3), do not include all of the negative forcings of Fig. 1; indeed, if they did, and other forcings were unchanged, little global warming would be obtained. However, they also do not include the full BC, O3, and CH4 forcings, estimated in Fig. 1 as 2 W/m2. With this forcing included, and a climate sensitivity of ¾°C per W/m2, realistic rates of warming and heat storage in the ocean are obtained (8, 19). Although the sum of all forcings coincidentally is similar to that for CO2 alone, knowledge of each of the large forcings in Fig. 1 is needed for development of effective policies.
Greenhouse Gas Trends
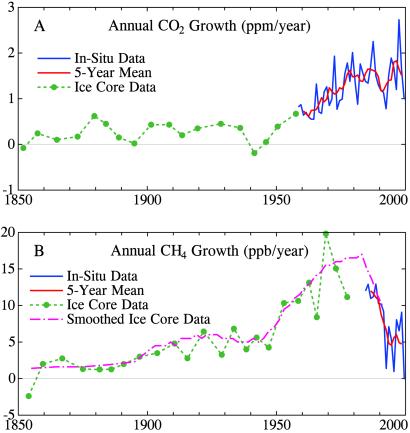
Fig. 2A shows the growth rate of atmospheric CO2. Data before 1958 are obtained from bubbles of air trapped in polar ice sheets, whereas subsequent data are atmospheric observations.
Figure 2.
Growth rate of atmospheric CO2 and CH4 based on ice core measurements of Etheridge et al. (20, 21), in situ CO2 observations initiated by C. D. Keeling (11), and National Oceanic and Atmospheric Administration (NOAA) CO2 and CH4 observations made available by the NOAA Climate Monitoring and Diagnostics Laboratory (ftp://ftp.cmdl.noaa.gov/ccg).
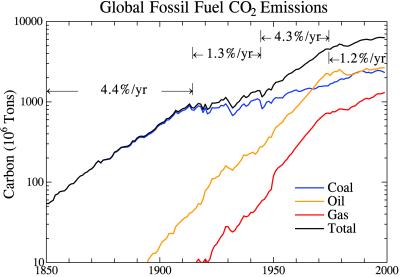
The annual growth of CO2 increased rapidly between World War II and the oil crisis of the mid-1970s, an interval during which fossil fuel CO2 emissions increased exponentially at more than 4%/year. Since then the annual CO2 growth has been relatively flat at about 1.5 ppm/year. As fossil fuel CO2 emissions have increased at about 1%/year during the past 25 years (see below), the flat growth rate implies some increase in the net terrestrial and/or oceanic uptakes of CO2.
Fig. 2B shows the growth rate of atmospheric CH4. After World War II the annual growth of CH4 increased from about 5 ppb/year to about 15 ppb/year. Even though data are limited for 1965–1985, it is clear, based on the prior and subsequent absolute CH4 amounts, that growth averaged about 15 ppb/year during that period. Since 1980 the CH4 growth rate has declined by about two-thirds. Causes of the slower CH4 growth are uncertain, as both a leveling off of CH4 sources (21, 22) and a decreasing CH4 lifetime (23–25) may contribute. Better measurements are needed of the trends of CH4 sources and emissions that affect atmospheric OH, the primary sink for CH4.
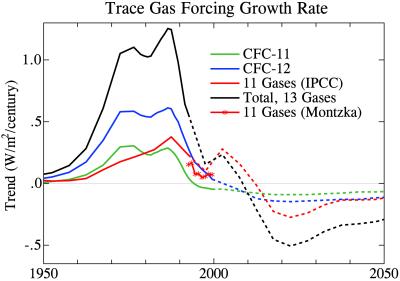
Fig. 3 shows the growth rate for climate forcing by several chlorofluorocarbons, hydrochlorofluorocarbons, chlorocarbons, and bromocarbons, which we abbreviate together as CFCs. These 13 gases are being phased out by the Montreal Protocol because of their destructive effect on stratospheric ozone. In the 1970s and 1980s their forcing increased at a rate of more than 1 W/m2 per century. As the emission of these gases has slowed, the growth rate of their climate forcing has fallen dramatically.
Figure 3.
Growth rate of climate forcing for gases controlled by the Montreal Protocol (CFC-11, CFC-12, CFC-113, CFC-114, CFC-115, CCl4, CH3CCl3, HCFC-22, HCFC-141b, HCFC-142b, HCFC-123, CF2BrCl, CF3Br) based on IPCC (appendix II of ref. 3), National Oceanic and Atmospheric Administration Climate Monitoring and Diagnostics Laboratory Global Flask Network (ftp://ftp.cmdl.noaa.gov/hats/), and data from Montzka et al. (26).
The red line in Fig. 3 is the history and projection of the 11 CFCs other than CFC-11 and CFC-12 (appendix II of ref. 3). Recent observations are available for eight of the 11 gases (26). The 11-gas forcing growth rate using observations (Fig. 4) is below the IPCC estimate, and it is less in 2000 than in 1999. This finding suggests that the 13-gas CFC forcing growth rate may turn negative sooner than the 2010 date of the IPCC projections.
Figure 4.
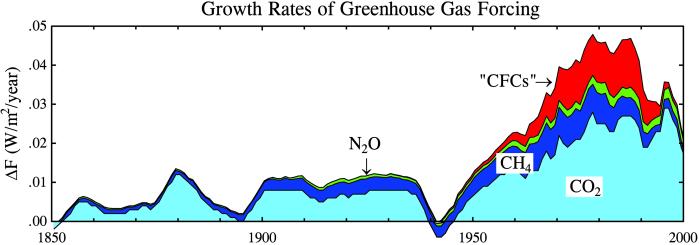
Growth rate of climate forcing by well-mixed greenhouse gases (5-year mean, except 3-year mean for 1999 and 1-year mean for 2000). O3 and stratospheric H2O, which were not well measured, are not included.
Greenhouse Gas Climate Forcing Trend
Fig. 4 shows the growth rate of GHG forcing, which peaked about 1980 at almost 5 W/m2 per century. If that rate had been maintained, a forcing equivalent to doubled CO2 (4 W/m2) would have been obtained by 2050. Some climate scenarios in the 1980s assumed that the exponential growth of 1945–1975 would continue, leading to doubled CO2 forcing by 2025 (14). In reality, the growth rate has decelerated to about 3 W/m2 per century.
The slowdown was caused mainly by the Montreal Protocol phase-out of ozone-depleting gases. The protocol has been a model of international environmental cooperation as developed countries produced alternative technologies and provided a multilateral fund to help developing countries replace CFC technologies. The cost over a decade was about $1 billion.
Another factor allowing slowdown of the climate forcing growth rate was flattening of the CO2 growth rate (Fig. 2A), which was related to the slower growth rate of fossil fuel CO2 emissions (Fig. 5), discussed above in connection with Fig. 2A.
Figure 5.
CO2 emissions based on data of Marland and Boden (27).
The recent flat growth rate of CO2, despite continuing increase of CO2 emissions at about 1%/year, is in part a reflection of increased terrestrial sequestration of carbon in the 1990s (28). A flat growth rate of the CO2 forcing probably can be maintained only by means of further slowing of CO2 emissions growth to about 0%/year, i.e., constant emissions. Stabilization of atmospheric composition will require that CO2 emissions eventually be reduced by 50–85% (3), unless technology for CO2 sequestration is developed. We refer here to geological sequestration or injection into the deep ocean.
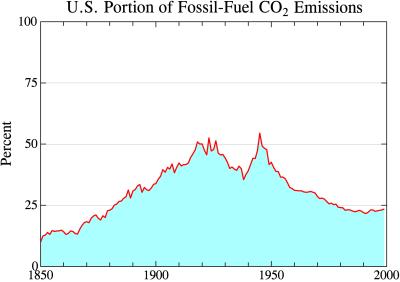
Fig. 6 shows the United States portion of global fossil fuel CO2 emissions, which increased from 10% in 1850 to 50% in 1920 as the U.S. grew and industrialized. The U.S. portion has since declined to 23% as the rest of the world industrialized, but there was a temporary spike back to 50% at the end of World War II as U.S. industry supplied the war effort.
Figure 6.
U.S. percentage of global fossil fuel CO2 emissions (27).
The principal relevance of Fig. 6 is the flattening of the trend of the U.S. portion of CO2 emissions during the 1990s, despite increasing awareness of the climate issue. As the U.S. is a global leader in technology development, it seems unlikely that the global CO2 emissions curve (Fig. 5) will level off and eventually decline unless the U.S. aggressively develops energy efficiency and non-CO2 energy sources, or CO2 sequestration.
Global Warming Potentials
Fig. 1 indicates that several climate forcing agents are significant. Thus it is important to compare the effectiveness of reducing the emissions of each of these constituents. For that purpose IPCC (3) uses global warming potentials (GWPs).
IPCC defines GWPs relative to CO2 and weights them by constituent lifetime. The detour of GWP through properties of CO2 makes it unnecessarily difficult to relate a change in emissions to expected global warming. The Kyoto Protocol chooses the 100-year GWP, which makes it appear that short-lived constituents have little value for slowing global warming.
We propose an alternative GWP (GWPa). GWPa is simply the change in climate forcing caused by a change in emissions. This forcing can be converted to an expected long-term global temperature change by multiplying by climate sensitivity, which is estimated from empirical evidence and climate models to be ¾ ± ¼°C per W/m2 (29).
We choose 50 years as the principal time frame. One hundred years is too long, because we cannot discern technology changes that will occur by 2100. A time frame less than several decades is inappropriate, because of the long life of energy infrastructure.
The present climate forcing by each constituent enters as a simple product (Table 1). Thus the forcing change as a function of emission change can be adjusted as knowledge of the present forcing improves. We use a BC forcing (0.6 W/m2) smaller than in Fig. 1 and closer to other estimates (13), thus strengthening conclusions below. The sulfate forcing includes little or no aerosol indirect forcing and is especially uncertain.
Table 1.
Climate forcings today and proposed 50-year changes
| Forcing agent | Forcing, W/m2 | Proposed change | Forcing change, W/m2 |
|---|---|---|---|
| CO2 | 1.4 | 1.5 ppm/year (75 ppm) | +1.08 |
| +1.5%/yr growth (111 ppm) | +1.54 | ||
| +1.5%/yr (devel. countries) | +1.28 | ||
| CH4 | 0.7 | −30% (1740→1400 ppb) | −0.21 |
| N2O | 0.15 | +67% (316→346 ppb) | +0.10 |
| Trop. O3 | 0.5 | −30% (of anthropogenic O3) | −0.15 |
| Strat. O3 | −0.1 | −70% (of current strat. loss) | +0.07 |
| CFCs | 0.35 | −40% | −0.14 |
| Trace | 0.02 | +500% | +0.10 |
| Soot | 0.6 | −50% (of anthropogenic BC) | −0.30 |
| Sulfate | −0.8 | −30% (of anthropo. sulfate) | +0.24 |
| Organic | −0.3 | −50% (of fossil fuel organic) | +0.06 |
| Sum (1.5 ppm/year CO2 growth) | +0.85 | ||
| Sum (+1.5% annual CO2 emissions growth) | +1.31 | ||
| Sum (+1.5% growth, developing countries only) | +1.05 | ||
We illustrate GWPa by considering plausible changes in the climate forcing agents and examining whether these would be sufficient to achieve the “alternative scenario” that we proposed previously (5). That scenario aims to keep the added climate forcing in the next 50 years at 1 W/m2 or less, and thus keep the global warming in that period at ¾°C or less (5, 8).
Carbon Dioxide.
IPCC scenarios for CO2 are a product of assumptions for population, living standards, energy sources, and technology, resulting in a huge range of CO2 trends (3, 14). Our approach is to use the historical CO2 emissions curve (Fig. 5), which includes these factors. We expect the energy supply/cost factors that caused the growth rate to decline from 4–4.5%/year to 1–1.5%/year to continue. We consider possible additional downward pressure caused by climate concerns.
If CO2 continues to increase 1.5 ppm/year, which would require that global emissions be kept about the same as today, the added forcing in 50 years will be ≈1.08 W/m2 (5). Achievement of flat CO2 emissions will require major efforts in energy efficiency, fuel switching, and renewable energies. If, rather than being constant, CO2 emissions increase exponentially at 1.5%/year, the added forcing in 50 years is 1.54 W/m2. This growth rate is perhaps the largest plausible one, exceeding that of the past 25 years. If 1.5%/year growth occurs in developing countries and emissions in developed countries are constant at the 2000 level, the added forcing is 1.28 W/m2 (Table 1).
Methane.
The IPCC estimate of additional CH4 forcing between 2000 and 2050 declined to 0.04–0.31 W/m2 in their recent report (3) from 0.17–0.44 W/m2 in their previous report. Methane growth in the 1990s fell well below all IPCC scenarios (5).
Our alternative scenario (5) aims for a 30% reduction of CH4 forcing by means of actions such as improved agricultural practices and capture of CH4 escaping from landfills, coal mining, oil and gas production, and anaerobic waste management lagoons. The required reduction of anthropogenic CH4 sources is ≈25%, because of OH feedback (30). These actions have economic benefits that help offset costs (31), but they are unlikely to occur without global cooperation and sharing of technology.
A 30% reduction of the CH4 forcing yields a negative forcing of −0.21 W/m2 (Table 1). This diminution of climate forcing is comparable to that expected in the next 50 years from the Kyoto Protocol, which aims to reduce GHG emissions of developed countries by the equivalent of ≈5% of their CO2 emissions.
Air Pollution.
IPCC scenarios (3) have air pollution, and thus climate forcing by O3 and BC, increasing in the next 50 years.
We argue that human and economic costs of air pollution make a global focus on air pollution desirable, if not inevitable (5).
Air pollution growth will slow as a co-benefit of slower fossil fuel growth. However, we contend that absolute reductions of O3 and BC are possible. BC is a product of incomplete combustion, whereas O3 is produced by emissions of reactive organic gases (ROGs), NOX, CO, and CH4 (30). Improved combustion technologies can reduce emissions of both BC and O3 precursors (32). If anthropogenic CH4 is reduced 30%, emissions of ROGs, NOX, and CO must be reduced about 40% to achieve a 30% reduction of anthropogenic O3 (ref. 30; M. Prather, personal communication). We suggest that 30% reduction of global O3 pollution by 2050 is a realistic goal (5), based on reductions in some developed countries (32) and technology trends.
BC (soot) emissions are sensitive to industrial and vehicular technologies (33) and domestic cooking and heating technologies (34). Our alternative scenario (5) aims to reduce anthropogenic BC emissions enough to balance warming from reduced sulfates (Table 1). Sulfates, the main source of acid rain, need to be reduced, so we suggest an emphasis on also reducing BC.
Aerosol climate forcing will be very uncertain until global composition-specific aerosol measurements allow definition of trends. Our estimated forcing of +0.3 W/m2 for reduction of reflective aerosols does not include changes of the indirect aerosol effect, which is very uncertain. If the indirect aerosol forcing is large, reduction of reflecting aerosols could seriously aggravate global warming. Given that oceans cover 70% of the world, one stop-gap strategy may be to allow ships to continue to use high sulfur fuel for a time. However, we do not recommend use of one pollutant to mask the effect of another. It may be possible to minimize undesirable effects with optimum prioritization and sequencing of emission reductions, but recommendations require better understanding of aerosol climate forcings and their environmental effects.
Other Forcings.
Table 1 includes other climate forcing changes anticipated by 2050. The N2O increase, based on current trends (8), is similar to the IPCC (3) estimate. The CFC decrease, from Fig. 3, is in accord with the Montreal Protocol and IPCC (3) estimates, as is the resulting stratospheric O3 recovery.
Trace in Table 1 refers to trace gases outside the Montreal Protocol, including perfluorocarbons, hydrofluorocarbons, and SF6. IPCC (3) scenarios yield a forcing ranging from 0.09 to 0.19 W/m2. The higher values are caused mainly by HFC-134a, whose growth rate has fallen below IPCC estimates. We assume an additional forcing of 0.1 W/m2 by these trace gases; however, it could be reduced by minimizing HFC-134a production (5).
Net GWPa, 2000–2050.
The added climate forcing in the next 50 years is 0.85 W/m2 if CO2 growth is flat at 1.5 ppm/year and if the above reductions of CH4, O3, and BC are achieved. Kyoto emission reductions do not appear explicitly in this case, but note that keeping CO2 emissions flat surely requires improved energy efficiencies, fuel switching, and alternative energy sources as envisaged under Kyoto emission restrictions.
If global CO2 emissions increase exponentially at 1.5%/year for the next 50 years, but air pollution and CH4 emissions are reduced as suggested above, the forcing increase is 1.31 W/m2. This forcing scenario exceeds the goal of 1 W/m2 or less in the alternative scenario. Moreover, the forcing growth rate is accelerating in 2050, contrary to the goal of decelerating toward stabilization of atmospheric composition later in the century.
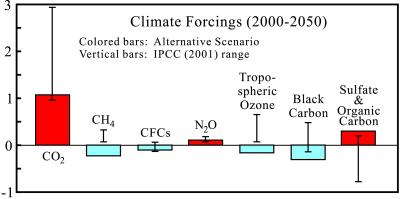
Fig. 7 summarizes differences between the alternative scenario and IPCC scenarios (3). First, CH4, O3, and BC increase in the IPCC scenarios, whereas the alternative scenario has a global reduction of air pollution. Second, the IPCC includes CO2 growth rates that we contend are unrealistically large.
Figure 7.
Climate forcing scenario for 2000–2050 that yields a forcing of 0.85 W/m2 (colored bars), including small forcings from stratospheric ozone recovery and trace gases (Table 1).
Our approach for CO2 is to study historical emission trends (Fig. 5) and consider plausible changes. Exponential emissions growth at 1.5%/year for 50 years yields a CO2 forcing of 1.54 W/m2 (Table 1). A forcing of 3 W/m2 requires more than 4%/year exponential growth for 50 years. Such a scenario understates trends toward improved energy efficiency and decarbonization of energy sources (figure 8 in ref. 35). The factors that caused the growth rate to slow from 4%/year to 1%/year since the 1970s remain in place and are joined by a slowing population growth rate (36) and international concerns about global warming. Reacceleration from 1%/year to 4%/year growth does not seem credible.
Global Warming, 2000–2050.
A byproduct of the above analysis is the conclusion that future global warming can be predicted much more accurately than is generally realized. We show elsewhere (8) that a forcing of 1.08 W/m2 yields a warming of ¾°C by 2050 in transient climate simulations with a model having equilibrium sensitivity of ¾°C per W/m2.
We contend that a forcing much smaller than 0.85 W/m2 is unlikely, because fossil fuels are expected to be the primary energy source for at least several decades. Rapid introduction of nonfossil energies or CO2 sequestration might reduce the forcing by a few tenths of 1 W/m2. However, much of the warming in the next 50 years will be from presently “unrealized warming” caused by the existing planetary radiative imbalance of at least 0.5 W/m2 (8, 37). Slowing CO2 emissions in the second quartile of the century, although crucial for stabilizing atmospheric composition later in the century, would have only a small effect on the warming in 2050. These considerations suggest a minimum warming of 0.5°C by 2050.
At the other extreme, CO2 growth exceeding exponential at 1.5%/year would be inconsistent with historical trends and with the negative feedback caused by human concern about climate change. Thus the maximum CO2 forcing is 1.28–1.54 W/m2 (Table 1). BC and O3 are unlikely to be much greater in 2050 than today. Indeed, China has already begun to reduce its air pollution (38) and other developing countries are probably near their limits. Continued global warming would produce at least moderate public concern, thus limiting added forcing to about 1.5 W/m2 and realized warming to about 1°C.
Given these constraints on climate forcing trends, we predict additional warming in the next 50 years of ¾ ± ¼°C, a warming rate of 0.15 ± 0.05°C per decade. A slower warming rate will occur in the second half of the century, assuming that the climate forcing growth rate begins to trend downward before 2050.
Summary
A remarkable deceleration in the growth rate of GHG climate forcing occurred in the past 20 years. The slowdown was caused mainly by phase-out of CFCs. It was accomplished by means of cooperative, not punitive, international actions. Developed countries, through the Global Environmental Facility of the World Bank, provided support to developing countries for alternative technologies and phase-out of CFC production. Similar cooperation on other climate forcings could alleviate future global warming.
Methane.
CH4 has analogies to CFCs. Technologies are within reach for reducing CH4 emissions. As with CFCs, the cost of actions to reduce CH4 can be much less than the cost of dealing with CO2. Developed countries, in addition to reducing their own sources, could support the implementation of required technologies in developing countries. By targeting emission reductions that have some economic benefits, it should be possible to find self-sustaining reductions.
Methane, with a climate forcing half as great as that of CO2, provides an opportunity for a global warming success story. A halt and even reversal of its growth is possible, it could occur quickly, and it could provide an example for cooperation on CO2. Success in halting or even reversing growth of CH4 will not remove the need to slow CO2 emissions.
Air Pollution.
Ozone and aerosols are prime air pollutants. All countries have strong incentives for reducing air pollution, which affects human health and agricultural productivity. In India alone it is estimated that 270,000 children under age 5 die each year of acute respiratory infections caused by particulate air pollution (39). Global deaths from air pollution are at least one million annually (40). Economic costs in several European countries are estimated at 1.6% of their gross domestic products (41).
Climate forcing by O3 and BC aerosols combined may be comparable to that of CO2 (Fig. 1), yet neither constituent is included in the Kyoto Protocol. Some reduction in air pollution may occur as an incidental cobenefit of reduced fossil fuel use, but the small Kyoto emission reduction may be unnoticeable. Much larger reductions of air pollution are feasible. Achievement requires a strategy that explicitly targets O3 and BC. Here again there is a need and opportunity for global cooperation in technology development and implementation.
It should not be imagined that O3 and BC reductions can halt global warming. Our aim in targeting O3 and BC is to alleviate the warming expected to accompany reduction of reflective aerosols. This scenario contrasts with the IPCC scenarios, which have increasing O3 and BC in the next 50 years (Fig. 7). Targeting O3 and BC moderates the warming while delivering great benefits to human health and agricultural productivity. However, it does not remove the need to slow CO2 emissions.
Carbon Dioxide.
Increasing CO2 causes the largest positive climate forcing now and is likely to be the dominant forcing in the future. Added CO2 forcing in the next 50 years should be about 1 W/m2 if CO2 emissions level out at today's amount. This level is far less than in business-as-usual scenarios that yield a specter of imminent disaster, but it is enough to cause substantial climate change. If flat emissions continued indefinitely, warming would be expected to continue at a rate 1.5 ± 0.5°C per century. Thus CO2 emissions must be curtailed eventually, or captured and sequestered, to stabilize atmospheric composition.
A reasonable immediate goal is flat global emissions in the present decade by emphasizing energy efficiency, fuel switching, and renewable energy. This goal seems feasible, as the growth in CO2 emissions in the past decade was less than 1%/year, despite strong global economic growth. However, achievement of flat emissions is unlikely without concerted actions to remove barriers to efficiency (42) and promote non-CO2 energy sources.
As energy needs grow, it will be necessary to have increasing amounts of energy from sources producing little CO2 or to capture and sequester fossil fuel CO2. Capture of CO2 becomes more practical as an increasing portion of energy use is in the form of clean electrical energy generated at power stations.
Competitive development of technologies that produce little CO2, or sequester it, should be accelerated now. Then, as evidence for and concern about climate change increases, it may become feasible to achieve a slowing of CO2 emissions and a forcing growth rate even smaller than 1 W/m2 in 50 years.
Global Warming.
Current trends and projections of climate forcings lead us to predict global warming for several decades at a rate 0.15 ± 0.05°C per decade. Although this warming is more moderate than in business-as-usual scenarios, if it is maintained for a century the Earth's temperature will approach that of the middle Pliocene (2.75 million years ago), when the world was about 2°C warmer than today and sea level was at least 25 m higher (43). This conclusion supports the need for actions that slow the growth of climate forcings.
It is now impossible to avoid global warming this century. However, the actions outlined here can slow the warming, while having other benefits that justify the actions. If CO2 emissions are kept level, and if technology is developed to reduce or capture emissions in the second quartile of the century, it should be possible to limit midcentury warming to 0.5°C and stabilize atmospheric composition later in the century.
Improved measurements of all climate forcings are needed to design optimum policies, which must be adjusted as understanding develops. Climate change is a long-term problem.
Acknowledgments
We thank Jesse Ausubel, John Bachmann, Tom Boden, Greg Carmichael, Ralph Cicrone, Paul Crutzen, Ed Dlugokencky, Jim Elkins, Mark Jacobson, Dina Kruger, Jos Lelieveld, Mike MacCracken, Syukuro Manabe, Steve Montzka, Tica Novakov, Michael Oppenheimer, Michael Prather, V. Ramanathan, Kirk Smith, Peter Stone, and Pieter Tans for data and suggestions.
Abbreviations
- GHG
greenhouse gas
- IPCC
Intergovernmental Panel on Climate Change
- BC
black carbon
- CFC
chlorofluorocarbon
- GWP
global warming potential
References
- 1.Hansen J, Ruedy R, Sato M, Imhoff M, Lawrence W, Easterling D, Peterson T, Karl T. J Geophys Res. 2001;106:23947–23963. [Google Scholar]
- 2.Jones P D, New M, Parker D E, Martin S, Rigor I G. Rev Geophys. 1999;37:173–199. [Google Scholar]
- 3.Houghton J T, Ding Y, Griggs D J, Noguer M, van der Linden P J, Dai X, Maskell K, Johnson C A, editors. Intergovernmental Panel on Climate Change. Climate Change 2001. Cambridge, U.K.: Cambridge Univ. Press; 2001. [Google Scholar]
- 4.Hansen J, Sato M, Ruedy R. J Geophys Res. 1997;102:6831–6864. [Google Scholar]
- 5.Hansen J, Sato M, Ruedy R, Lacis A, Oinas V. Proc Natl Acad Sci USA. 2000;97:9875–9880. doi: 10.1073/pnas.170278997. . (First Published August 15, 2000; 10.1073/pnas.170278997) [DOI] [PMC free article] [PubMed] [Google Scholar]
- 6.Minschwaner K, Carver R W, Briegleb B P, Roche A E. J Geophys Res. 1998;103:23243–23253. [Google Scholar]
- 7.Jain A K, Briegleb B P, Minschwaner K, Wuebbles D J. J Geophys Res. 2000;105:20773–20790. [Google Scholar]
- 8.Hansen, J., Sato, M., Nazarenko, L., Ruedy, R., Lacis, A., Koch, D., Tegen, I., Hall, T., Shindell, D., Stone, P., et al. (2001) J. Geophys. Res., in press.
- 9.Rosenlof K H, Oltmans S J, Kley D, Russell J M, Chiou E W, Chu W P, Johnson D G, Kelly K K, Michelson H A, Nedoluha G E, et al. Geophys Res Lett. 2001;28:1195–1198. [Google Scholar]
- 10.Mickley L J, Jacob D J, Rind D. J Geophys Res. 2001;106:3389–3399. [Google Scholar]
- 11.Keeling C D. Tellus. 1960;12:200–203. [Google Scholar]
- 12.Sateesh S K, Ramanathan V. Nature (London) 2000;405:60–63. doi: 10.1038/35011039. [DOI] [PubMed] [Google Scholar]
- 13.Jacobson M Z. Nature (London) 2001;409:695–697. doi: 10.1038/35055518. [DOI] [PubMed] [Google Scholar]
- 14.Hansen, J. E. (2002) Clim. Change, in press.
- 15.Warren S G, Wiscombe W J. J Atmos Sci. 1981;37:2734–2745. [Google Scholar]
- 16.Light B, Eicken H, Maykut G A, Grenfell T C. J Geophys Res. 1998;103:27739–27752. [Google Scholar]
- 17.Parkinson C L. Arctic. 2000;53:341–358. [Google Scholar]
- 18.Adams P J, Seinfeld J H, Koch D, Mickley L, Jacob D. J Geophys Res. 2001;106:1097–1111. [Google Scholar]
- 19.Hansen J. In: Global Warming: Science and Policy. Medlock K B, editor. Cambridge, U.K.: Cambridge Univ. Press; 2002. , in press. [Google Scholar]
- 20.Etheridge D M, Steele L P, Langenfelds R L, Francey R J, Barnola J M, Morgan V I. J Geophys Res. 1996;101:4115–4128. [Google Scholar]
- 21.Etheridge D M, Steele L P, Francey R J, Langenfelds R L. J Geophys Res. 1998;103:15979–15993. [Google Scholar]
- 22.Dlugokencky E J, Masarie K A, Lang P M, Tans P P. Nature (London) 1998;393:447–450. [Google Scholar]
- 23.Karlsdottir S, Isaksen J. Geophys Res Lett. 2000;27:93–96. [Google Scholar]
- 24.Cicerone R J, Oremland R S. Global Biogeo Cycles. 1988;2:299–327. [Google Scholar]
- 25.Wild O, Prather M J, Akimoto H. Geophys Res Lett. 2001;28:1719–1722. [Google Scholar]
- 26.Montzka S A, Butler J H, Elkins J W, Thompson T M, Clarke A D, Lock L T. Nature (London) 1999;398:690–694. [Google Scholar]
- 27.Marland G, Boden T. CO2 Information Center. Oak Ridge, TN: Oak Ridge Natl. Lab.; 1998. [Google Scholar]
- 28.Battle M, Bender M L, Tans P P, White J W C, Ellis J T, Conway T, Francey R J. Science. 2000;287:2467–2470. doi: 10.1126/science.287.5462.2467. [DOI] [PubMed] [Google Scholar]
- 29.Hansen J, Ruedy R, Lacis A, Sato M, Nazarenko L, Tausnev N, Tegen I, Koch D. In: General Circulation Model Development. Randall D, editor. New York: Academic; 2000. pp. 127–164. [Google Scholar]
- 30.Ehhalt D, Prather M. In: Climate Change 2001. Houghton J T, Ding Y, Griggs D J, Noguer M, van der Linden P J, Dai X, Maskell K, Johnson C A, editors. Cambridge, U.K.: Cambridge Univ. Press; 2001. pp. 239–289. [Google Scholar]
- 31.Hogan K B, Hoffman J S, Thompson A M. Nature (London) 1991;354:181–182. [Google Scholar]
- 32.McKee D J. Tropospheric Ozone. Boca Raton, FL: Lewis; 1957. [Google Scholar]
- 33.Hansen A D A, Novakov T. J Air Waste Manage Assoc. 1990;40:1654–1657. [Google Scholar]
- 34.Smith K R. Annu Rev Energy Environ. 2000;25:741–763. [Google Scholar]
- 35.Ausubel J H. Energy Policy. 1995;23:411–416. [Google Scholar]
- 36.Cohen J E. How Many People Can the Earth Support? New York: Norton; 1995. [Google Scholar]
- 37.Hansen J, Sato M, Ruedy R, Lacis A, Asamoah K, Beckford K, Borenstein S, Brown E, Cairns B, Carlson B, et al. J Geophys Res. 1997;102:25679–25720. [Google Scholar]
- 38.Streets, D. G., Jiang, K., Hu, X., Sinton, J. E., Zhang, X. Q., Xu, D., Jacobson, M. Z. & Hansen, J. E. (2001) Science, in press. [DOI] [PubMed]
- 39.Smith K R. Proc Natl Acad Sci USA. 2000;97:13286–13293. doi: 10.1073/pnas.97.24.13286. [DOI] [PMC free article] [PubMed] [Google Scholar]
- 40.World Health Organization. Health and Environment in Sustainable Development. Geneva: World Health Organization; 1997. [Google Scholar]
- 41.Kunzli N, Kaiser R, Medina S, Studnicka J, Chanel O, Filliger P, Herry M, Horak F, Puybonnieux-Texier V, Quenel P, et al. Lancet. 2000;356:795–801. doi: 10.1016/S0140-6736(00)02653-2. [DOI] [PubMed] [Google Scholar]
- 42.Lovins A B, Lovins L H. Climate: Making Sense and Making Money. Snowmass, CO: Rocky Mountain Institute; 1997. [Google Scholar]
- 43.Dowsett H, Barron J, Poore R Z. Marine Micropaleontol. 1996;27:13–26. [Google Scholar]


