Summary
Aims
Inflammation and apoptosis play important roles in increasing vascular permeability following subarachnoid hemorrhage (SAH). The objective of this study was to evaluate whether urinary trypsin inhibitor (UTI), a serine protease inhibitor, attenuates vascular permeability by its antiinflammatory and antiapoptotic effects after experimental SAH.
Methods
Subarachnoid hemorrhage models were established in adult male Sprague–Dawley rats by endovascular perforation. UTI was administered by intraperitoneal injection immediately following SAH. Brain edema was assessed by magnetic resonance imaging (MRI) at 24 h after SAH. Neurological deficits, brain water content, vascular permeability, malondialdehyde (MDA) concentration, and myeloperoxidase (MPO) activity were evaluated. Immunohistochemical staining and Western blot were used to explore the underlying protective mechanism of UTI.
Results
Urinary trypsin inhibitor 50,000 U/kg significantly attenuated brain edema and neurological deficits and reduced vascular permeability at 24 h after SAH. MDA concentration and MPO activity in hippocampus were significantly decreased with UTI treatment. Furthermore, the levels of phosphorylated JNK, NF‐κB (p65), tumor necrosis factor‐α (TNF‐α), interleukin‐6 (IL‐6) and proapoptotic protein p53, caspase‐3 were elevated in the microvascular endothelial cells of the hippocampus after SAH, which were alleviated with UTI treatment.
Conclusion
Urinary trypsin inhibitor reduced vascular permeability after SAH through its antiinflammatory and antiapptotic effects via blocking the activity of JNK, NF‐κB, and p53.
Keywords: Magnetic resonance imaging, Rat, Subarachnoid hemorrhage, Urinary trypsin inhibitor, Vascular permeability
Introduction
Brain edema is a common and critical pathology following subarachnoid hemorrhage (SAH), and it is an independent risk factor for mortality and poor outcome after SAH 1. Blood–brain barrier (BBB) disruption, which occurs due to the opening of endothelial tight junctions, degradation of basal lamina and loss of endothelium, increases vascular permeability and leads to vasogenic edema after SAH 2, 3. Accumulating evidence suggests that BBB disruption induced by inflammation and apoptosis of the endothelial cells contributes to increased vascular permeability after SAH 4, 5, 6, 7.
It has been reported that activated neutrophils 8 and some proinflammatory factors, such as tumor necrosis factor‐α (TNF‐α) and interleukin‐6 (IL‐6) 9, 10, are involved in this process. Following SAH, oxidative stress induced by activated neutrophils and blood components (hemoglobin) can activate mitogen‐activated protein kinase (MAPK) such as c‐Jun N‐terminal kinase (JNK) and its downstream protein, which further triggers apoptotic or inflammatory cascades in the endothelial cells 11, 12. Further, it has been reported that quenching neutrophil activity was beneficial in limiting microvascular injury and increasing survival after SAH 13. In addition, proapoptotic proteins such as p53 6 and PUMA 2 and proinflammatory factor TNF‐α 9 can induce apoptosis of endothelial cells after SAH. Therefore, strategies targeting inflammation and apoptosis may enhance vascular protection and thereby reduce BBB permeability after SAH.
Urinary trypsin inhibitor (UTI), a glycoprotein with a molecular weight of 67,000, is a protease inhibitor purified from human urine. It can suppress proteases such as trypsin, chymotrypsin, and elastase, as well as stabilize lysosomal membrane and thereby inhibit the release of lysosomal enzymes 14. It has been reported that UTI can suppress both the activity and production of elastase secreted by neutrophils 15, 16. Additionally, UTI can also reduce the production of cytokine‐induced neutrophil chemoattractants and attenuate neutrophil accumulation and thereby mitigate neutrophil‐mediated endothelial injury 16. UTI effectively alleviated reperfusion injury in ischemic liver 8, intestine 17, and kidney 18. In addition, it decreased TNF‐α concentration in a rodent hepatic ischemia‐reperfusion model 19. However, the effect of UTI on reducing vascular permeability after SAH has not yet been studied.
In this study, we aim to evaluate whether UTI reduces brain edema and improves neurological deficits after SAH. Additionally, we will investigate whether UTI maintains vascular integrity after SAH by its antiinflammatory and antiapoptotic properties.
Materials and Methods
All procedures were conducted following a protocol evaluated and approved by the Association of Medical Ethics of Peking University Health Science Center in Beijing, China.
SAH Model
The SAH model was established in male Sprague–Dawley rats (300–320 g) using endovascular perforation method as previously described 20. Briefly, under 2–3% isoflurane anesthesia, a sharpened 4‐0 nylon suture was introduced into the right internal carotid artery (ICA) until resistance was felt (approximately 18–22 mm from the common carotid bifurcation). The suture was then further advanced to perforate the bifurcation of anterior and middle cerebral arteries and withdrawn immediately. Sham‐operated rats underwent the same procedure except that the suture was withdrawn immediately after the resistance was felt. The body temperature was monitored by a rectal probe, and normothermia was maintained by a heating lamp during the procedure. After surgery, the animals were individually housed in heated cages and closely monitored until full recovery.
Experimental Groups and Treatment
Firstly, 42 rats were randomly divided into five groups. Finally, 33 rats (described as 33/42, same below) were used after excluding the dead and unqualified animals according to the inclusion criteria (see below). The dose‐dependent effects of UTI were determined at 24 h following SAH (Figure S1A). UTI was dissolved in normal saline and administered by intraperitoneal injections immediately after SAH, the vehicle group received an equivalent volume of normal saline by intraperitoneal injection after SAH.
Next, 93 (93/108) rats were randomly divided into three groups. The protective role of UTI and its mechanism were explored at 6 h or 24 h after SAH (Figure S1B).
SAH Grade
The SAH grade was blindly assessed as previously described 21. Briefly, the basal surface of brain was divided into six segments; each segment was allotted a score (0–3) depending on the amount of blood. The animals received a total score ranging from 0 to 18 by summing up the scores of each segment (sham group = 0).
In this study, after establishing SAH model, the living animals with subdural hemorrhage, extradural hemorrhage, and mild hemorrhage (SAH grade score < 12) were considered as unqualified animals and excluded from the study. Only living animals experiencing severe SAH (grade score > 12) were included in this work.
Neurobehavior Testing
Neurobehavior evaluation was performed using modified Garcia test 22 at 6 h and 24 h after surgery by the researchers blinded to the groups. Briefly, six parameters were tested: spontaneous activity, symmetrical movements of limbs, forelimbs outstretching (scored 0–3) and climbing, body proprioception, and response to whisker stimulation (scored 1–3). The total score ranged between 3 and 18.
Brain Water Content Measurement
The animal's brain was removed at 6 h or 24 h following SAH and divided into left hemisphere, right hemisphere, cerebellum, and brainstem as previously described 20. Each part was weighed immediately after removal (wet weight) and weighed again after drying in an oven at 105°C for 72 h (dry weight). The following formula was used to calculate the brain water content: ([wet weight−dry weight]/wet weight) ×100%.
BBB Permeability Assessment
Blood–brain barrier permeability was assessed by evaluating Evans blue dye extravasation at 24 h after SAH as previously described 5. Briefly, Evans blue dye (2%, 5 mL/kg) was injected over 2 min into the left femoral vein and allowed to circulate for 60 min. The animals were transcardially perfused with 0.01 mol/L phosphate‐buffered saline (PBS) at the time of euthanasia. The brains were removed and divided into the same regions as described for brain water content measurement. The brain samples were then weighed, homogenized in PBS, and centrifuged at 15,000 g for 30 min after which the supernatant was treated with an equal volume of trichloroacetic acid. Following overnight incubation at 48°C and centrifugation at 15,000 g at 48°C for 30 min, the supernatant was used for spectrophotometric quantitation of extravasated Evans blue dye at 615 nm.
Magnetic Resonance Imaging (T2‐Weighted Imaging)
All MRI data sets were quantitated using standard protocols as previously reported 23. SAH leads to global brain injury, and the hippocampus is particularly susceptible to developing edema induced by BBB disruption. Hence, we chose the hippocampus as the region of interest (ROI) 24 and performed MRI evaluation at 24 h after surgery. The rats were anesthetized and placed in a supine position on a plastic half‐pipe frame, later introduced into an experimental 3.0‐Tesla (T) MRI animal scanner (Magnetom Trio with TIM system; Siemens, Germany). The animal's head was positioned in a custom‐made “birdcage coil” (inner diameter of 30 mm) for signal excitation and detection. To minimize movement artifacts, a muscle relaxant was administered continuously via the femoral artery (diluted Tracrium or atracurium besilate; initial bolus 4 mg/kg BW followed by 4.5 mg/h; Glaxo Wellcome). The conventional T1‐imaging was applied for accurate orientation of subsequent scans and exclusion of additional pathologies such as accidental intracerebral hemorrhage (Figure S2A–C). T2‐weighted images were acquired using a multi‐echo sequence (8 TEs: 17.5 ms + 7 × 17.5 ms, TR = 2 seconds, FOV = 3.2 × 3.2 cm2, M = 128 × 64, NA = 2). The T2‐weighted data sets consisted of 8 consecutive, 1.7‐mm thick slices, with 0‐mm slice gap, centered at the level of the hippocampus and carefully avoiding the adjacent heterogeneous tissue. All images were obtained by two experienced, independent radiologists, and the established standard of ROI was consistent in each animal. ROI analysis was performed on a single slice at the same level. T2 maps were generated by mono‐exponential fitting of the T2‐weighted images on a pixel‐by‐pixel basis. The edema areas were calculated from the T2 maps, and the average T2 values of bilateral hippocampus were compared among each group.
Myeloperoxidase (MPO) Activity
At 24 h after SAH, MPO activity of hippocampus was evaluated by spectrophotometrically measuring the hydrogen peroxide‐dependent oxidation of 3,3′,5,5′‐tetramethylbenzidine at 650 nm. All procedures were directed by the instruction of MPO kit (Jiancheng Biotechnology, Nanjing, China).
Malondialdehyde (MDA) Concentration
At 24 h after SAH, MDA concentration of hippocampus (a marker of lipid peroxidation) was determined by TBA assay (expressed as nmol/g protein). All procedures were directed by the instruction of MDA kit (Jiancheng Biotechnology, Nanjing, China).
Immunohistochemical Staining
Immunohistochemical staining was performed as described previously 25. The brains were fixed by cardiovascular perfusion with 0.01 mol/L PBS and 4% paraformaldehyde and then postfixed in 4% paraformaldehyde followed by 30% sucrose. Coronal sections 10 μm thick at the level of hippocampus were cut using a cryostat (Leica Microsystems, Bannockburn, IL, USA) and mounted on to poly‐L‐lysine‐coated slides. Six series of sections were incubated with the following primary antibodies: goat antiphosphorylated JNK, mouse antiphosphorylated NF‐κB (p65), and rabbit antiphosphorylated p53 (Cell Signaling Technology, Danvers, MA, USA); and mouse anti‐TNF‐α, rabbit anticaspase‐3, and rabbit anti‐IL‐6 (Santa Cruz Biotechnology, Santa Cruz, CA, USA). The sections were then treated with the corresponding species ABC Kit (Santa Cruz Biotechnology). Peroxidase activity was revealed by 3‐diaminobenzidine (DAB) and H2O2 at room temperature for 5 min. The sections were dehydrated and cover‐slipped.
The quantitative analyses of immune‐positive cells in the representative microvessels in the hippocampus in each group were completed by two independent investigators blinded to the experimental conditions. Two sections containing bilateral hippocampus were randomly selected for each animal (n = 6/group), and four to six microvessels (20 μm in diameter) were randomly selected in each section. The endothelial cells that were stained deep yellow or brown yellow were considered as immune‐positive cells. The total number of positively stained endothelial cells in each section was determined, and statistical analysis between the groups was performed.
Immunofluorescence Staining
Brain sections were incubated overnight at 4°C with mouse antiphosphorylated NF‐κB (p65), rabbit antiphosphorylated p53, and with DAPI for nuclear staining. The corresponding fluorescence dye‐conjugated secondary antibodies (Jackson Immunoresearch, West Grove, PA, USA) were applied onto the sections and incubated for 1 h at 21°C protected from light. The sections were visualized with a fluorescence microscope, and the photomicrographs were saved and merged with Image Pro Plus software (Olympus, Melville, NY, USA). The serum instead of the primary antibody was used as negative control for each staining.
Western Blotting
Western blotting was performed as described previously 26. Under deep anesthesia, the animals were transcardially perfused with 200 mL ice‐cold 0.1 mol/L PBS (pH 7.4). Brain tissue was harvested and stored at −80°C until analysis. Protein extraction was performed by homogenizing brain samples in RIPA lysis buffer (Santa Cruz Biotechnology) followed by centrifugation at 14,000 g at 4°C for 30 min. The supernatant was used as whole cell protein extract, and the protein concentration was determined using a detergent compatible assay (Bio‐Rad, Hercules, CA, USA, Dc protein assay). Equal amount of protein (40 μg) from hippocampus was loaded on a Tris glycine gel, electrophoresed and transferred on a nitrocellulose membrane. The membrane was blocked with blocking solution and then incubated with the primary antibody overnight at 4°C. The primary antibodies (1:1000) were goat antiphosphorylated JNK, mouse antiphosphorylated NF‐κB (p65), rabbit antiphosphorylated p53 (Cell Signaling Technology), and mouse anti‐TNF‐α (Santa Cruz Biotechnology). Nitrocellulose membranes were incubated with the corresponding secondary antibodies (1:2000, Santa Cruz Biotechnology) for 1 h at room temperature. The bands were probed with a chemiluminescence reagent kit (Amersham Bioscience, Arlington Heights, IL, USA) and quantitated by densitometry with Image J software (National Institutes of Health, Bethesda, MD, USA). ß‐actin was blotted on the same membrane as a loading control.
Statistical Analysis
The neruobehavior data were expressed as median ± 25th to 75th percentile and were analyzed using the Kruskal–Wallis test followed by the Steel–Dwass multiple comparisons. Mortality was analyzed by Chi‐square test. All other data were expressed as mean ± standard deviation, and were analyzed by one‐way analysis of variance (ANOVA) with the Tukey–Kramer post hoc tests. A P‐value of less than 0.05 was considered statistically significant.
Results
The Protective Effects of UTI
There was no significant difference in the SAH grade among the treatment groups (data not shown). The similar SAH grade indicates comparable injury among the treatment groups, which ensures that the differences in outcomes were the result of different treatments.
Firstly, the most effective dose of UTI was determined by evaluating the effects of three different doses of UTI on SAH‐induced injury. Rats were divided into 5 groups: sham (n = 5), SAH + vehicle (n = 6), SAH + UTI 20,000 U/kg (n = 7), SAH + UTI 50,000 U/kg (n = 8), and SAH + UTI 100,000 U/kg (n = 7). UTI 50,000 U/kg was the most effective in decreasing brain water content in the left and right hemispheres (P < 0.05, ANOVA, Figure 1A) and improving neurological deficits (P < 0.05, ANOVA, Figure 1B) at 24 h after SAH. Therefore, in the subsequent experiments, the effect of UTI 50,000 U/kg on maintaining the vascular integrity after SAH was evaluated.
Figure 1.
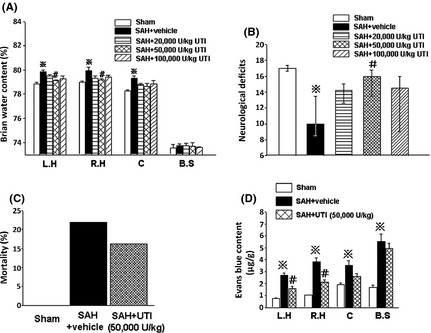
The dose‐dependent effects of urinary trypsin inhibitor (UTI). Compared with other two doses, the dose of 50,000 U/kg UTI was the most effective on decreasing brain water content in left and right hemispheres (A) and neurological deficits (B) at 24 h after subarachnoid hemorrhage (SAH). n = 5,6,7,8,7 in sham, SAH + vehicle, SAH + 20,000, 50,000 and 100,000 U/kg UTI groups. At 24 h after SAH, 50,000 U/kg UTI markedly attenuated Evans blue content in left and right hemispheres (D), n = 6,7,6 in sham, SAH + vehicle, SAH + 50,000 U/kg UTI groups, although it could not significantly reduce the mortality (C). ※ P < 0.05 compared with the sham group; # P < 0.05 compared with the SAH + vehicle group.L.H, left hemisphere; R.H, right hemisphere; C, cerebellum; B.S, brain stem.
Secondly, blood–brain barrier disruption was evaluated at 24 h postinjury. Vehicle‐treated SAH rats (n = 7) had significantly increased Evans blue dye extravasation in all brain regions compared with sham rats (n = 6; P < 0.05, ANOVA, Figure 1D). SAH rats treated with UTI 50,000 U/kg (n = 6) had significantly reduced Evans blue dye extravasation in bilateral hemispheres compared with the vehicle‐treated SAH rats (P < 0.05, ANOVA, Figure 1D). However, there was no significant difference in mortality rate between vehicle‐treated (21.95%) and UTI 50,000 U/kg treated (16.22%) SAH groups (P > 0.05, Chi‐square test, Figure 1C).
Next, MRI (T2WI) was applied to further detect the anti‐edema effect of 50,000 U/kg UTI after SAH. The three‐dimensional pilot scans were performed to allow for accurate orientation of subsequent scans. Routine T1WI sequence was also performed to exclude additional pathologies (Figure S2A–C). The dotted circles in Figure 2A enclose bilateral hippocampus, which is the ROI. There was no significant change of the volume in lateral ventricle after SAH (Figure S2D, P > 0.05).The signal intensity in bilateral hippocampus was markedly increased after SAH, which suggested the presence of vasogenic edema in the hippocampus following SAH (Figure 2C). SAH rats treated with UTI 50,000 U/kg had markedly decreased signal intensity in the hippocampus (Figure 2D). The average T2 values in the hippocampus was markedly increased in the vehicle‐treated SAH group compared with the sham rats, and treatment with UTI 50,000 U/kg reduced the T2 values in the hippocampus significantly (P < 0.05, ANOVA, Figure 2E).
Figure 2.
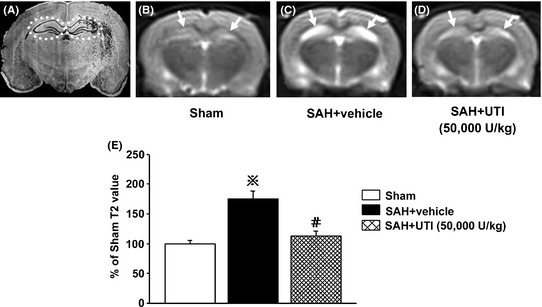
T2‐weighted images and analysis. (A) demonstrated the bilateral hippocampus (the dotted circles). The signal intensity and average T2 values of bilateral hippocampus were significantly increased in the subarachnoid hemorrhage (SAH) + vehicle group compared with those in the Sham group (B, C, E), which were decreased by 50,000 U/kg urinary trypsin inhibitor (UTI) treatment (D, E). In figure E, ※ P < 0.05 compared with the sham group; # P < 0.05 compared with the SAH + vehicle group.
In addition, brain water content and neurological deficits were also evaluated at 6 h post‐SAH to determine whether the effects of UTI 50,000 U/kg would be evident at an earlier time point. However, at 6 h following SAH, brain water content and neurological deficits were not significantly different between the vehicle group and the group treated with UTI 50,000 U/kg (P > 0.05, ANOVA, Figure 3A,B; n = 6 each group).
Figure 3.
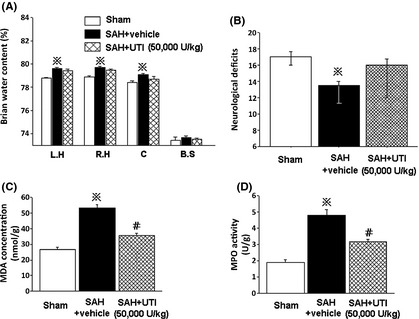
UTI preserved microvascular integrity partly through anti‐inflammation. At 6 hours following SAH, the 50,000 U/kg UTI treatment did not show protective effects (A and B). In addition, at 24 h after SAH, both MDA concentration and MPO activity in hippocampus were decreased by 50,000 U/kg UTI treatment (P < 0.05, ANOVA, C, D; n = 6 each group). ※ P < 0.05 compared with sham group; # P < 0.05 compared with SAH + vehicle group. MDA, malondialdehyde; MPO, myeloperoxidase; L.H, left hemisphere; R.H, right hemisphere; C, cerebellum; B.S, brain stem.
The Protective Mechanisms of UTI
At 24 h after SAH, both MDA concentration and MPO activity in the hippocampus were significantly increased in the vehicle‐treated SAH group compared with sham. Treatment with UTI 50,000 U/kg reduced both MDA concentration and MPO activity significantly (P < 0.05, ANOVA, Figure 3C,D, respectively, n = 6 each group).
To determine whether UTI‐mediated neuroprotection is dependent on reducing inflammation and apoptosis, we next performed Western blotting and immunohistochemical staining at 24 h post‐SAH. Immunohistochemical staining revealed increased levels of phosphorylated JNK, phosphorylated p53, caspase‐3, phosphorylated NF‐κB (p65), TNF‐α, and IL‐6 in the endothelial cells of hippocampus after SAH (Figure 4A2–F2) compared with sham (Figure 4A1–F1) and treatment with UTI 50,000 U/kg reduced the levels of all the markers (Figure 4A3–F3). In addition, quantitative analyses of the endothelial cells stained with these markers showed an increased number of positively stained endothelial cells in the vehicle‐treated SAH rats compared with sham, which was significantly reduced with UTI 50,000 U/kg treatment (P < 0.05, ANOVA, Figure S3, n = 6 each group).
Figure 4.
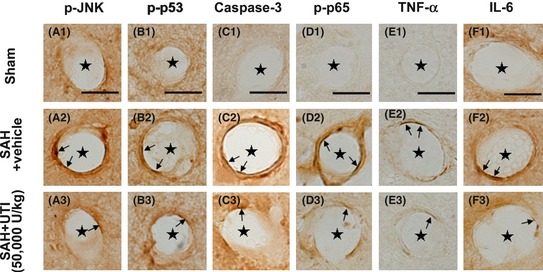
Immunohistochemical staining of the microvasculature in hippocampus. The levels of phosphorylated‐JNK, phosphorylated‐p53, caspase‐3, phosphorylated‐NF‐κB (p65), tumor necrosis factor‐α (TNF‐α), interleukin‐6 (IL‐6) in endothelial cells of microvasculature in hippocampus were markedly elevated, in addition, the numbers of endothelial cells with positive staining were also increased (A1–F1, A2–F2).These pathologies were significantly attenuated by 50,000 U/kg urinary trypsin inhibitor (UTI) treatment (A3–F3). Scale bars = 10 μm, “stars” indicated microvessels; “arrows” showed the endothelial cells, n = 6 each group.
Immunofluorescence staining revealed that the levels of phosphorylated p53 and NF‐κB (p65) were simultaneously elevated in the endothelial cells after SAH (Figure 5B1–B4), which were suppressed by UTI treatment (Figure 5C1–C4).
Figure 5.
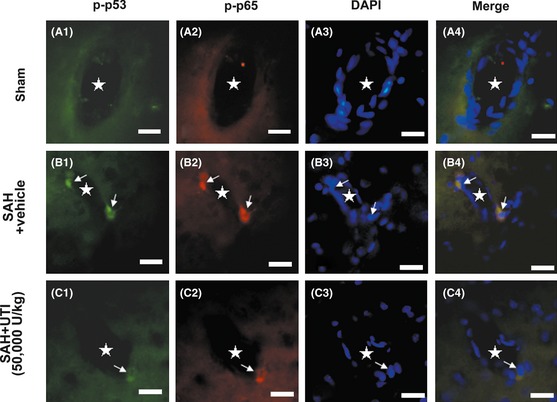
The immunofluorenscence staining of the microvasculature in hippocampus. In sham group, the phosphorylated‐p53 and NF‐κB (p65) were bare in the endothelial cells (A1–A4). After subarachnoid hemorrhage (SAH), p53 and NF‐κB (p65) in the endothelial cells were simultaneously activated and distributed in the nucleus (B1–B4). Urinary trypsin inhibitor (UTI) treatment could significantly suppress the levels of phosphorylated‐p53 and NF‐κB (p65) in the endothelial cells (C1–C4). Scale bars = 20 μm, “stars” indicated microvessels; “arrows” showed the endothelial cells, n = 6 each group.
Western blot analysis performed at 24 h after SAH showed a significant increase in phosphorylated NF‐κB (p65), phosphorylated p53, TNF‐α, and phosphorylated JNK in the hippocampus after SAH (n = 7) compared with sham (n = 6), which was markedly attenuated by UTI treatment (n = 7; P < 0.05, ANOVA, Figure 6A–D).
Figure 6.
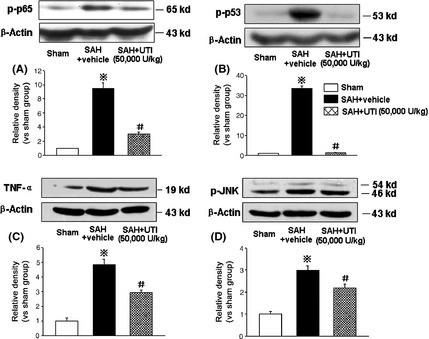
Western blot analysis. The western blot results revealed a significant increase of phosphorylated‐NF‐κB (p65), phosphorylated‐p53, tumor necrosis factor‐α (TNF‐α) and phosphorylated‐JNK in hippocampus at 24 h after subarachnoid hemorrhage (SAH), which was markedly attenuated by 50,000 U/kg urinary trypsin inhibitor (UTI) treatment (A–D). ※ P < 0.05 compared with the sham group; # P < 0.05 compared with the SAH + vehicle group. n = 6,7,7 in sham, SAH + vehicle, SAH + 50,000 U/kg UTI groups, respectively.
Discussion
In this study, we investigated whether UTI reduced brain edema and improved neurological deficits after SAH. Additionally, we evaluated whether UTI preserved microvascular integrity after SAH through its antiinflammatory and antiapoptotic effects via blocking the activity of JNK, NF‐κB, and p53.
We first evaluated the dose effect of UTI by assessing brain edema and neurobehavioral deficits, which are two important outcomes widely assessed after SAH 27, 28. Brain edema is a major pathology that leads to early brain injury (EBI) after SAH and is an independent risk factor for mortality and poor outcome after SAH 1. Consistent with earlier reports, our experiments showed that UTI 50,000 U/kg was most the effective dose 29, 30. UTI 50,000 U/kg alleviated brain edema and neurological deficits at 24 h after SAH and also significantly reduced microvascular permeability. However, the protective effect of UTI was not apparent at 6 h after SAH, which indicates that UTI requires a time window of at least more than 6 h to demonstrate beneficial effect after SAH. Interestingly, we also found that higher dose of UTI (100,000 U/kg) did not show protective effects after SAH which could likely be due to potential toxic effects of the drug.
Next, we observed that UTI 50,000 U/kg suppressed MPO activity at 24 h post‐SAH. Blood neutrophil count has been shown significantly increased after SAH and is associated with poor clinical outcome in patients after SAH 31. The activity of MPO, an enzyme released mostly by the neutrophils, is widely used as a biomarker for neutrophil infiltration and inflammatory response. The proteases secreted by activated neutrophils during the acute inflammatory phase can degrade the extracellular matrix, thus leading to tissue destruction 32. Furthermore, our results showed that UTI 50,000 U/kg reduced cerebral MDA concentration at 24 h post‐SAH. MDA is a frequently used marker of lipid peroxidation, and an increased MDA level demonstrates the loss of cellular membrane stability after SAH.
Given these results, we next explored whether the potential antiinflammatory and antiapoptotic effects of UTI were involved in decreased JNK activation in the microvascular endothelial cells after SAH. JNK is a member of the MAPK family that regulates various biological processes implicated in tumorigenesis and neurodegenerative disorders 33. Phosphorylated JNK (p‐JNK) can activate its downstream target NF‐κB (p65) 34, which can enhance the production of proinflammatory factors such as TNF‐α and IL‐6. Accumulating evidence support the notion that elevated NF‐κB activity contributes to ischemia induced neurological injury 35, 36. Additionally, p‐JNK can also activate p53 and trigger the apoptotic cascade by the formation of proapoptotic caspase‐3 37. Our results showed that inflammation related to p‐JNK, p‐NF‐κB (p65), TNF‐α, and IL‐6 was significantly increased in the microvascular endothelial cells in the hippocampus after SAH. The expression of p‐p53 and caspase‐3 was also significantly increased in the endothelial cells after SAH. Additionally, our immunofluorescence results showed that p53 and NF‐κB (p65) were simultaneously activated in endothelial cells following SAH. Treatment with UTI significantly decreased the levels of p‐JNK and the expression of proinflammatory p‐NF‐κB (p65), TNF‐α, IL‐6, and the proapoptotic protein p‐p53 and caspase‐3 was also significantly reduced with the UTI treatment.
In conclusion, we demonstrated for the first time that UTI improved neurological function, reduced brain edema and microvascular permeability through its antiinflammation and antiapoptosis effects via blocking the activity of JNK, NF‐κB, and p53 after experimental SAH in rats. However, our study has weaknesses as it did not explore the long‐term outcomes after UTI treatment. Additional studies will be needed to strengthen the observations of beneficial outcomes shown in this study.
Conflict of Interest
The authors declare no conflict of interest.
Supporting information
Figure S1. Experiment designs. (A) Experiment 1 was designed to evaluate the dose‐dependent effect of UTI. (B) Experiment 2 was designed to explore the effects and mechanism of UTI treatment. IP, intraperitoneally injection; MRI, magnetic resonance imaging; T2WI, T2‐weighted imaging; MDA, malondialdehyde; MPO: myeloperoxidase; IF: immunofluorescence staining; IHC, immunohistochemical staining; WB, western blot..
Figure S2. T1 weighted magnetic resonance imaging (MRI) images and the volume of lateral ventricle each group.
Figure S3. The number of endothelial cells with positive staining per section each group.
Acknowledgment
This study was partly supported by the Techpool Research Fund (No. 01201002).
References
- 1. Claassen J, Carhuapoma JR, Kreiter KT, Du EY, Connolly ES, Mayer SA. Global cerebral edema after subarachnoid hemorrhage: Frequency, predictors, and impact on outcome. Stroke 2002;33:1225–1232. [DOI] [PubMed] [Google Scholar]
- 2. Yan J, Li L, Khatibi NH, et al. Blood‐brain barrier disruption following subarchnoid hemorrhage may be facilitated through PUMA induction of endothelial cell apoptosis from the endoplasmic reticulum. Exp Neurol 2011;230:240–247. [DOI] [PubMed] [Google Scholar]
- 3. Altay O, Suzuki H, Hasegawa Y, et al. Isoflurane attenuates blood‐brain barrier disruption in ipsilateral hemisphere after subarachnoid hemorrhage in mice. Stroke 2012;43:2513–2516. [DOI] [PMC free article] [PubMed] [Google Scholar]
- 4. Sercombe R, Dinh YR, Gomis P. Cerebrovascular inflammation following subarachnoid hemorrhage. Jpn J Pharmacol 2002;88:227–249. [DOI] [PubMed] [Google Scholar]
- 5. Park S, Yamaguchi M, Zhou C, Calvert JW, Tang J, Zhang JH. Neurovascular protection reduces early brain injury after subarachnoid hemorrhage. Stroke 2004;35:2412–2417. [DOI] [PubMed] [Google Scholar]
- 6. Yan J, Chen C, Hu Q, et al. The role of p53 in brain edema after 24 h of experimental subarachnoid hemorrhage in a rat model. Exp Neurol 2008;214:37–46. [DOI] [PubMed] [Google Scholar]
- 7. Simard JM, Geng Z, Woo SK, et al. Glibenclamide reduces inflammation, vasogenic edema, and caspase‐3 activation after subarachnoid hemorrhage. J Cereb Blood Flow Metab 2009;29:317–330. [DOI] [PMC free article] [PubMed] [Google Scholar]
- 8. Yamaguchi Y, Ohshiro H, Nagao Y, et al. Urinary trypsin inhibitor reduces C‐X‐C chemokine production in rat liver ischemia/reperfusion. J Surg Res 2000;94:107–115. [DOI] [PubMed] [Google Scholar]
- 9. Zhou C, Yamaguchi M, Kusaka G, Schonholz C, Nanda A, Zhang JH. Caspase inhibitors prevent endothelial apoptosis and cerebral vasospasm in dog model of experimental subarachnoid hemorrhage. J Cereb Blood Flow Metab 2004;24:419–431. [DOI] [PubMed] [Google Scholar]
- 10. Özsavcí D, Erşahin M, Şener A, et al. The novel function of nesfatin‐1 as an anti‐inflammatory and antiapoptotic peptide in subarachnoid hemorrhage‐induced oxidative brain damage in rats. Neurosurgery 2011;68:1699–1708. [DOI] [PubMed] [Google Scholar]
- 11. Liu X, Sun J. Endothelial cells dysfunction induced by silica nanoparticles through oxidative stress via JNK/P53 and NF‐kappaB pathways. Biomaterials 2010;31:8198–8209. [DOI] [PubMed] [Google Scholar]
- 12. Zhang Y, Fong CC, Wong MS, et al. Molecular mechanisms of survival and apoptosis in RAW 264.7 macrophages under oxidative stress. Apoptosis 2005;10:545–556. [DOI] [PubMed] [Google Scholar]
- 13. Friedrich V, Flores R, Muller A, Bi W, Peerschke EI, Sehba FA. Reduction of neutrophil activity decreases early microvascular injury after subarachnoid haemorrhage. J Neuroinflammation 2011;8:103. [DOI] [PMC free article] [PubMed] [Google Scholar]
- 14. Kobayashi H, Gotoh J, Fujie M, Terao T. Characterization of the cellular binding site for the urinary trypsin inhibitor. J Biol Chem 1994;269:20642–20647. [PubMed] [Google Scholar]
- 15. Endo S, Inada K, Yamashita H, et al. The inhibitory actions of protease inhibitors on the production of polymorphonuclear leukocyte elastase and interleukin 8. Res Commun Chem Pathol Pharmacol 1993;82:27–34. [PubMed] [Google Scholar]
- 16. Nakatani K, Takeshita S, Tsujimoto H, Kawamura Y, Sekine I. Inhibitory effect of serine protease inhibitors on neutrophil‐mediated endothelial cell injury. J Leukoc Biol 2001;69:241–247. [PubMed] [Google Scholar]
- 17. Li XK, Suzuki H, Kimura T, Kawabe A, Uno T, Harada Y. Ulinastatin, a protease inhibitor, attenuates intestinal ischemia/reperfusion injury. Transplant Proc 1994;26:2423–2425. [PubMed] [Google Scholar]
- 18. Nakahama H, Obata K, Sugita M. Ulinastatin ameliorates acute ischemic renal injury in rats. Ren Fail 1996;18:893–898. [DOI] [PubMed] [Google Scholar]
- 19. Aihara T, Shiraishi M, Hiroyasu S, et al. Ulinastatin, a protease inhibitor, attenuates hepatic ischemia/reperfusion injury by downregulating TNF‐alpha in the liver. Transplant Proc 1998;30:3732–3734. [DOI] [PubMed] [Google Scholar]
- 20. Duris K, Manaenko A, Suzuki H, Rolland W, Tang J, Zhang JH. Sampling of CSF via the cisterna magna and blood collection via the heart affects brain water content in a rat SAH model. Transl Stroke Res 2011;2:232–237. [DOI] [PMC free article] [PubMed] [Google Scholar]
- 21. Sugawara T, Ayer R, Jadhav V, Zhang JH. A new grading system evaluating bleeding scale in filament perforation subarachnoid hemorrhage rat model. J Neurosci Methods 2008;167:327–334. [DOI] [PMC free article] [PubMed] [Google Scholar]
- 22. Garcia JH, Wagner S, Liu KF, Hu XJ. Neurological deficit and extent of neuronal necrosis attributable to middle cerebral artery occlusion in rats. Statistical validation. Stroke 1995;26:627–634. [DOI] [PubMed] [Google Scholar]
- 23. Han H, Xia Z, Chen H, Hou C, Li W. Simple diffusion delivery via brain interstitial route for the treatment of cerebral ischemia. Sci China Life Sci 2011;54:235–239. [DOI] [PubMed] [Google Scholar]
- 24. Paxinos G, Watson C. The rat brain in stereotaxic coordinates. London: Academic Press, 1986. [DOI] [PubMed] [Google Scholar]
- 25. Ma Q, Manaenko A, Khatibi NH, Chen W, Zhang JH, Tang J. Vascular adhesion protein‐1 inhibition provides antiinflammatory protection after an intracerebral hemorrhagic stroke in mice. J Cereb Blood Flow Metab 2011;31:881–893. [DOI] [PMC free article] [PubMed] [Google Scholar]
- 26. Ma Q, Huang B, Khatibi N, et al. PDGFR‐α inhibition preserves blood‐brain barrier after intracerebral hemorrhage. Ann Neurol 2011;70:920–931. [DOI] [PMC free article] [PubMed] [Google Scholar]
- 27. Sherchan P, Lekic T, Hidenori S, et al. Minocycline improves functional outcomes, memory deficits and histopathology after endovascular perforation‐induced subarachnoid hemorrhage in rats. J Neurotrauma 2011;28:2503–2512. [DOI] [PMC free article] [PubMed] [Google Scholar]
- 28. Yan JH, Khatibi NH, Han HB, et al. p53‐induced uncoupling expression of aquaporin‐4 and inwardly rectifying K+ 4.1 channels in cytotoxic edema after subarachnoid hemorrhage. CNS Neurosci Ther 2012;18:334–342. [DOI] [PMC free article] [PubMed] [Google Scholar]
- 29. Yu JR, Yan S, Liu XS, et al. Attenuation of graft ischemia‐reperfusion injury by urinary trypsin inhibitor in mouse intestinal transplantation. World J Gastroenterol 2005;11:1605–1609. [DOI] [PMC free article] [PubMed] [Google Scholar]
- 30. Shin IW, Jang IS, Lee SM, et al. Myocardial protective effect by ulinastatin via an anti‐inflammatory response after regional ischemia/reperfusion injury in an in vivo rat heart model. Korean J Anesthesiol 2011;61:499–505. [DOI] [PMC free article] [PubMed] [Google Scholar]
- 31. Chou SH, Feske SK, Simmons SL, et al. Elevated peripheral neutrophils and matrix metalloproteinase 9 as biomarkers of functional outcome following subarachnoid hemorrhage. Transl Stroke Res 2011;2:600–607. [DOI] [PMC free article] [PubMed] [Google Scholar]
- 32. Owen CA, Campbell EJ. The cell biology of leukocyte‐mediated proteolysis. J Leukoc Biol 1999;65:137–150. [DOI] [PubMed] [Google Scholar]
- 33. Davies C, Tournier C. Exploring the function of the JNK (c‐Jun N‐terminal kinase) signaling pathway in physiological and pathological processes to design novel therapeutic strategies. Biochem Soc Trans 2012;40:85–89. [DOI] [PubMed] [Google Scholar]
- 34. Wang L, Li JY, Zhang XZ, et al. Involvement of p38MAPK/NF‐κB signaling pathways in osteoblasts differentiation in response to mechanical stretch. Ann Biomed Eng 2012;40:1884–1894. [DOI] [PubMed] [Google Scholar]
- 35. Sironi L, Banfi C, Brioschi M, et al. Activation of NF‐κB and ERK1/2 after permanent focal ischemia is abolished by simvastatin treatment. Neurobiol Dis 2006;22:445–451. [DOI] [PubMed] [Google Scholar]
- 36. Zhang HL, Gu ZL, Savitz SI, Han F, Fukunaga K, Qin ZH. Neuroprotective effects of prostaglandinA (1) in rat models of permanent focal cerebral ischemia are associated with nuclear factor‐kappaB inhibition and peroxisome proliferator‐activated receptor‐gamma up‐regulation. J Neurosci Res 2008;86:1132–1141. [DOI] [PubMed] [Google Scholar]
- 37. Kim MS, Kwon JY, Kang NJ, Lee KW, Lee HJ. Phloretin induces apoptosis in H‐Ras MCF10A human breast tumor cells through the activation of p53 via JNK and p38 mitogen‐activated protein kinase signaling. Ann N Y Acad Sci 2009;1171:479–483. [DOI] [PubMed] [Google Scholar]
Associated Data
This section collects any data citations, data availability statements, or supplementary materials included in this article.
Supplementary Materials
Figure S1. Experiment designs. (A) Experiment 1 was designed to evaluate the dose‐dependent effect of UTI. (B) Experiment 2 was designed to explore the effects and mechanism of UTI treatment. IP, intraperitoneally injection; MRI, magnetic resonance imaging; T2WI, T2‐weighted imaging; MDA, malondialdehyde; MPO: myeloperoxidase; IF: immunofluorescence staining; IHC, immunohistochemical staining; WB, western blot..
Figure S2. T1 weighted magnetic resonance imaging (MRI) images and the volume of lateral ventricle each group.
Figure S3. The number of endothelial cells with positive staining per section each group.


