

SUMMARY
Aims: We conducted systematic review as well as meta‐analyses on the association between particulate matter and daily stroke attack from a number of epidemiologic studies. Methods: Twelve quantitative studies about the associations between particulate matter and stroke attack met the inclusive criteria. We evaluated the odds ratio (OR) of stroke attack associated with per 10 μg/m3 increase of the concentration of PM10 (particulate matter with aerodynamic diameter ≤ 10 μm) or PM2.5 (particulate matter with aerodynamic diameter ≤ 2.5 μm) as effect scale, and a sensitivity analysis for the results was conducted. Results: In the time‐series design, PM10 exposure wasn't related to an increased risk of daily stroke attack [OR per 10 μg/m3 = 1.002, 95% confidence interval (CI): 0.999∼1.005], PM2.5 exposure were related to an increased risk of daily stroke attack (OR per 10 μg/m3 = 1.006, 95%CI: 1.002∼1.010]; but in the case‐crossover studies, PM10 exposure was related to increase in risk of daily stroke attack (OR per 10 μg/m3= 1.028, 95%CI: 1.001∼1.057). PM2.5 exposure was not significant association with daily stroke attack (OR per 10 μg/m3= 1.016, 95%CI: 0.937∼1.097). Sensitivity analysis showed that the results for PM10, PM2.5 and daily stroke attack were robust in the time‐series design. Conclusions: We found some evidence for an effect of air pollutants on stroke attack risk.
Keywords: Hospital admission, Meta‐analysis, Particulate matter, Stroke introduction
Introduction
Particulate matter (PM) also called particle pollution is the term for a mixture of solid particles and liquid droplets found in the air. Some particles are large or dark enough to be seen as soot or smoke. Others are so small, which are detected only with an electron microscope. In 1987, US Environmental Protection Agency (EPA) proposed a PM10 standard. The standard focuses on smaller particles that are likely responsible for adverse health effects because of their ability to reach the lower regions of the respiratory tract. PM10 includes particles with an average aerodynamic diameter of less than or equal to 10 μm. Ten years later, EPA revised the PM standards, setting separate standards for fine particles based on their link to serious health problems. Fine particles, also known as “PM2.5”, including particulate matter with an average aerodynamic diameter of less than or equal to 2.5 μm.
The previous studies have focused on the association between particular matter and respiratory diseases. Major concerns for human health from exposure to particulate matter include: effects on breathing and respiratory systems, damage to lung tissue, cancer, and premature death. The elderly, children, and people with chronic lung disease, influenza, or asthma, are especially sensitive to the effects of particulate matter [1].
The relationship between particular matter and the cardiovascular diseases has aroused public attention only recently. The finding that air pollution was positively associated with death from cardiovascular diseases was firstly proposed in a prospective cohort study conducted by Dockery etc. [2]. Since then studies on the relationship between particular matter and cardiovascular diseases were carried out internationally. For example, it is suggested that certain subgroups of the population such as the elderly or those with pre‐existing cardiorespiratory disease may be more susceptible to the effect of air pollution, and analysis of survival data from cohort studies supports this observation [3]. The cardiovascular disease is a broad concept which includes a series of disease. In this study, the stroke attack was selected as outcome.
The relationship between particular matter and stroke has not been determined conclusively, due to results varied with in different studies. Oudin et al. found that PM10 was associated with stroke admission [4]. A case‐crossover study in the urban area of Como, Italy found that air pollution was positively correlates with daily stroke admission [5]. PM10 was significantly associated with stroke admission (P‐value < 0.05) with estimated RR of 1.078 (95% CI: 1.052∼1.104) for hospital admission at 2‐ and 4‐day lags. While in the case‐crossover study conducted by Wellenius et al. no significant association was observed between PM10 and hemorrhagic stroke attack [6]. A time‐series study conducted by Le Tertre et al. found the pooled percentage increases associated with a 10 μg/m3 increase in PM10 was 0.8% (95% CI: 0.3%∼1.2%) for ischaemic heart disease over 65 years [7].
Aims
To meta‐analyze the association between particulate matter and daily stroke attack in time‐series studies and case‐crossover studies, respectively.
Methods
Selection of Studies
We identified relevant publications by systematic searches in seven literature databases (EMBASE, Family and Society Studies World Wide, LILACS, MEDLINE, Sociological Abstracts, TOXNET, Web of Science), five grey literature databases (British Library, PaperFirst, ProceedingsFirst, ProQuest Dissertations and Theses, WHOLIS), and Clinical trials database from January 2002 to December 2010. Search terms from the first criterion are: “Cardiovascular disease/Stroke”, “Stroke/epidemiology”, “Stroke/etiology”. Search terms from the second criterion include “Air Pollution”, “Particulate Matter/adverse effects”. Search terms from the third criterion are “hospitalization”, admission”, “occurrence”. All terms under broad categories of geographical locations such as “Africa”, “Americas”, “Asia”, and “Oceanic islands” were included. The three search results were combined with Boolean search function “and”. A similar literature search process was repeated in the different databases. We choose ICD9:430∼438 or ICD10: I60∼I69 as the definition of “stroke”. “Hospital admission” and “stroke attack” were used as keywords to indirectly define “daily stroke attack”.
Duplications were removed from the total number of studies found from multiple database searches. The remaining articles were reviewed according to exclusion criteria based on title and abstract. Publications of reviews were excluded. Articles with exposure due to asbestos and other industrial and occupational air pollution were excluded. The remaining original articles were selected for reviewing the full text. Articles that were not original studies or did not provide calculable or reported ORs and 95% CIs were also excluded from the meta‐analysis. Studies with similar effect measures (e.g., risk ratios, 95% CIs) were included and used to approximate ORs.
Each study that met the study inclusion criteria was appraised using a piloted data extraction form. Information on study characteristics (author, publication year, and study design), size of sample, population characteristics (age, gender, and country), statistical techniques, confounding factors, and results were extracted. Articles that did not report ORs but provided sufficient data for OR calculations were included.
Statistical Analysis
Pooled ORs of PM with 95% confidence intervals (CI) for stroke attack were computed by using the fixed or random effects meta‐analysis of with Q and I2 statistics given as the chosen measure of heterogeneity (The null hypothesis of this test is absence of heterogeneity). The Q and I2 statistics were used to assess heterogeneity, where P≤ 0.05 or I2 > 50% were considered as significant heterogeneity. We presented either fixed or random effects pooled estimates, but used preferentially the latter when heterogeneity was detected. We also produced forest plots to show ORs from each of the individual studies included in the meta‐analyses and the estimation of the pooled OR. The sizes of the markers of each OR in the plots represent the relative weight each study contributed to the pooled estimation. We assessed publication bias visually through funnel plots, Begger test, and a weighted Egger test, a linear regression in which the response is the estimated effect and the explanatory variable is a precision term (1/SE). A large deviation from zero of the slope term suggests publication bias. We also performed sensitivity analyses, whereby each study was omitted in turn, recalculating the pooled estimates under extreme conditions. All analyses were performed using software STATA version 10.0 (StataCorp LP, College Station, TX, USA).
Results
Search Results and Study Selection
With the computerized search and after extensive cross‐check, 16 relevant articles were extracted and reviewed by two independent reviewers. Out of 16 articles, 12 were eligible for inclusion in this analysis and data were extracted from these studies [4, 6, 7, 8, 9, 10, 11, 12, 13, 14, 15, 16], published in the year between 2002 and 2010, involving 13 countries. Three studies were conducted in the United States, three in Taiwan, four in Europe (in Barcelona, Birmingham, London, Milan, the Netherlands, Paris, Rome, Stockholm, Como, Dijon, and Copenhagen), one in Korea and one in Canada. Ten articles were about PM10 and 5 articles were about PM2.5, The study methods used in the included studies were time‐series design (8 studies) and case‐crossover design (7 studies). The total number of case in our research sample was 11,850,884. If there were different results due to different time, temperature or regions, we choose the summary effect after confounding factors were adjusted or the maximum value. The details of individual studies are given in Table 1.
Table 1.
The basic overview of the 12 included articles
| First author (year of publication) | Particulate matter | Number of subjects | Country (area) | Subjects | OR (95%CI) | Study design | Adjustment factors |
|---|---|---|---|---|---|---|---|
| Wellenius (2005) [6] | PM10 | 155,503 | 9 cities in America | ≥65y | 1.004 (1.000∼1.009) | Case‐crossover | Month‐of‐year, day‐of‐week effects, and meteorological covariates |
| Le Tertre (2002) [7] | PM10 | 98,327 | 8 countries in Europe | ≥65y | 1.000 (0.997∼1.003) | Time‐series | Long‐term trends, season, influenza epidemics, and meteorology |
| Lee (2003) [8] | PM10 | 10,193 | Korea | ≥64y | 1.012 (1.002∼1.024) | Time‐series | Long‐term trends in air pollution levels and weather variables |
| Tsai (2003) [9] | PM10 | 23,179 | Kaohsiung, Taiwan, China | The whole population | 1.059 (1.043∼1.074) | Case‐crossover | Day of the week, seasonality, and long‐term trends |
| Chan (2006) [10] | PM2.5 | 2,184 | Taipei, Taiwan, China | ≥50y | 0.995 (0.984∼1.007) | Time‐series | Meteorological conditions and temporal trends |
| Chan (2006) [10] | PM10 | 2,184 | Taipei, Taiwan, China | ≥50y | 1.004 (0.995∼1.012) | Time‐series | Meteorological conditions and temporal trends |
| Dominici (2006) [11] | PM2.5 | 11,500,000 | America | ≥65y | 1.008 (1.003∼1.013) | Time‐series | Time, temperature, weather, and seasonality |
| Villeneuve (2006) [12] | PM2.5 | 12,422 | Edmonton, Canada | ≥65y | 1.016 (0.937∼1.097) | Case‐crossover | Time trends in both air pollution exposures and outcomes and seasonality |
| Villeneuve (2006) [12] | PM10 | 12,422 | Edmonton, Canada | ≥65y | 1.000 (0.975∼1.031) | Case‐crossover | Time trends in both air pollution exposures and outcomes and seasonality |
| Bell (2007) [13] | PM2.5 | 11,466 | Taipei, Taiwan, China | The whole population | 1.006 (0.993∼1.020) | Time‐series | Temporal and long‐term trends, weather and season |
| Bell (2007) [13] | PM10 | 11,466 | Taipei, Taiwan, China | The whole population | 1.009 (1.001∼1.018) | Time‐series | Temporal and long‐term trends, weather and season |
| Henrotin (2007) [14] | PM10 | 1,487 | Dijon, France | The whole population | 1.008 (0.999∼1.066) | Case‐crossover | Relative humidity, temperature, influenza, epidemics, and holidays |
| Lisabeth (2008) [15] | PM2.5 | 3,508 | America | The whole population | 1.060 (0.980∼1.140) | Time‐series | Temperature, day of week, and temporal trends |
| Andersen (2010) [16] | PM10 | 5,784 | Copenhagen, Denmark | The whole population | 1.022 (0.993∼1.044) | Case‐crossover | Time trends in both exposures and outcomes and meteorological conditions |
| Vidale (2010) [5] | PM10 | 759 | Como, Italy | The whole population | 1.078 (1.052∼1.104) | Case‐crossover | Time trends and meteorological conditions |
Results of Meta‐Analysis in Different Design Methods
Effect of PM10 to the Daily Stroke Attack in Time‐Series Studies
We conducted meta‐analyses for four combinative effects of PM10 and daily stroke attack in time‐series studies (see Table 2). Heterogeneity tests showed evidence for homogeneity among studies (Q= 7.75, P= 0.051), so fixed effect model to calculate a pooled OR with 95%CI. In the time‐series design that was used, PM10 exposure wasn't related to an increased risk of daily stroke attack (OR per 10 μg/m3 = 1.002, 95%CI: 0.999∼1.005). Forest plot was shown in Figure 1(A). Funnel plot was shown in Figure 2(A), Begger's test and Egger's test showed that publication bias was unlikely in the meta‐analysis on association between PM10 and daily stroke attack in time‐series studies (zc= 1.02, P= 0.308; t= 4.13, P= 0.054). Sensitivity analyses showed that results for PM10 and daily stroke attack in time‐series design was not robust to the inclusion of the Le Tertre study, the study introduced significant heterogeneity(see Table 3).
Table 2.
The association between PM10 or PM2.5 and stroke daily attack in different design methods
| Design | First author (published time) | Number of subjects | Country (Area) | Subjects | OR (95%CI) | Combing effect size |
|---|---|---|---|---|---|---|
| Time‐series model The effect of PM10 to stroke attack | Le Tertre (2002) [7] | 98,327 | 8 countries in Europe | ≥65y | 1.000 (0.997∼1.003) | Q= 7.75, P= 0.051, OR = 1.002 (95%CI: 0.999∼1.005) |
| Lee (2003) [8] | 10,193 | Korea | ≥64y | 1.012 (1.002∼1.024) | ||
| Chan (2006) [10] | 2,184 | Taipei, Taiwan, China | ≥50y | 1.004 (0.995∼1.012) | ||
| Bell (2007) [13] | 11,466 | Taipei, Taiwan, China | The whole population | 1.009 (1.001∼1.018) | ||
| Case‐crossover model The effect of PM10 to stroke attack | Tsai (2003) [9] | 23,179 | Kaohsiung, Taiwan, China | The whole population | 1.059 (1.043∼1.074) | Q= 76.28, P= 0.000, OR = 1.028 (95%CI: 1.001∼1.057) |
| Wellenius (2005) [6] | 155,503 | 9 cities in America | ≥65y | 1.004 (1.000∼1.009) | ||
| Villeneuve (2006) [12] | 12,422 | Edmonton, Canada | ≥65y | 1.000 (0.975∼1.031) | ||
| Henrotin (2007) [14] | 1,487 | Dijon, France | The whole population | 1.008 (0.999∼1.066) | ||
| Andersen (2010) [16] | 5,784 | Copenhagen, Denmark | The whole population | 1.022 (0.993∼1.044) | ||
| Vidale (2010) [5] | 759 | Como, Italy | The whole population | 1.078 (1.052∼1.104) | ||
| Time‐series model The effect of PM2.5 to stroke attack | Chan (2006) [10] | 2,184 | Taipei, Taiwan, China | ≥50y | 0.995 (0.984∼1.007) | Q= 5.93, P= 0.115, OR = 1.006 (95%CI: 1.002∼1.010) |
| Dominici (2006) [11] | 11,500,000 | America | ≥65y | 1.008 (1.003∼1.013) | ||
| Bell (2007) [13] | 11,466 | Taipei, Taiwan, China | The whole population | 1.006 (0.993∼1.020) | ||
| Lisabeth (2008) [15] | 3,508 | America | The whole population | 1.060 (0.980∼1.140) | ||
| Case‐crossover model The effect of PM2.5 to stroke attack | Villeneuve (2006) [12] | 12,422 | Edmonton, Canada | ≥65y | 1.016 (0.937∼1.097) |
Figure 1.
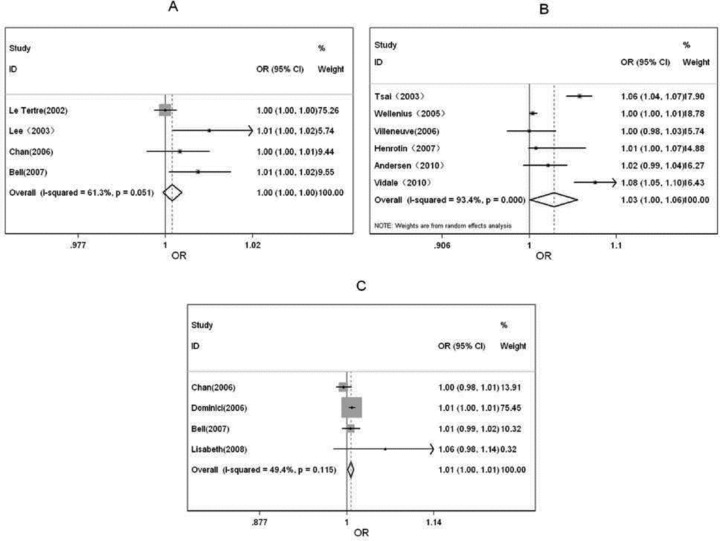
Forest plots of meta‐analysis in different design methods. (A) The effect of PM10 to stroke daily attack in the time‐series model. (B) The effect of PM10 to stroke daily attack in the case‐crossover model. (C) The effect of PM2.5 to stroke daily attack in the time‐series model.
Figure 2.
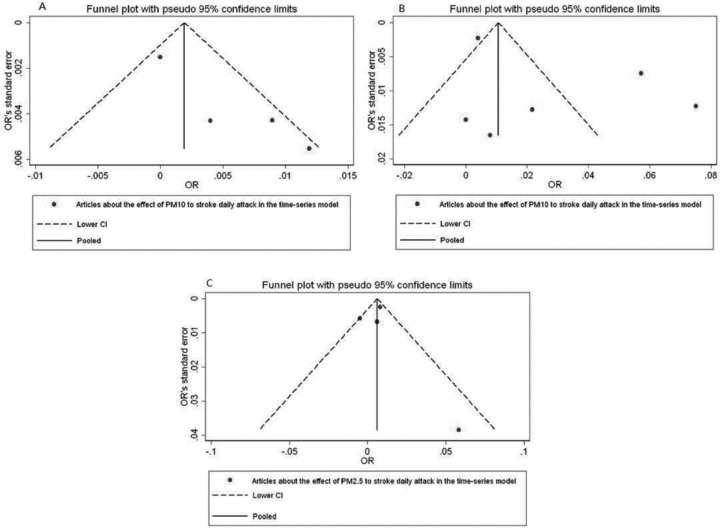
Funnel plots of meta‐analysis in different design methods.
Table 3.
Sensitivity analysis of meta‐analysis in different design methods
| Design | First Author (published time) | Number of subjects | Model | OR(95%CI) | Q | P |
|---|---|---|---|---|---|---|
| Time‐series model | Total | 122,170 | Fixed effect model | 1.002 (0.999∼1.005) | 7.75 | 0.051 |
| The effect of PM10 to stroke attack | Delete Le Tertre (2002) [7] | 23,843 | Fixed effect model | 1.008 (1.003∼1.013) | 1.40 | 0.496 |
| Delete Lee (2003) [8] | 111,977 | Fixed effect model | 1.001 (0.999∼1.004) | 4.29 | 0.117 | |
| Delete Chan (2006) [10] | 119,986 | Random effect model | 1.006 (0.998∼1.014) | 7.50 | 0.024 | |
| Delete Bell (2007) [13] | 110,704 | Fixed effect model | 1.001 (0.998∼1.004) | 4.78 | 0.092 | |
| Case‐crossover model | Total | 199,134 | Random effect model | 1.028 (1.001∼1.057) | 76.28 | 0.000 |
| The effect of PM10 to stroke attack | Delete Tsai (2003) [9] | 175,955 | Random effect model | 1.022 (0.995∼1.049) | 33.91 | 0.000 |
| Delete Wellenius (2005) [6] | 43,631 | Random effect model | 1.034 (1.006∼1.063) | 26.83 | 0.000 | |
| Delete Villeneuve (2006) [12] | 186,712 | Random effect model | 1.034 (1.002∼1.067) | 75.71 | 0.000 | |
| Delete Henrotin (2007) [14] | 197,647 | Random effect model | 1.032 (1.001∼1.065) | 76.25 | 0.000 | |
| Delete Andersen (2010) [16] | 193,350 | Random effect model | 1.030 (0.997∼1.063) | 75.49 | 0.000 | |
| Delete Vidale (2010) [5] | 198,375 | Random effect model | 1.019 (0.993∼1.046) | 48.01 | 0.000 | |
| Time‐series model | Total | 11,517,158 | Fixed effect model | 1.006 (1.002∼1.010) | 5.93 | 0.115 |
| The effect of PM2.5 to stroke attack | Delete Chan (2006) [10] | 11,514,974 | Fixed effect model | 1.008 (1.003∼1.013) | 1.78 | 0.410 |
| Delete Dominici (2006) [11] | 17,158 | Fixed effect model | 1.000 (0.992∼1.009) | 3.76 | 0.153 | |
| Delete Bell (2007) [13] | 11,505,692 | Fixed effect model | 1.006 (1.002∼1.010) | 5.93 | 0.052 | |
| Delete Lisabeth (2008) [15] | 11,513,650 | Fixed effect model | 1.006 (1.002∼1.010) | 4.10 | 0.129 |
Effect of PM10 to the Daily Stroke Attack in Case‐Crossover Studies
Six studies were included (see Table 2). Heterogeneity tests showed evidence for heterogeneity among studies (Q= 76.28, P= 0.000). With random effect model, we found statistically significantly increased pooled risk estimates for PM10 exposure and risk of daily stroke attack (OR per 10 μg/m3 = 1.028, 95% CI: 1.001∼1.057) in case‐crossover studies.
Then, we computed β by using β= ln (OR), its value is 2.76% (95%CI: 0.10%∼5.54%), which indicates 2.76% (95%CI: 0.10%∼5.54%) will increase in daily stroke attack with every 10 μg/m3 increase in PM10. Forest plots was shown in Figure 1(B). Funnel plots was shown in Figure 2(B). Begger's test and Egger's test supported that publication bias was unlikely (zc= 0.38, P= 0.707; t= 1.45, P= 0.220). Sensitivity analyses showed that results for PM10 and daily stroke attack in case‐crossover studies were not robust to the inclusion of Tsai study, Andersen study and Vidale study, which introduced significant heterogeneity (see Table 3).
Effect of PM2.5 to the Daily Stroke Attack in Time‐Series Studies
There were 4 studies included on effect of PM2.5 to the daily stroke attack in time‐series studies (see Table 2). Homogeneity was observed among four studies (Q= 5.93, P= 0.115). With fixed effect model, PM2.5 exposure was statistically associated with an increased risk of daily stroke attack in time‐series studies (OR per 10 μg/m3 = 1.006; 95% CI, 1.002∼1.010) (β= 0.60%; 95%CI, 0.20%∼1.00%). Forest plot was shown in Figure 1(C). Funnel plots was shown in Figure 2(C). Begger's test and Egger's test showed evidence for none publication bias in the meta‐analysis (zc= ‐0.34, P= 1.000; t= 0.09, P= 0.940). Sensitivity analyses showed that results for PM2.5 and daily stroke attack in time‐series studies were not robust to the inclusion of Dominici study, which introduced significant heterogeneity(see Table 3).
Discussion
The Comparison of Different Design Methods
There have been some studies about the association between air pollution and cerebrovascular disease at home and abroad, but the study methods they used in their studies were not totally the same. Autoregressive Poisson models was used in Le Tertre study [7]. The time‐stratified case‐crossover design was used in Wellenius study [6]. Based on the studies retrieved, most of the studies were focused on two main design types: the time‐series study and the case‐crossover study, although there may existed subtypes. So in order to exclude the influence of different study methods, the research carried out meta‐analyses of association between particulate matter and daily stroke attack in time‐series studies and case‐crossover studies, respectively.
There were 4 research reports dedicating the relationships between PM10 and daily stroke attack in the time‐series model, two of which showed statistically significance, while the rests had no statistically significance. The combined estimate for meta‐analyses of the four studies is not significant; in the case‐crossover studies, 6 studies that involved the association between PM10 and daily stroke attack met our inclusion criterion, half of which had statistically significance. The pooled result of meta‐analyses of the six studies was of significance. Four studies on the association between PM2.5 and daily stroke attack in time‐series design were included, meta‐analysis showed a positive statistically significant result, which is not consistent with the sole study by Villeneuve et al. using case‐crossover design [12].
Sensitivity analysis showed that that results for PM10 and daily stroke attack were not robust, but the results for PM2.5 and daily stroke attack was more robust than the former, which demonstrate heterogeneity across the studies.
Heterogeneity in the studies we reviewed may arise from inherent differences between the study settings, as well as from differences in study designs and analysis methods. First, the study areas were different with respect to exposure levels and ranges, pollutant mixtures, and meteorological conditions, and so on; this may have given rise to different dose‐response relationships. With respect to study design, we have found difference between time‐series design and case‐crossover design for the pooled risk estimation between same pollutants and stroke attack. Second, covariates included in analyses differed and residual confounding structures may differ among the studies, thus leading to heterogeneity in study results. However, the number of known risk factors for stoke attack is extremely small. All reviewed studies have controlled time trends in both air pollution exposures and outcomes, most articles had adjusted meteorological factors [4, 6, 7, 9, 10, 13, 14, 15, 16], 6 studies adjusted seasonality, [6, 8, 9, 11, 12, 13]. However, only 3 studies take account of effect on “day of week”, [8, 9, 15], only one of the reviewed studies controlled for effect of holiday [14], this may introduce bias for the dose–response relationships among studies. In order to obtain more objective results, for controlling more confounding factors, mate‐regression analysis will be used to investigate the research, which finding will be reported in the other article.
A symmetric inverted funnel shape shown in all the studies, which indicates that publication bias was unlikely. For few studies included in this review, it could not assess publication bias very well. However, given studies with positive, negative, and null effects were all included. For few studies in the meta‐analysis, we may assess quantitatively publication bias by using Begger's test or Egger's test.
Our research showed PM10 exposure had positive association with the increase of daily stroke attack in case‐crossover studies, no consistency with time‐series studies, PM2.5 exposure had positive association with the increase of daily stroke attack in time‐series studies, no consistent with Villeneuve et al.'s study using case‐crossover design. However, the following issues were needed to be considered: First, Covariates exist in different studies, including different meteorological conditions, vascular risk factors (such as sex, age, hypertension, ischaemic heart disease, cardiac arrhythmia, diabetes mellitus, dyslipidemia, and smoking history), stroke types, which could contribute to the heterogeneity among the studies. As to meteorological variables, although all the studies had adjusted the meteorological conditions (see Table 1), the methods might different. As to vascular risk factors, Dominici [11] found regional differences were investigated by dividing the United States into an Eastern region (Northeast, Southeast, Midwest, and South) and a Western region (West, Central, and Northwest). Le Tertre [7] found little evidence of an impact of particles on hospital admissions for ischaemic heart disease in people below 65 years or stroke for people over 65 years, however, populations included in our research were the whole population or the people more than 50 years old, so whether the result was suitable for the general population should be tested in the further, for the result might overestimate the relationship between pollutants and disease attack. And population susceptibility was needed to be concerned, though it might only play a small role. Villeneuve [12] pointed out that for the most part, air pollution risk estimates different substantially between men and women. But this is in contrast to a study in Seoul, Korea that found elderly women more susceptible to PM10, for acute stroke mortality, when compared to their similarly aged male counterparts. Henrotin [14] observed an increase in association in men with several cardiovascular risk factors (smoker, dyslipidemia, and hypertension). As to stroke types, Wellenius [6] evaluated the association between PM10 and hospital admissions for ischemic and hemorrhagic stroke, while Lee [8] only assessed the effects of ambient air pollution on ischemic cardiovascular diseases. Through all above, considering sample we collected in our research varied in meteorological conditions, sex, age, stroke type, and so on, so future research on adjusting study design methods and other confounding factors are urgent need. Second, atmospheric particulate matter measuring apparatus and methods themselves can cause error. Chan [10] etc. used air pollution levels from air‐monitoring stations to represent individuals’ exposures. Therefore, we could not avoid the measurement error of misclassifying our subjects’ exposures to air pollutants. Such exposure misclassification can bias our outcomes towards either null or positive results. Besides, the atmospheric particulate matter measuring apparatus and methods were different in different studies, so it is necessary to set a standardization of air pollution (e.g., PM10 and PM2.5) measurements for future meta‐analyses. Third, the diagnosis criterion has limitations. A person might have symptom onset likely preceded the date of admission in a proportion of cases, leading to less number of cases of stroke attack. So, more accurate assessments of the timing of symptom onset are needed. Fourth, since meta‐analysis results were based on few studies and some were statistically heterogeneous, we should carefully interpret them. Adding more research results, which can reduce the bias, is an important future task. Fifth, our research extracted only the largest number of the results when the studies contain multiple lag effect values, which might exaggerate our result. And we chose the adjusted results when the confounding factors had been adjusted in the studies, which might also affect the results of meta‐analyses. Sixth, when met studies that only contained OR of stroke attack associated with per QR (interquartile range) increase of the concentration of PM10 or PM2.5 as effect scale, we changed the original OR value into our objective value. This may increase the error. Finally, Yang pointed out that the efficiency of using funnel plot to estimate publication bias is close to 50% when there are only 10 or less than 10 studies included in the meta‐analysis [17]. And funnel plot can only be used to determine whether the graph is symmetry or not, cannot be used to identify publication bias. With studies we had, it was of some irrationality to tell whether the publication bias exists or not according to funnel plots. However, the results of Begger's test and Egger's tests provided some evidence that the publication bias were not likely in our research.
Up to now, no guidelines exist as to the minimum number of studies for meta‐analysis, Vrijheid et al. considered meta‐analyses could be conducted only if at least four studies had risk estimates [usually odds ratios (ORs)] for the same pollutant and diseases; this corresponded to having a minimum of 500 cases of diseases included in each analysis [18]. In our study, we calculated pooled risk estimates by meta‐analysis based on few studies (n = 4 or 6), but the total numbers of cases included were relatively large (between 122,170 and 11,517,158), there are a minimum of 759 cases of stroke attack among the studies.
Conclusions
This review and its meta‐analysis raise important issues that may guide both the design and presentation of future studies. There are positive association between particulate matter exposure and daily stroke attack. The result of meta‐analysis for the same issue may be difference among different study designs. Assessment of different study design methods, exposure measurement, different population evaluation and mechanistic knowledge are needed to study in depth.
Conflict of Interest
The authors declare no conflict of interest.
Acknowledgements
This research was supported by a grant from Hangzhou Science and Technology Bureau (Grants 200513231344), the Fundamental Research Funds for the Central Universities (Grants 2010QNA7020), additional support was provided by Zhejiang University Student Research Training Program (SRTP; 2010), Zhejiang University Public Health Innovative Experiment Project (2011), and Zhejiang Province Experimental Teaching Demonstration Center Construction Projects (Zhejiang Education Higher Education [2010] 89).
The first two authors contributed equally to this work.
References
- 1. Daniels MJ, Dominici F, Samet JM, et al Estimating particulate matter mortality dose‐response curves and threshold levels: An analysis of daily time‐series for the 20 largest US cities. Am J Epidemiol 2000;152(5):397–406. [DOI] [PubMed] [Google Scholar]
- 2. Dockery DW, Pope CA 3rd, Xu X, et al An association between air pollution and mortality in six US cities. N Engl J Med 1993;329(24):1753–9. [DOI] [PubMed] [Google Scholar]
- 3. Barclay J, Hillis G, Ayres J. Air pollution and the heart: Cardiovascular effects and mechanisms. Toxicol Rev 2005;24(2):115–23. [DOI] [PubMed] [Google Scholar]
- 4. Oudin A, Strömberg U, Jakobsson K, et al Hospital admissions for ischemic stroke: Does long‐term exposure to air pollution interact with major risk factors? Cerebrovasc Dis 2011;31(3):284–93. [DOI] [PubMed] [Google Scholar]
- 5. Vidale S, Bonanomi A, Guidotti M, et al Air pollution positively correlates with daily stroke admission and in hospital mortality: A study in the urban area of Como, Italy. Neurol Sci 2010;31(2):179–82 [DOI] [PubMed] [Google Scholar]
- 6. Wellenius GA, Schwartz J, Mittleman MA. Air pollution and hospital admissions for ischemic and hemorrhagic stroke among medicare beneficiaries. Stroke 2005;36(12):2549–53. [DOI] [PubMed] [Google Scholar]
- 7. Le Tertre A, Medina S, Samoli E, et al Short‐term effects of particulate air pollution on cardiovascular diseases in eight European cities. J Epidemiol Community Health 2002;56(10):773–9. [DOI] [PMC free article] [PubMed] [Google Scholar]
- 8. Lee JT, Kim H, Cho YS, et al Air pollution and hospital admissions for ischemic heart diseases among individuals 64+ years of age residing in Seoul, Korea. Arch Environ Health 2003;58(10):617–23. [DOI] [PubMed] [Google Scholar]
- 9. Tsai SS, Goggins WB, Chiu HF, et al Evidence for an association between air pollution and daily stroke admissions in Kaohsiung, Taiwan. Stroke 2003;34(11):2612–6. [DOI] [PubMed] [Google Scholar]
- 10. Chan CC, Chuang KJ, Chien LC, et al Urban air pollution and emergency admissions for cerebrovascular diseases in Taipei, Taiwan. Eur Heart J 2006;27(10):1238–44. [DOI] [PubMed] [Google Scholar]
- 11. Dominici F, Peng RD, Bell ML, et al Fine particulate air pollution and hospital admission for cardiovascular and respiratory diseases. JAMA 2006;295(10):1127–34. [DOI] [PMC free article] [PubMed] [Google Scholar]
- 12. Villeneuve PJ, Chen L, Stieb D, et al Associations between outdoor air pollution and emergency department visits for stroke in Edmonton, Canada. Eur J Epidemiol 2006;21(9):689–700. [DOI] [PubMed] [Google Scholar]
- 13. Bell ML, Levy JK, Lin Z. The effect of sandstorms and air pollution on cause‐specific hospital admissions in Taipei, Taiwan. Occup Environ Med 2008;65(2):104–11. [DOI] [PubMed] [Google Scholar]
- 14. Henrotin JB, Besancenot JP, Bejot Y, et al Short‐term effects of ozone air pollution on ischaemic stroke occurrence: A case‐crossover analysis from a 10 year population‐based study in Dijon, France. Occup Environ Med 2007;64(7):439–45. [DOI] [PMC free article] [PubMed] [Google Scholar]
- 15. Lisabeth LD, Escobar JD, Dvonch JT, et al Ambient air pollution and risk for ischemic stroke and transient ischemic attack. Ann Neurol 2008;64(1):53–9. [DOI] [PMC free article] [PubMed] [Google Scholar]
- 16. Andersen ZJ, Olsen TS, Andersen KK, et al Association between short‐term exposure to ultrafine particles and hospital admissions for stroke in Copenhagen, Denmark. Eur Heart J 2010;31(16):2034–40. [DOI] [PubMed] [Google Scholar]
- 17. Yang S, Li TT, Liu X. Study on effectiveness of funnel plot used in detecting publication bias. J Chendu Med College 2007. (2):33–35. [Google Scholar]
- 18. Vrijheid M, Martinez D, Manzanares S, Dadvand P, Schembari A, Rankin J. Nieuwenhuijsen M. Ambient air pollution and risk of congenital anomalies: A systematic review and meta‐analysis. Environ Health Perspect 2011. (5):598–606. [DOI] [PMC free article] [PubMed] [Google Scholar]