

Summary
Background and Purpose
MicroRNAs have recently been shown to regulate the downstream bioprocesses of intracerebral hemorrhage. The aim of this study was to investigate whether miRNAs can be used as biomarkers to predict secondary hematoma enlargement (HE) in patients with ICH.
Methods
Consecutively, 79 ICH patients admitted within 6 h of symptom onset and 30 healthy individuals were enrolled in this study. Whole‐genome miRNA expression profiles were generated in 32 patients (HE/non‐HE: 14/18). Representative differentially expressed miRNAs were measured in all cases (HE/non‐HE: 30/49) and normal controls (n = 30) by real‐time PCR.
Results
Thirty miRNAs showed differential expressions in the plasma samples from patients with HE as compared with the non‐HE controls. Compared to the hierarchical cluster analysis with all probes on microarray, all patients were separated into two main branches with only four exceptions by 30 differentially expressed miRNAs, improving the overall accuracy from 47.62 to 77.78% in the HE and 72.73 to 100% in the non‐HE group. Further support vector machine (SVM) test can discriminate the two groups with 100% accuracy with 10 differentially expressed miRNAs.
Conclusions
We demonstrated that multiple miRNAs are differentially expressed in the plasma of ICH patients with or without HE and may serve as circulating biomarkers for predicting HE after ICH.
Keywords: Biomarker, Hematoma enlargement, Intracerebral hemorrhage, MicroRNA
Introduction
Intracerebral hemorrhage (ICH) is a subtype of stroke, which accounts for 20 to 30% of all strokes, leads to catastrophic disability, and has a 6‐month mortality rate of more than 50% 1. However, compared with studies on ischemic stroke, studies on characterizing ICH and its subsequent effects are limited. After an acute ICH occurred, a series of pathophysiological processes would take place, including apoptosis and necrosis, breakdown of the blood–brain barrier, edema formation, inflammation, and extracellular matrix remodeling 2. Overall, one of the most devastating developments after ICH is hematoma enlargement (HE), which is an independent determinant of both mortality and functional outcome after ICH 3, 4, 5. Intense researches are being carried out to find the markers aiding the HE prediction in ICH patients.
MicroRNAs (miRNAs) are important posttranscriptional regulators of gene expression, which have been proven to be implicated in the pathogenesis of various neurological and vascular diseases 6. For example, Tan's team demonstrated that miRNAs were temporally regulated during progression and reperfusion of cerebral ischemia and that the miRNAs in total blood could be used as diagnostic markers 7. As a cluster of real‐time regulating effectors at the onset of ICH, miRNAs expression patterns change dramatically and start to function. Identifying specific miRNA signatures in HE may aid the diagnosis and risk stratification. It may also reveal previously unrecognized molecular targets for innovative therapies.
Most modern day clinical studies have relied on tissue‐based measurements of miRNAs abundances, but miRNAs are also released into the bloodstream and can be measured in human blood 8. Peripheral blood miRNAs, including miRNAs expressed by peripheral blood mononuclear cells (PBMCs) as well as extracellular/circulating miRNAs present in serum and plasma, may potentially provide for easy and rapid testing in clinical populations, assisting in diagnosis, or guiding therapy 9.
In this study, we hypothesized that circulating miRNAs play important roles in regulating bioprocesses related to the downstream effects of ICH; therefore, differentially expressed miRNAs might have a predictive value for the increased risk of HE after ICH. To test our hypothesis and identify new markers for determining anti‐HE therapeutic strategies, we conducted a genome‐wide screening of the miRNAs from blood samples of ICH patients with or without HE. A specific miRNA signature was established in the peripheral plasma, which was used to predict the secondary hematoma growth after ICH and reveal its underlying mechanism.
Materials and Methods
Ethics Statement
This study was approved by the Medical Ethics Committee of Beijing Tiantan Hospital, an affiliated teaching hospital of the Capital Medical University. Written informed consents were obtained from patients or their relatives.
Study Design
This retrospective case‐controlled research was based on a prospective cohort study. A complete description of patient selection and data collection has been published previously 10. In brief, consecutive primary ICH patients admitted within 6 h of symptom onset were included. All patients underwent noncontrast CT (NCCT) and multidetector CT angiography (MDCTA) on admission and a follow‐up NCCT at 24 h. Thirty healthy individuals registered for health check‐up were enrolled as the normal control. We examined the patterns of miRNA expression in plasma obtained from 79 ICH patients and normal controls in the following groups: (1) HE group (n = 30): within 24 h after hospitalization, hematoma volume growth >33% or >12.5 mL; (2) non‐HE group (n = 49): matched cases without hematoma growth; and (3) normal control group (n = 30): healthy individuals.
The collected demographic and clinical variables included gender, age, tobacco use, history of hypertension, diabetes, hyperlipidemia, admission blood pressures, and medications (antihypertensive and antiplatelet and anticoagulation agents). Laboratory tests on admission included white blood cell count and platelet count.
Blood Collection and Extraction of miRNAs from Blood Sample
Six milliliters of fasting venous EDTA‐blood samples was drawn from patients' right after the admission. The blood samples were centrifuged at 2,000 g for 5 min, and the plasma was aliquoted into 1.5‐mL tubes, followed by a 15‐min, high‐speed centrifugation at 13,800 g to completely remove cell debris, leaving only circulating RNA. Total RNA, which included miRNA, in 320 μL of plasma was isolated, and the small RNA fractions (<200 nt) were enriched using the mirVanaTM PARISTM RNA isolation kit following the manufacturer's instructions (Ambion, Austin, TX, USA). The concentration of small RNAs was determined by a NanoDrop ND‐1000 Spectrophotometer (Thermo Scientific, Rockland, DE, USA). The quality of RNAs was determined by Agilent BioAnalyzer 2100 (Agilent Technologies, Inc., Santa Clara, CA, USA) and then stored at −80°C until use.
MiRNA Expression Profiling from Circulating Blood Plasma Samples
Expression profiling was performed with personnel blinded to patient characteristics. Thirty‐two samples (n = 14, n = 18) were analyzed by the Human miRNA Microarray (V3)—Rel 12.0 Kit, 8x15K (Agilent Technologies, Inc., Santa Clara, CA, USA) according to the manufacturer's instructions. Each array contained eight replicates of 866 miRNAs and 89 human viral miRNAs as annotated in the Sanger miRBase 12.0. A total of 100 ng RNA was dephosphorylated and denaturalized in advance. Then, the samples were labeled with pCp‐Cy3 and hybridized for 20 h at 42°C. Microarrays were stringently washed and scanned on an Agilent microarray scanner (model G2565A; Agilent Technologies Inc., Santa Clara, CA, USA) at a sensitivity setting of 100 and 5%.
Bioinformatics Analysis
Agilent Feature Extraction (FE) software version 9.5.3 was used for image analysis. The background subtraction and quantile normalization were applied across different arrays, and eight replicate intensity values of each miRNA were summarized by their median value. We removed those miRNAs having absent expression in over half the samples, which meant the miRNAs had no expression in over 7 cases of the HE group, in the mean time, that had no expression in over 9 cases of the non‐HE group. As a result, our final data set contained expression levels of 667 miRNAs. By using t‐test or Glm method and setting the P‐value <0.05 as a cutoff threshold, the differentially expressed miRNAs between the two groups were screened out. The hierarchical clustering and principal component analysis (PCA) were carried out for both the samples and the differentially expressed miRNAs using the TM4 software 11. Support vector machine (SVM) program was applied to construct a model to detect hematoma growth after ICH. Putative messenger RNA targets of differentially expressed miRNAs were predicted by software microCosm, TargetScan, and PicTar. Only those targets simultaneously predicted by at least two algorithms were considered reliable. To better understand the function of the miRNA targets, we used Gene Set Enrichment Analysis (GSEA) to categorize targets by Gene Ontology (GO).
Quantitative Real‐time PCR
To verify the accuracy of the microarray‐based miRNA measurements, expression levels of hsa‐miR‐451, hsa‐miR‐16, hsa‐miR‐29c, and hsa‐miR‐122 were assessed by using quantitative real‐time PCR (QRT‐PCR) according to the manufacturer's instructions (Takara, Japan; Exiqon, Vedbaek, Denmark). The gene‐specific primers of the target miRNAs were customized by Takara, Japan, and Exiqon, Denmark. The QRT‐PCR assay was ran in triplicates for each sample to assess the technical variability. The small RNA solution was pretreated by TURBO DNA‐free™ Kit to remove contaminated DNA from RNA preparations. A literature search showed that expression of hsa‐miR‐451 and hsa‐miR‐16 is most commonly detected at high levels in the plasma or serum of normal individuals 12. Relative quantities of miRNA were calculated by using the comparative △△Ct method after normalization to the hsa‐miR‐451, because its amplification efficiency approximates most other miRNAs that have been tested. The fold change was calculated by 2−△△Ct.
Statistical Analysis
Demographic and clinical characteristics were compared among the three groups, patients with HE, without HE, and normal controls, using the chi‐square test for categorical variables and ANOVA test or Kruskal–Wallis test for continuous variables, respectively. The associations between hsa‐miR‐29c, hsa‐miR‐122, has‐miR‐16, and HE were analyzed by multivariate regression analysis with general line model, adjusting for potential confounders such as age, gender, and history of hypertension or SBP and DBP at admission. All data analyses were performed using SAS 9.1.3 (SAS Institute, Inc., Cary, NC, USA). For all tests, P < 0.05 was considered statistically significant.
Results
Demographic and Clinical Characterization of Study Population
The collected demographic and clinical variables of 79 patients and 30 normal controls in the study were summarized in Table 1.
Table 1.
Demographics of participant patients and normal controls
| Characteristics | Normal Controls (n = 30) | Patients with HE (n = 30) | Patients without HE (n = 49) | P‐value |
|---|---|---|---|---|
| Age (years) | 54.6 ± 7.95 | 58.2 ± 11.02 | 53.4 ± 8.75 | 0.09 |
| Gender (Male/Female,%) | 26/30 (86.7) | 26/4 (86.7) | 32/17 (65.3) | 0.03 |
| Currently Smoking, Y/N (%) | 14/30 (46.7) | 15/30 (50.0) | 27/49 (55.1) | 0.74 |
| History of Diabetes, Y/N (%) | 3/30 (10.0) | 4/30 (13.3) | 10/49 (20.4) | 0.33 |
| History of Hypertension, Y/N (%) | 10/30 (33.3) | 26/29 (89.7) | 35/48 (72.9) | 0.00 |
| History of Hyperlipidaemia, Y/N (%) | 5/30 (16.7) | 5/26 (19.2) | 8/47 (17.0) | 0.96 |
| SBP at admission (mmHg) | 133.3 ± 12.4 (n = 29) | 172.6 ± 26.3 (n = 30) | 172.3 ± 25.3 (n = 49) | 0.00 |
| DBP at admission (mmHg) | 87.8 ± 9.1 (n = 30) | 100.6 ± 16.1 (n = 30) | 99.8 ± 13.9 (n = 49) | 0.00 |
| WBC (10E9/L) | NA | 8.49 ± 2.89 | 205.7 ± 49.4 | 0.83 |
| PLT (10E9/L) | NA | 8.66 ± 3.49 | 195.8 ± 49.5 | 0.40 |
| Anticoagulant medication, (%) | NA | 0.00 | 0.00 | 1.00 |
| Antihypertensive medication, (%) | NA | 46.7 | 63.3 | 0.15 |
| Antiplatelet medication, (%) | NA | 13.3 | 16.4 | 0.72 |
NA, Data not available.
MiRNA Profiling and Identifying Differentially Expressed miRNAs from 32 Samples
We analyzed the expression of 866 miRNAs in the plasma of 14 patients with HE and 18 control subjects without HE after ICH. The microarray results demonstrated that a large number of miRNAs can be detected in human plasma samples. Among a total of 866 miRNAs on chips, 664 were detected in over half of the patients enrolled in this study (Supplementary Table 2). Differentially expressed miRNAs could also be recognized among the samples representing ICH patients with or without HE. Overall, we identified 30 differentially expressed miRNAs among patients with or without HE at an adjusted significance level of P < 0.05. The expression levels were represented in fold change numbers (Table 2). Notably, most differentially expressed miRNAs (19/31, 63.33%) were upregulated in the HE group compared with the non‐HE control group, while only 11 (11/30, 36.67%) miRNAs were significantly downregulated in such comparison. Among all chromosomes, chromosome X contained the most differentially expressed miRNAs (five definitely expressed miRNAs), followed by Chromosome 1 with 3, while the other 15 chromosomes contained fewer than 2 miRNAs.
Table 2.
MiRNAs that are differentially expressed in ICH patients with or without hematoma enlargement
| Serial number | Mature miRNA GSYM | P‐Valuea | Fold change | Chromosomal location |
|---|---|---|---|---|
| MicroRNAS with higher expression in hematoma enlargement cases | ||||
| 1 | hsa‐miR‐522 | 0.007 | 2.491 | Chromosome 19; NC_000019.9 |
| 2 | hsa‐miR‐1290 | 0.004 | 2.453 | Chromosome 1; NC_000001.10 |
| 3 | hsa‐miR‐586 | 0.008 | 2.000 | Chromosome 6; NC_000006.11 |
| 4 | hsa‐miR‐29c | 0.010 | 1.966 | Chromosome 1; NC_000001.10 |
| 5 | hsa‐miR‐100b | 0.016 | 1.955 | Chromosome 11; NC_000011.9 |
| 6 | hsa‐miR‐130ab | 0.007 | 1.895 | Chromosome 11; NC_000011.9 |
| 7 | hsa‐let‐7f‐2b | 0.008 | 1.895 | Chromosome X; NC_000023.10 |
| 8 | hsa‐miR‐574‐5p | 0.002 | 1.839 | Chromosome 4; NC_000004.11 |
| 9 | hsa‐miR‐29b‐1b | 0.016 | 1.781 | Chromosome 7; NC_000007.13 |
| 10 | hsa‐miR‐122 | 0.008 | 1.764 | Chromosome 18; NC_000018.9 |
| 11 | hsa‐miR‐19ab | 0.022 | 1.739 | Chromosome 13; NC_000013.10 |
| 12 | hsa‐miR‐29b | 0.023 | 1.726 | Chromosome 7; NC_000007.13 |
| 13 | hsa‐miR‐545b | 0.029 | 1.722 | Chromosome X; NC_000023.10 |
| 14 | hsa‐miR‐186b | 0.026 | 1.664 | Chromosome 1; NC_000001.10 |
| 15 | hsa‐miR‐518c | 0.041 | 1.635 | Chromosome 19; NC_000019.9 |
| 16 | hsa‐miR‐22 | 0.042 | 1.573 | Chromosome 17; NC_000017.10 |
| 17 | hsa‐miR‐542‐3p | 0.045 | 1.545 | Chromosome X; NC_000023.10 |
| 18 | hsa‐miR‐369‐3p | 0.033 | 1.516 | Chromosome 14; NC_000014.8 |
| 19 | hsa‐miR‐1294 | 0.042 | 1.432 | Chromosome 5; NC_000005.9 |
| MicroRNAS with lower expression in hematoma enlargement cases | ||||
| 20 | hsa‐miR‐211 | 0.043 | 0.641 | Chromosome 15; NC_000015.9 |
| 21 | hsa‐miR‐365 | 0.039 | 0.626 | Chromosome 16; NC_000016.9 |
| 22 | hsa‐miR‐598 | 0.046 | 0.622 | Chromosome 8; NC_000008.10 |
| 23 | hsa‐miR‐325 | 0.049 | 0.621 | Chromosome X; NC_000023.10 |
| 24 | hsa‐miR‐454b | 0.031 | 0.612 | Chromosome 17; NC_000017.10 |
| 25 | hsa‐miR‐573 | 0.047 | 0.587 | Chromosome 4; NC_000004.11 |
| 26 | hsa‐miR‐1265 | 0.013 | 0.577 | Chromosome 10; NC_000010.10 |
| 27 | hsa‐miR‐105b | 0.036 | 0.551 | Chromosome X; NC_000023.10 |
| 28 | hsa‐miR‐1225‐5p | 0.046 | 0.524 | Chromosome 16; NC_000016.9 |
| 29 | hsa‐miR‐1202 | 0.007 | 0.474 | Chromosome 6; NC_000006.11 |
| 30 | hsa‐miR‐1249 | 0.002 | 0.401 | Chromosome 22; NC_000022.10 |
P‐values reported are the result of comparison analysis of microRNA expression levels from 32(14/18) ICH patients with or without HE.
In the miRNA cloning study, investigators found that the same precursor could be transcripted from 5′ or 3′ respectively and generated two miRNA molecules. If the cloning research can determine the relative expression levels of the two molecules, a * sign was used to represent the secondary expression quantity molecule.
Plasma Level of Representative Differentially Expressed miRNAs in 79 Patients and 30 Normal Controls
The confirmation study was carried out in 30 patients with HE, 49 control subjects without HE after ICH, and 30 normal controls. Quantitative real‐time PCR (QRT‐PCR) results on representative measured miRNAs (miR‐16, miR‐29c, and miR‐122) were found to be consistent with the expression patterns observed by miRNA microarray profiling. Plasma levels of miRNA‐29c and miRNA‐122 were higher in the HE group than in the non‐HE controls based on microarray profiling (FC = 1.97, 1.76, respectively, P < 0.01; Table 2). In regard to QRT‐PCR measurement, miRNA‐29c was upregulated in the HE group compared with the non‐HE group by 2.069‐folds (P = 0.0011) and to the normal control group by 2.359‐folds (P = 0.0004). Although the same trend is also observed in the comparison of miRNA‐122 between the first two group by QRT‐PCR as by microarray with the fold change as 1.630, the difference did not reach statistical significance (P = 0.1269, Figure 1 and Table 3). We postulate that it is likely that further testing in a larger sample may improve the statistical power to a significant level. Encouragingly, miRNA‐122 was significantly higher expressed in normal control than HE group by 1.768‐folds (P = 0.0498). On the other hand, as a stably expressed miRNA in plasma and serum samples, the expression level of miRNA‐16 showed no significant difference among three groups, measured by either microarray or QRT‐PCR.
Figure 1.
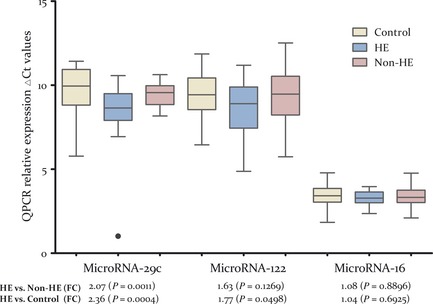
MicroRNAs differentially expressed between ICH patients with or without hematoma enlargement (HE) and normal controls. Note: The validation study using QRT‐PCR assays also showed miRNA‐29c and miRNA‐122 to be upregulated in HE cases versus non‐HE or HE cases versus normal controls. Schematic representation of miRNA‐29c and miRNA‐122 with differential expression among three groups (n = 30, 30, and 49 respectively) after the statistical test are shown. MiRNA‐16 is used as a no‐expression change representation of microarray data, given its relative stable expression level in plasma and serum like miRNA‐451. The y‐axis represents units of delta Ct (Ctmi RNA ‐interest − Ctmi RNA ‐451), with an arbitrary zero point, so that each unit measures a 2‐fold change. The fold changes among HE, non‐HE, and normal control group are displayed below each miRNA along with the P‐values.
Table 3.
Plasma level of circulating differential MicroRNAs in all ICH patients and normal controls enrolled into the study (measured by QPCR)
| MicroRNA name | Average △Ct value (Control group) | Average △Ct value (HE group) | Average △Ct value (Non‐HE group) | Fold Change (FC) (HE vs. Control, P‐value) | Fold Change (FC) (HE vs. Non‐HE, P‐value) |
|---|---|---|---|---|---|
| Has‐miR‐29c |
9.66 ± 1.43 (n = 28) |
8.42 ± 1.73 (n = 29) |
9.46 ± 0.7 (n = 48) |
2.36 (P = 0.00) |
2.07 (P = 0.00) |
| Has‐miR‐122 |
9.41 ± 1.33 (n = 29) |
8.58 ± 1.62 (n = 26) |
9.26 ± 1.61 (n = 47) |
1.77 (P = 0.05) |
1.63 (P = 0.13) |
| Has‐miR‐16 |
3.33 ± 1.07 (n = 30) |
3.27 ± 0.43 (n = 25) |
3.38 ± 0.56 (n = 48) |
1.04 (P = 0.69) |
1.08 (P = 0.89) |
Circulating miRNA Signatures Show Early Predictive Values of Risk of HE after ICH Onset
Although individual miRNAs have shown predictive value in the presence of HE after ICH, we further tested whether combined miRNA signatures derived from unsupervised hierarchical clustering improved sensitivity and specificity. First, to test for common patterns in HE patients and controls, we separately applied hierarchical clustering by using the expression of all probes on microarray and the 30 differentially expressed probes screened out in our study. As shown in heat maps (Figure 2A and B), patients were clustered separately into two main branches with only four outliers in the non‐HE cases by 30‐probe clustering test. The overall accuracies of the cluster increased from 47.62% (10/21) to 77.78% (14/18) in the HE group and from 72.73% (8/11) to 100% (14/14) in the non‐HE group according to two clustering sets. To improve the predictive power of a miRNA‐based biomarker, we next tried to construct a prediction model combining a cohort of these differentially expressed miRNAs by using statistical learning techniques. A SVM was applied as described in the Materials and Methods section. We added the differentially expressed miRNAs to the model sequentially according to the increasing trend of P‐value and evaluated the sensitivity and specificity of each model. Interestingly, the best result was obtained by using linear basis function SVM and a subset of 10 miRNAs with the lowest P‐values in order (hsa‐miR‐1249, hsa‐miR‐574‐5p, hsa‐miR‐1290, hsa‐miR‐522, hsa‐miR‐130a*, hsa‐miR‐1202, hsa‐let‐7f‐2*, hsa‐miR‐586, hsa‐miR‐122, and hsa‐miR‐29c). Ten signature miRNAs allowed discrimination of HE patients from controls with an accuracy of 100%, a specificity of 100%, and a sensitivity of 90% (Table 4, Figure 2C,D), representing a significant improvement from single miRNA predictor.
Figure 2.
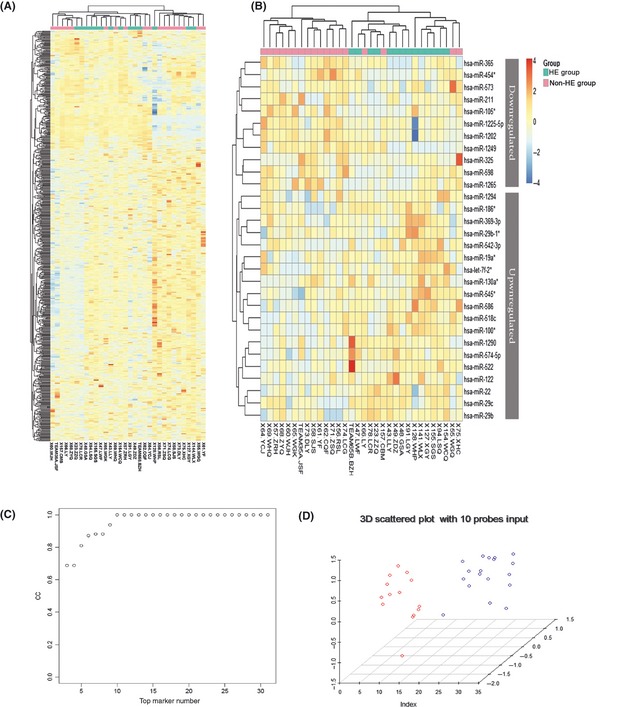
Hierarchical Cluster Heatmap of circulating miRNAs and classification results using a trained support vector machine (SVM) in patients with or without hematoma enlargement (HE) after ICH. Note: Unsupervised hierarchical clustering of expression level of the overall probe miRNAs on the microarray (A) or 30 most dysregulated miRNAs (B) were carried out by using the Euclidian distance measure. HE patients (n = 14) and control subjects (n = 18) cluster separately with only four outliers in the analysis with 30 probes, showing that distinct miRNA patterns were unique for cases and controls, respectively. The miRNAs represented in the heat map are listed in Supplementary Table 2 and Table 2. (C) The classification accuracy reaches 100%, when a subset of 10 miRNAs with the lowest P‐value is added to the SVM model in a forward manner according to the P‐value and growing trends. (D) A 3D scattered plot shows that the total 32 ICH patients with or without HE were completely separated into two groups, leading to an accuracy of 100%.
Table 4.
Complex miRNA signatures predict HE happens after ICH
| MiRNA Marker number | TP | FN | TN | FP | CC | Accuracy |
|---|---|---|---|---|---|---|
| 3 | 10 | 4 | 17 | 1 | 0.69 | 0.84 |
| 4 | 10 | 4 | 17 | 1 | 0.69 | 0.84 |
| 5 a | 12 | 2 | 17 | 1 | 0.81 | 0.91 |
| 6 a | 13 | 1 | 17 | 1 | 0.87 | 0.94 |
| 7 a | 14 | 0 | 16 | 2 | 0.88 | 0.94 |
| 8 a | 14 | 0 | 16 | 2 | 0.88 | 0.94 |
| 9 a | 14 | 0 | 17 | 1 | 0.94 | 0.97 |
| 10 b | 14 | 0 | 18 | 0 | 1.00 | 1.00 |
| ⋮ | ⋮ | ⋮ | ⋮ | ⋮ | ⋮ | ⋮ |
| 30 b | 14 | 0 | 18 | 0 | 1.00 | 1.00 |
TP, true positive; FN, false negative; TN, True negative; FP, false positive; CC, correlation coefficient. aThe classification accuracy by miRNA markers reach 90% are in bold letters. bThe classification accuracy by miRNA markers reach 100% are in darker highlight.
Target Genes Predictions and Potential Molecular Mechanism Exploratory from Gene Ontology and Pathway Analysis
Three widely used algorithms (TargetScan, miRanda, and picTar) were employed to obtain the gene list predicted to be targeted by the 30 differentially expressed miRNAs. As a result, we identified 1598 predicted target genes (Supplementary Table 3), belonging to seven miRNAs. Among the miRNAs with high hit rate, miRNA 29b/c occupied the first place with 716 and 710 target genes, respectively. Then, GO analysis revealed that a broad range of biological processes or molecular function categories were enriched among the target gene list (Supplementary Table 1), including cell apoptosis, collagen biosynthesis, blood vessel development and morphogenesis, cell‐cell or cell‐substrate adhesion, extracellular matrix constituent and binding, metalloendopeptidase activity, ion channel and transporter activity, water homeostasis, and inflammatory response. Individual miRNAs are involved in a variety of biological responses, and certain categories are also enriched in their own target genes. A representive interaction network was constructed to delve whether several miRNA control a group of genes collectively. The result was illustrated in Supplementary Figure 1. From this ultra dense network, we conclude that the multiple target genes are regulated by individual miRNA and there are overlaps of their regulations among difference miRNAs.
Discussion
Our study was the first to show that variations in miRNA expression occur after the onset of ICH. There are distinct circulating miRNA profiles in patients with ICH with or without secondary HE. Circulating miRNAs may be the most appropriate biomarkers that can be used as a diagnostic signature and the target for therapeutic intervention. This is because miRNAs are the most stable bioactive molecules that are promptly and stably expressed during disease progression. By assessing genome‐wide miRNA expression levels in the peripheral blood, we demonstrated that plasma miRNAs could be reliably measured in patients and those distinct patterns of miRNA profiles was generalized between 14 ICH patients with HE and 18 ICH patients without HE. A total of 30 independent miRNAs were differentially expressed between the plasma samples collected from two groups (Ps<0.05; Table 2). Nineteen miRNAs were expressed at higher levels in the HE group with hsa‐miR‐522, hsa‐miR‐1249, and hsa‐miR‐586 enriched the most at 2.49‐, 2.45‐, and 2.00‐fold changes, respectively, followed by hsa‐miR‐29c and hsa‐miR‐100 at 1.97‐ and 1.96‐fold changes, respectively. Most of the upregulated miRNAs showed >1.5‐fold changes, with only one exception (hsa‐miR‐1294 with fold change at 1.43). Eleven miRNAs were expressed at lower levels in the HE group with hsa‐miR‐1249 and hsa‐miR‐1202 downregulated the most at 0.47‐ and 0.40‐fold changes, respectively, followed by hsa‐miR‐1225‐5p, hsa‐miR‐105*, hsa‐miR‐1265, and hsa‐miR‐573 at 0.52‐, 0.55‐, 0.58‐, and 0.59‐fold changes, respectively. The remaining downregulated miRNAs showed <0.65‐fold changes. The results indicate that miRNA biomarkers can be used in the prediction of hematoma growth. To validate whether complex miRNA signature may serve as a new class of biomarkers in predicting the HE happening after ICH, SVM was applied to construct a model for the discrimination of HE happening after ICH. The classification accuracy by the miR signatures reached 90% using subset of 5 miRNAs, and the best result was obtained using a subset of 10 miRNAs at an accuracy of 100% (see in Table 4 and Figure 2C, D).
The similar applications of miRNA biomarker were reported in former studies. Liu et al. 13 found that the different brain damage conditions showed different miRNAs profile patterns, including ischemic stroke, intracerebral hemorrhage, and kainate seizures, and the miRNA expression changes could be detect both in brain tissue and peripheral blood samples. There is also evidence in support of temporal changes in expression of miRNAs during stroke progression. In stroke etiology, miRNA may modulate pathogenic processes including atherosclerosis (miR‐21, miR‐126), hyperlipidemia (miR‐33, miR‐125a‐5p), hypertension (miR‐155), and plaque rupture (miR‐222, miR‐210). Following focal cerebral ischemia, significant expression changes implicate miRNA in the pathological cascade of events that include blood–brain barrier disruption (miR‐15a) and cell death signaling (miR‐497). Early activation of miR‐200 family members improves neural cell survival and subsequent HIF‐1α stabilization. Pro‐ (miR‐125b) and antiinflammatory (miR‐26a, ‐34a, ‐145, and let‐7b) miRNAs may also positively influence stroke outcomes 14. Kay's informative study demonstrates that the peripheral blood miRNAs profiles of small artery (SA) stroke samples showed a distinctly different pattern from that of the large artery (LA) strokes samples. Their most plausible finding is that, by hierarchical clustering analysis among the different subtypes, undetermined etiology (UDE) of stroke samples (n = 3) resembled the profile of small artery stroke (SA, n = 3). The result showed promising potential of classifying patients by the miRNA biomarkers beyond clinical diagnosis and uncover the etiology mechanism of UDE stroke 7.
The differentially expressed miRNAs in our data were closely related to several important bioprocesses underlining early hematoma expansion. (1) We have identified the plasma levels of apoptosis‐related miRNAs 15, 16, 17, 18, 19, 20. For example, the expression levels of miRNA‐29b (FC = 1.73)/miRNA‐29c (FC = 1.97)/miRNA‐29b‐1* (FC = 1.78), miRNA‐574‐5p (FC = 1.84) and miRNA‐22 (FC = 1.57) and miRNA‐122 (FC = 1.76) were higher in HE group in comparison with the non‐HE control group. These miRNAs may have played a role in inducing apoptosis in the cascade of pathological changes after ICH, which reflects the severity of tissue necrosis and vascular structural damage around the hematoma in the HE group. (2) Inflammatory mechanisms play the central role in the progression of ICH‐induced brain injury. Many inflammatory pathways are known to be regulated by miRNAs, and the proinflammation miRNAs have also been upregulated in HE group in our profiling data 21, 22, 23, 24. The HE patients showed higher plasma levels of miR‐let‐7f (FC = 1.90), miR‐19a (FC = 1.74), miR‐122(FC = 1.76), miR‐29b (FC = 1.73), miR‐29b‐1* (FC = 1.78), and miR‐29c (FC = 1.97). (3) Acute hypertension is associated with hematoma enlargement and poor clinical outcomes of ICH, but up to now, little is known about how elevated BP influences ICH‐related brain injury25, 26, 27. Logically reasonable, in our data, the miRNAs that related to the elevation of blood pressure were also upregulated in HE group. They included miR‐130a (fold change = 1.90), let‐7f (the same family member of let‐7e, fold change = 1.90), and miR‐19a (a member of miR‐17/92 gene cluster, fold change = 1.74). This finding indicated that some miRNAs might prompt HE by upregulating the blood pressure in ICH patients, showing their predicting and intervening potential for HE. (4) Patients with HE were more likely to have coagulation abnormalities, which might represent another therapeutic opportunity 28. A study on tissue factor (TF), the main initiator of the coagulation cascade, demonstrated that over‐expression of two members of miR‐17/92 cluster (miR‐19b and miR‐20a) decreased TF mRNA, protein levels, and the procoagulant activity by 60% 29. It is very meaningful we identified the higher expression of miR‐19a (a sequence highly similar to miR‐19b) in the HE group in our study may indicating the downregulation of TF and the consequential coagulation disorders. (5) Injecting collagenase has been a way of creating ICH in animal model by dissolving collagen composition in the extracellular matrix around vascular basement 30. Collagen also serves as a crucial initiator of platelet aggregation and ATP release, initiating coagulation cascade 31. It is beyond doubt that collagen composition is a necessary participator in hematoma formation and development. MiR‐29 family is well predicted and reported to downregulate a scala of profibrotic targets, including collagens, fibrillin‐1, and elastin‐132. In our study, we have screened out probes of three related functional miRNAs elevated in HE group—miR‐29b (FC = 1.73), miR‐29b‐1* (FC = 1.78), and miR‐29c (FC = 1.97).
To systematically understand the pathological roles of the 1598 target genes, gene ontology (GO) analysis was performed to show that differentially regulated miRNAs can affect certain categories of biological processes, such as apoptosis and cell proliferation regulation, immune and hypoxia response, collagen biosynthesis and blood vessel development regulation, water homeostasis and electric ion channel activity regulation, energy metabolic process and coagulation, extracellular matrix constituent and cell surface binding, and blood pressure control and inflammation activation (as listed in Supplementary Table 1). The comprehensive analysis of the functional related miRNA set up an ultra dense network (Supplementary Figure 1), which we inferred came from the multiple target genes regulated by individual miRNA and the overlap of their regulation. The miRNA‐29b and miRNA‐29c are in the central of this network and regulated the maximum number of target genes. GO analysis also indicated that miRNA‐29 family is involved in most of these pathological settings, indicating their important roles in HE. Taken together, these exploratory analyses suggested that variation in the plasma level of key circulating miRNAs might affect critical biological processes or molecular functions involved in the development of HE, an important mechanism warranting further research. In addition, we have also seen some related pathway to be involved: ECM–receptor interaction pathway (KEGG: hsa04512), focal adhesion (KEGG: hsa04510), VEGF signaling pathway (KEGG: hsa04370), neuroactive ligand–receptor interaction (KEGG: hsa04080) etc. However, there was no significant enrichment of these pathways. As the prediction model of miRNA may contain both false positive and negative results, it is a necessity to further confirm their roles by conducting more functional experiments.
Conclusions
Our study has found that the profiles of miRNA are stable in the circulation and surprisingly informative. Complex miRNA signatures could potentially serve as a new class of biomarkers to predict HE after ICH. The classification accuracy by the miRNA signatures reached 90% by using the subset of 5 miRNAs, and the best result was obtained by using a subset of 10 miRNAs with an accuracy of 100%. The results presented here establish the foundation and rationale to motivate future global investigations on the biological effects of these miRNAs in the fundamental molecular pathophysiology of HE. Further prospective studies with larger sample size are needed to assess the clinical application of this miRNA signature. We are optimistic that circulating systemic miRNA analysis has great potential as a novel and clinically useful biomarker to predict HE.
Conflict of Interest
At the time of submission, the manuscript has not been submitted elsewhere. All of the authors have no relationships with companies that have a financial interest in the information contained in the manuscript.
Supporting information
Figure S1. The co‐regulations network of target genes by multiple microRNAs.
Table S1. The main target biological process and related Individual differentially expressed miRNA.
Table S2. miRNAs that can be detected in ICH patients' plasma samples.
Table S3. The target genes predicted to be regulated by the differentially expressed microRNA.
Acknowledgments
This work was supported in parts by funding of the Beijing Clinical Medicine (Neuroscience) interdisciplinary group project (No. PXM2010_014226_07_000094), National Natural Science Foundation of China (81000505), and the Beijing New Star Plan of Science and Technology (No. 2007B047). Yongjun Wang is the recipient of the Beijing Clinical Medicine (Neuroscience) interdisciplinary group project. Yilong Wang is the recipient of the National Natural Science Foundation of China and Beijing New Star Plan of Science and Technology. We appreciated Beijing Biobank of Cerebral Vascular Disease and Professor Shouling Wu from the Kailuan Hospital to provide the blood samples.
The first two authors contributed equally to this work.
References
- 1. Lim JK, Hwang HS, Cho BM, et al. Multivariate analysis of risk factors of hematoma expansion in spontaneous intracerebral hemorrhage. Surg Neurol 2008;69:40–45, discussion 5. [DOI] [PubMed] [Google Scholar]
- 2. Tan JR, Koo YX, Kaur P, et al. microRNAs in stroke pathogenesis. Curr Mol Med 2011;11:76–92. [DOI] [PubMed] [Google Scholar]
- 3. Kumar S, Badrinath HR. Early recombinant factor VIIa therapy in acute intracerebral hemorrhage: promising approach. Neurol India 2006;54:24–27. [DOI] [PubMed] [Google Scholar]
- 4. Harper G, Castleden CM, Potter JF. Factors affecting changes in blood pressure after acute stroke. Stroke 1994;25:1726–1729. [DOI] [PubMed] [Google Scholar]
- 5. Broderick JP, Brott TG, Duldner JE, Tomsick T, Huster G. Volume of intracerebral hemorrhage. A powerful and easy‐to‐use predictor of 30‐day mortality. Stroke 1993;24:987–993. [DOI] [PubMed] [Google Scholar]
- 6. Hwang HW, Mendell JT. MicroRNAs in cell proliferation, cell death, and tumorigenesis. Br J Cancer 2006;94:776–780. [DOI] [PMC free article] [PubMed] [Google Scholar]
- 7. Tan KS, Armugam A, Sepramaniam S, et al. Expression profile of MicroRNAs in young stroke patients. PLoS ONE 2009;4:e7689. [DOI] [PMC free article] [PubMed] [Google Scholar]
- 8. Markham DW, Hill JA. MicroRNAs and heart failure diagnosis: MiR‐acle or MiR‐age? Circ Res 2010;106:1011–1013. [DOI] [PMC free article] [PubMed] [Google Scholar]
- 9. Di Stefano V, Zaccagnini G, Capogrossi MC, Martelli F. microRNAs as peripheral blood biomarkers of cardiovascular disease. Vascul Pharmacol 2011;55:111–118. [DOI] [PubMed] [Google Scholar]
- 10. Li N, Wang Y, Wang W, et al. Contrast extravasation on computed tomography angiography predicts clinical outcome in primary intracerebral hemorrhage: a prospective study of 139 cases. Stroke 2011;42:3441–3446. [DOI] [PubMed] [Google Scholar]
- 11. Saeed AI, Sharov V, White J, et al. TM4: a free, open‐source system for microarray data management and analysis. Biotechniques 2003;34:374–378. [DOI] [PubMed] [Google Scholar]
- 12. Kirschner MB, Kao SC, Edelman JJ, et al. Haemolysis during sample preparation alters microRNA content of plasma. PLoS ONE 2011;6:e24145. [DOI] [PMC free article] [PubMed] [Google Scholar]
- 13. Liu DZ, Tian Y, Ander BP, et al. Brain and blood microRNA expression profiling of ischemic stroke, intracerebral hemorrhage, and kainate seizures. J Cereb Blood Flow Metab 2010;30:92–101. [DOI] [PMC free article] [PubMed] [Google Scholar]
- 14. Rink C, Khanna S. MicroRNA in ischemic stroke etiology and pathology. Physiol Genomics 2011;43:521–528. [DOI] [PMC free article] [PubMed] [Google Scholar]
- 15. Merk DR, Chin JT, Dake BA, et al. miR‐29b participates in early aneurysm development in Marfan syndrome. Circ Res 2012;110:312–324. [DOI] [PubMed] [Google Scholar]
- 16. Wang CM, Wang Y, Fan CG, et al. miR‐29c targets TNFAIP3, inhibits cell proliferation and induces apoptosis in hepatitis B virus‐related hepatocellular carcinoma. Biochem Biophys Res Commun 2011;411:586–592. [DOI] [PubMed] [Google Scholar]
- 17. Yang F, Zhang L, Wang F, et al. Modulation of the unfolded protein response is the core of microRNA‐122‐involved sensitivity to chemotherapy in hepatocellular carcinoma. Neoplasia 2011;13:590–600. [DOI] [PMC free article] [PubMed] [Google Scholar]
- 18. Tatarano S, Chiyomaru T, Kawakami K, et al. Novel oncogenic function of mesoderm development candidate 1 and its regulation by MiR‐574‐3p in bladder cancer cell lines. Int J Oncol 2012;40:951–959. [DOI] [PMC free article] [PubMed] [Google Scholar]
- 19. Li J, Zhang Y, Zhao J, Kong F, Chen Y. Overexpression of miR‐22 reverses paclitaxel‐induced chemoresistance through activation of PTEN signaling in p53‐mutated colon cancer cells. Mol Cell Biochem 2011;357:31–38. [DOI] [PubMed] [Google Scholar]
- 20. Madathil SK, Nelson PT, Saatman KE, Wilfred BR. MicroRNAs in CNS injury: potential roles and therapeutic implications. BioEssays 2011;33:21–26. [DOI] [PMC free article] [PubMed] [Google Scholar]
- 21. Wang J, Dore S. Inflammation after intracerebral hemorrhage. J Cereb Blood Flow Metab 2007;27:894–908. [DOI] [PubMed] [Google Scholar]
- 22. Schaefer JS, Montufar‐Solis D, Vigneswaran N, Klein JR. Selective upregulation of microRNA expression in peripheral blood leukocytes in IL‐10‐/‐ mice precedes expression in the colon. J Immunol 2011;187:5834–5841. [DOI] [PMC free article] [PubMed] [Google Scholar]
- 23. Matsushima K, Isomoto H, Inoue N, et al. MicroRNA signatures in Helicobacter pylori‐infected gastric mucosa. Int J Cancer 2011;128:361–370. [DOI] [PubMed] [Google Scholar]
- 24. Cermelli S, Ruggieri A, Marrero JA, Ioannou GN, Beretta L. Circulating microRNAs in patients with chronic hepatitis C and non‐alcoholic fatty liver disease. PLoS ONE 2011;6:e23937. [DOI] [PMC free article] [PubMed] [Google Scholar]
- 25. Koga M, Toyoda K, Naganuma M, et al. Nationwide survey of antihypertensive treatment for acute intracerebral hemorrhage in Japan. Hypertens Res 2009;32:759–764. [DOI] [PubMed] [Google Scholar]
- 26. Ohwaki K, Yano E, Nagashima H, Hirata M, Nakagomi T, Tamura A. Blood pressure management in acute intracerebral hemorrhage: relationship between elevated blood pressure and hematoma enlargement. Stroke 2004;35:1364–1367. [DOI] [PubMed] [Google Scholar]
- 27. Sang YH, Su HX, Wu WT, So KF, Cheung RT. Elevated blood pressure aggravates intracerebral hemorrhage‐induced brain injury. J Neurotrauma 2011;28:2523–2534. [DOI] [PMC free article] [PubMed] [Google Scholar]
- 28. Rajajee V, Brown DM, Tuhrim S. Coagulation abnormalities following primary intracerebral hemorrhage. J Stroke Cerebrovasc Dis 2004;13:47–51. [DOI] [PubMed] [Google Scholar]
- 29. Teruel R, Perez‐Sanchez C, Corral J, et al. Identification of miRNAs as potential modulators of tissue factor expression in patients with systemic lupus erythematosus and antiphospholipid syndrome. J Thromb Haemost 2011;9:1985–1992. [DOI] [PubMed] [Google Scholar]
- 30. Carhuapoma JR, Mayer SA, Hanley DF. Animal models and experimental treatments of intracerebral hemorrhage. Intracerebral Hemorrhage 2010;17:192–205. [Google Scholar]
- 31. Ziai WC, Torbey MT, Kickler TS, Oh S, Bhardwaj A, Wityk RJ. Platelet count and function in spontaneous intracerebral hemorrhage. J Stroke Cerebrovasc Dis 2003;12:201–206. [DOI] [PubMed] [Google Scholar]
- 32. Schroen B, Heymans S. MicroRNAs and beyond: the heart reveals its treasures. Hypertension 2009;54:1189–1194. [DOI] [PubMed] [Google Scholar]
Associated Data
This section collects any data citations, data availability statements, or supplementary materials included in this article.
Supplementary Materials
Figure S1. The co‐regulations network of target genes by multiple microRNAs.
Table S1. The main target biological process and related Individual differentially expressed miRNA.
Table S2. miRNAs that can be detected in ICH patients' plasma samples.
Table S3. The target genes predicted to be regulated by the differentially expressed microRNA.