

Summary
Introduction
Astrocytoma is among the most common intracranial tumors and radiotherapy is typically used after its resection. One of the outstanding problems encountered in the treatment is radioresistance. The lack of efficient biomarkers for evaluating the radiosensitivity of glioma precludes advances in treatment of astrocytoma and remains the most fatal cancer.
Methods
To identify potential biomarkers for assessing the radioresistance of astrocytomas, the following study investigated the proteome of astrocytoma in surgical samples from 15 typical patients. The patients were divided into 2 groups: radioresistant vs. radiosensitive (controls). Proteome was assessed using two‐dimensional liquid chromatography tandem mass spectrometry (2D‐LC–MS/MS). Western blot was adopted to confirm the differential expression of proteins.
Results
A total of 36 proteins were expressed differently between the 2 groups, represented by cofilin‐1 and phosphoglycerate kinase 1 (PGK1), which up‐regulated significantly in radioresistant astrocytomas though there was no obvious morphological change of tumors. Western blot analysis revealed elevated levels of protein extracts in radioresistant astrocytomas compared with the radiosensitive group.
Conclusions
The results indicated cofilin‐1 enhances the motility of tumor cells which is important invasive potential of malignancy. PGK1 is metabolic enzyme and seems to be correlated with the negative prognosis following radiotherapy. Thus, cofilin‐1 and PGK1 might be involved in the radioresistant phenotype and are potential biomarkers for developing better therapeutic methods.
Keywords: Astrocytomas, Prognosis, Proteomics, Radioresistance, Radiotherapy
Introduction
Glioma represents the most aggressive malignant tumor in the brain, and astrocytoma, the most common type, accounts for 33.3% of all newly diagnosed brain tumors 1. Despite the advances in neurosurgical technology, radiation therapy, and chemotherapy, more than 90% of astrocytomas recur within 2 cm of the primary tumor margin 2. Gliomas have diverse prognosis even at the same grade and histological category, which is particularly associated with the highly heterogeneous biological aggressiveness 3, 4.
While radiotherapy is extensively used to decrease the recurrence after resection of neoplasm, radioresistance is a widespread challenge in astrocytomas therapy. It is still an open question why astrocytomas of the same pathological grade have different radioresponses. The lack of efficient biomarkers for evaluating the radiosensitivity of glioma precludes advances in treatment of astrocytoma and remains the most fatal cancer 5. Matching a certain medical strategy to a certain patient is the key for modern clinical oncology. However, current clinical diagnosis and treatment of glioma is almost exclusively based on tissue histopathology, which partially reflects characteristics of glioma (Figure 1).
Figure 1.
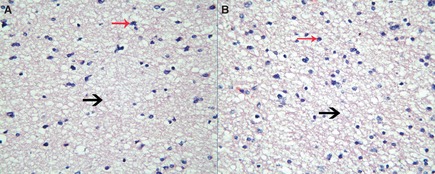
Histopathology of astrocytomas with different radioresponse (×400). Astrocytoma in section (A) was radioresistant, and astrocytoma in section (B) was radiosensitive. The pathological sections had demonstrated no remarkable gross morphology change. Both histopathology sections were accordance with diffuse astrocytoma. They were composed of well‐differentiated neoplastic astrocytes (red arrow) on the background of a loosely structured (black arrow) and microcystic tumor matrix. In comparison with normal brain, cellularity was moderately increased and occasional nuclear atypia. Mitotic activity was generally absent, and the absence of necrosis or microvascular proliferation was the typical feature. Tissue histopathology reflects glioma radiosensitivity partially.
A faster and objective assessment of radiotherapy efficacy is crucial. The identification of radiosensitivity biomarkers will provide a contribution to treatment decision, prognosis, and assessment of treatment response of gliomas. Proteins, the executant of cell functions, could be the ideal molecular biomarkers. Current neuro‐oncology research is expecting to obtain an adequate molecular signature that could predict the radioresponsive phenotype, and proteomic approaches are the most efficient. Proteomics has evolved swiftly over the past decade and is widely applied to get potential biomarkers of malignant lesions 6, 7.
Over the past years, glioma proteomics has been attempted at different levels: analysis of molecules for accurate classification 8 or patients survival 9. Few efforts have been focused on radiosensitivity of astrocytomas. As proteomic technology grows increasingly, its application should present possibility to improve the effectiveness of radiotherapy.
Two‐dimensional liquid chromatography tandem mass spectrometry (2D‐LC–MS/MS), a reliable method for quickly resolving small quantities of proteins, can allow comparison of protein intensity between samples. We investigated the proteomes of radioresistant gliomas and radiosensitive ones qualitatively and quantitatively. Particular attention was paid to select the same grade of astrocytoma to ascertain that differences reflected by liquid chromatography would be exclusively related to the different radiosensitivity of glioma.
Methods
Materials
The following reagents were purchased from Bio‐Rad Company (Hercules, CA, USA): Urea, Tris–HCl, 3‐[(3‐cholamidopropyl) dimethyl‐ ammonio]‐1‐propanesulfonate (CHAPS), 4‐(2‐AminoEthyl)‐Benzene Sulfonyl Fluoride HCl (AEBSF‐HCl), Aprotinin, Bestatin, E‐64, Leupeptin Hemisulfate, Pepstatin A, Sodium fluoride, Imidazole, Sodium orthovanadate, Bull Serum Albumin (BSA), Dithiothreitol (DTT), Indole‐3‐acetic acid (IAA) and the protein assay (Bio‐Rad Co.). Sodium bicarbonate was obtained from Sigma‐Aldrich Company (MO, USA). Acetone, alcohol, formic acid, and ammonium hydroxide were purchased from Sinopharm (China), Methyl Cyanides from Fisher (Fairlawn, NJ, USA), trypsin from KeyTag (Shanghai, China), respectively.
Subjects and Clinical Material Collection
A total of 15 patients with astrocytomas were eligible. Their tissues were obtained with informed consent and institutional review board approval. All of the 15 patients underwent gliomas surgical procedures at the Brain Hospital Affiliated to Nanjing Medical University. Samples were collected at the time of surgery, each of whom was “snap frozen” in liquid nitrogen after surgical removal, and stored at −80°C until analysis. The frozen tissue blocks were used to analyze the proteomic patterns of astrocytomas.
The astrocytomas were located at frontal or temple lobe and were completely excised assisted by microscope. All patients were administered with intensity‐modulated radiation therapy (IMRT) after surgery without any chemotherapy. The histopathological diagnosis of 15 astrocytoma tissue samples was grade II according to WHO classification (2000). There were 7 men and 8 women, whom were 22–47 years old at glioma diagnosis.
The radiosensitive group was composed of 7 patients with a recurrence‐free survival of longer than 5 years till now. The astrocytomas in the other 8 patients presented radioresistance. The tumors recurred in situ within 2 years and increased staging in 5 cases. Eventually, these patients died of glioma recurrence. The pathological sections of 15 astrocytoma tissues demonstrated nothing on the prognosis or the radiosensitivity. Each of these sections had no significant characteristics.
Tissues Processing
The tumor tissues analyzed by 2D‐LC–LC/MS were homogenized in lysis buffer (8 M urea, 50 mM Tris–HCl, 5% CHAPS and protease inhibitors cocktail), and then, the suspension was sonicated at an ice‐bath to facilitate protein solubilization. The protein concentrate contained in the supernatant was estimated by protein assay after being centrifuged at 15,000 g for 1 h with BSA as a standard. DTT and IAA were used in proper sequence to unfold the disulfide bond sufficiently. The protein was precipitated by precipitating agent constituting of acetone, alcohol, and acetic acid, at −20°C for more than 12 h, and then centrifuged at 15,000 g at 4°C for 1 h. The precipitate was washed by acetone and 70% alcohol twice each. Protein was digested into small peptides for 20 h by trypsin for high‐performance liquid chromatography (HPLC) after lyophilization.
2D‐LC–MS/MS Analysis and Protein Identification
Chromatographic separation of peptide was performed by HPLC with a strong cation‐exchange column (SCX column, 0.32 × 100 mm,300A, 5 mm; Column Technology Inc., Fremont, CA, USA) followed by a reverse‐phase column (RP‐C18 Column, 0.32 × 100 mm, 300A, 5 mm; Column Technology Inc.). Samples were redissolved by buffer solution (citric acid/acetonitrile) at pH 2.5 and loaded on a SCX column, which was equilibrated with 0.1% formic acid in water and washed for 5 min with the same solvent at a flow rate of 100 μL/min. The pH gradient was adjusted from 2.5 to 8.0 by ammonia water. 10 components were obtained. After being washed, the SCX column was switched in‐line with the reverse‐phase analytical column, and bound peptides were eluted using solvents A (0.1% formic acid in water) and B (0.1% formic acid in acetonitrile) with a linear gradient of 2 μL/min, starting with 2% of solvent B. The peptides were eluted and introduced into a Finnigan linear ion trap (LTQ XL) hybrid mass spectrometer (Thermo Finnigan, CA, USA) by microspray. The capillary temperature was maintained at 170°C. Full MS spectra were recorded in the FT ICR cell or Orbitrap, and then, the tandem mass spectra of the 6 most intense ions were recorded by the LTQ ion trap at a collision energy of 35 eV, isolation width of 2.5 Da, and activation Q at 0.250 10.
The m/z of peptides and their fragments were obtained after every full scan. The statistics of MS/MS scan lies in the scale of m/z 400–1800. Proteins were identified by comparing all of the experimental peptide MS/MS spectra with the IPI HUMAN 3.68 database using BIOWORKS software (Thermo Scientific, IL, USA). Protein identifications were accepted if they could be established at >95% probability and contained at least 2 identified peptides.
Western Blot Analysis
The samples were homogenized in lysis buffer (Boster Biological Technology, Ltd., Wuhan, China) which contains 1 mM PMSF. The lysate was clarified by centrifugation at 14,000 g for 5 min at 4°C, the supernatant protein concentration was determined by Protein Assay Reagent Kit (Bio‐Rad). Electrophoresis was run on 12% SDS‐PAGE with 100 μg total protein loaded per lane. The proteins on SDS‐PAGE gels were transferred onto a 0.45‐μm polyvinylidene difluoride membrane (PVDF‐Immobilon P membrane; Millipore, Jaffrey, NH, USA). The membrane was washed with TBS containing 0.2% Tween‐20 (TBS‐T). Nonspecific binding was prevented by blocking the membrane with 5% of BSA in TBS‐T. The membranes were incubated with primary antibody for cofilin‐1 and PGK1 (Abcam Biotechnology Inc., Cambridge, MA, USA) diluted 1:1000 in TBS buffer containing 5% BSA. Then, the membranes were incubated by the secondary antibody combined with HRP (Boster Biological Technology, Ltd.) for cofilin‐1 and PGK1. The blots were developed using an enhanced chemiluminescence detection reagent (Super Signal West Pico; Thermo Scientific, Rockford, IL, USA) and exposed to X‐ray film. The β‐actin was used as an internal control.
Results
Identification of a Set of Proteins Associated with Radiosensitivity in Astrocytomas
Proteins were identified using a linear ion trap hybrid mass spectrometer. We initially identified 3612 proteins consistently present in all astrocytomas analyzed thus far. Only proteins identified by at least 2 unique peptides and also detected by more than 5 times were quantified. Nearly 1997 proteins were cut off because of inconformity with significant hits ≥5 and unique peptides ≥2. The quantitation ratio of a protein was determined by averaging the ratios of all peptides derived from the same protein, and the final ratio was derived from an average of repeated measurements. Moreover, the nonunique peptides with unusually high or low ratios were excluded in the quantitation.
Global normalization was used to eliminate error, and differentially expressed proteins between the radioresistant group and radiosensitive group were demonstrated by t‐test, 36 proteins were obtained, 21 proteins up‐regulated, and 15 down‐regulated. Among the conserved proteins, we had found metabolism‐related proteins, structural proteins, oncoproteins, and proteins involved in other cellular functions (Table S1).
Furthermore, with hierarchical cluster analysis used, proteome profiling patterns of glioma samples with distinct radiosensitivity were divided into 2 groups based on the branching patterns of the dendrogram. In the differential expression proteins, PGK1 and cofilin‐1 had a substantially higher quantitation ratio than others, and the sequence was identified many times (Table S1). This phenomenon not only displayed a high concentration of the 2 proteins in radioresistant astrocytomas, but also indicated they might be closely associated with glioma radioresponse.
Phosphoglycerate kinase 1, an ATP‐generating glycolytic enzyme that forms part of the glycolytic pathway, was identified by 18 unique peptides, and the representative is K.ACANPAAGSVILLENLR.F. The mass spectrogram showed a relative abundance of this peptide, which displayed a higher expression level in the radioresistant group (Figure 2).
Figure 2.
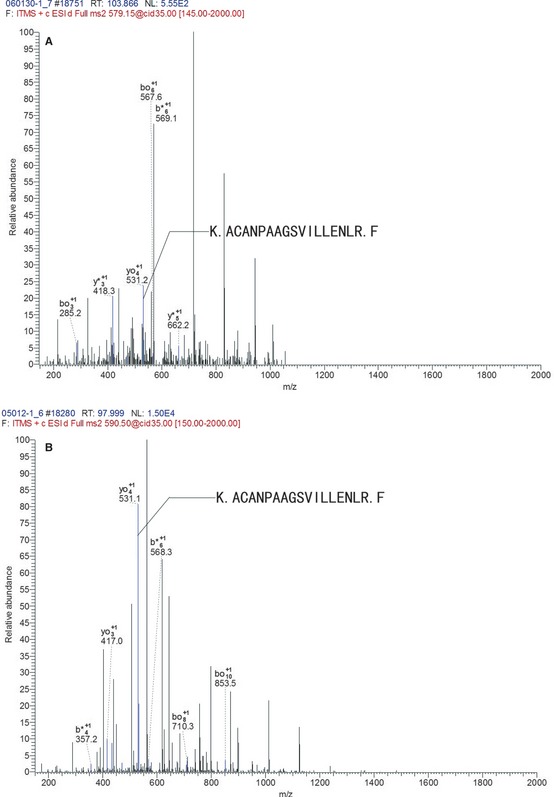
The mass spectrogram of the representative peptide of phosphoglycerate kinase 1 (PGK1). K.ACANPAAGSVILLENLR.F was the representative peptides of PGK1. The axis of abscissa is m/z, and the axis of ordinates is the relative abundance of peptide. The b+ and y+ illustrated the peptide chain was hydrolyzed at carboxyl terminal and amino terminal, respectively, and they were the basis for peptide identification. The m/z of peptide K.ACANPAAGSVILLENLR.F was 531. The blue lines represented matched m/z of peptide. The relative abundance of this peptide in radioresistant group (B) was significantly higher than in radiosensitive group (A).
The discriminatory protein, cofilin‐1, belongs to actin‐depolymerisation factor (ADF)/cofilin family. Cofilin‐1 was identified by 6 unique peptides with K.EILVGDVGQTVDDPYATFVK.M as the representative. The mass spectrogram showed a relative abundance of this peptide, which displayed a higher expression level in the radioresistant group (Figure 3).
Figure 3.
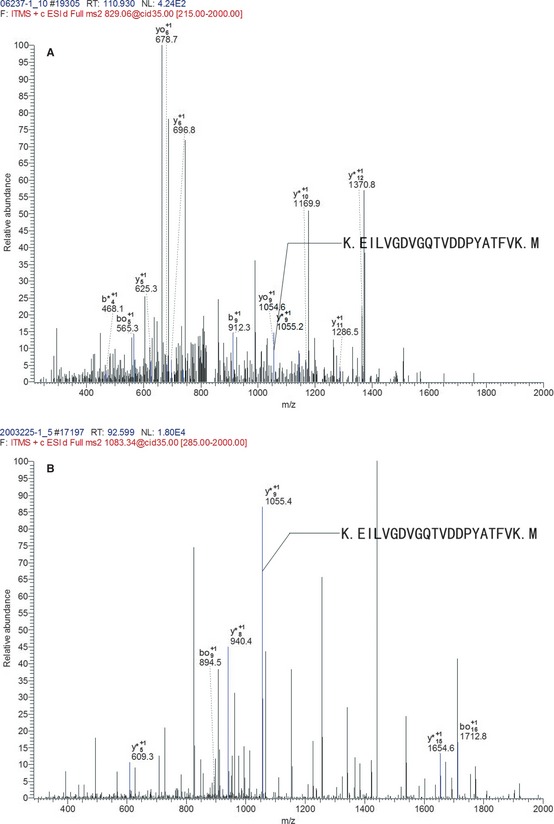
The mass spectrogram of the representative peptide of cofilin‐1. K.EILVGDVGQTVDDPYATFVK.M was the representative peptide of cofilin‐1. The axis of abscissa is m/z, and the axis of ordinates is the relative abundance of peptide. The b+ and y+ illustrated the peptide chain was hydrolyzed at carboxyl terminal and amino terminal, respectively, and they were the basis for peptide identification. The m/z of peptide K.EILVGDVGQTVDDPYATFVK.M was 1055. The blue lines displayed the matched m/z of peptide. The relative abundance of this peptide in radioresistant group (B) was significantly higher than in radiosensitive group (A).
Verification of Proteomic Results by Western Analyses
To verify the accuracy of our approach, we used Western blot to quantify the expression of cofilin‐1 and PGK1 in astrocytomas independently. The relative expression levels of these proteins were found to correlate closely with our proteomic analysis. Representative blots are shown in Figure 4. The P‐value < 0.05 was considered statistically significant.
Figure 4.
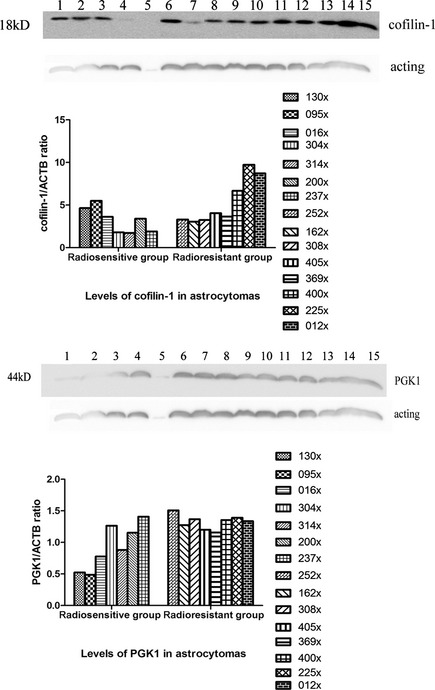
Western blot for detection of phospho‐glycerate kinase 1 (PGK1) and cofilin‐1 in radioresistant and radiosensitive astrocytomas. Western blot screening for the expression of PGK1 and cofilin‐1: 1–7: radiosensitive group; 8–15: radioresistant group; Bar graph shows the levels of PGK1 and cofilin‐1 in radioresistant astrocytomas were elevated above those of radiosensitive ones (P < 0.05). They were compared with expression of β‐actin. Patterns of Western blot analysis basically agree with the results of proteomics analysis.
Validated by Western blotting, we first examined the baseline expression patterns of cofilin‐1 and PGK1 in astrocytoma cells. The universal expression in radioresistant glioma cells implied that cofilin‐1 and PGK1 may play important roles in radioresponse of human gliomas.
Discussion
Although up to a century has passed since its inception 1, radiotherapy remains the most effective adjunct to surgery for patients with malignant gliomas and provides local control for the neoplasms. However, the prognosis of patients with astrocytomas is still poor because most patients still die of recurrence. Radioresistance is the major cause of treatment failure and results in unfavorable outcomes. Currently, the pathogenesis of radioresistance is poorly understood. It is therefore necessary to develop reliable indicators to evaluate the effect and prognosis of radiotherapy.
To identify candidate proteins potentially responsible for glioma radioresistance, proteomic technology, becoming increasingly automated, was used in our study. In this investigation, we analyzed the proteomic profile of astrocytomas with different radioresponses and identified proteins that may be involved in the radioresistant phenotype. PGK1 and cofilin‐1 were recognized as candidate radioresistant proteins. The 2 proteins, found in a number of malignant tumors, could also be rational targets for sensitization of the conventional anti‐glioma therapy.
Phosphoglycerate kinase 1 is a metabolism‐related enzyme over‐expressed in many malignancies and usually correlated with poor survival 11, 12, 13. It catalyzes the reversible conversion of 1,3, diphosphoglycerate to 3‐phosphoglycerate with the generation of 1 molecule of ATP in glycolysis. PGK1 has been detected at a high level in lung adenocarcinoma, gastric cancer, prostate cancer, and pancreatic tumor, but moderate in adjacent nontumor tissues 12, 13, 14, 15, 16. Aggressive lesions are found to be at a condition of hypermetabolism, reflected in metabolism‐related proteins at higher expression, and vice versa. Several proteins upregulated in radioresistant astrocytomas are implicated in glycolysis, mitochondrial respiratory chain, or other energy production process. Energy metabolism is closely related to increased tumorigenesis. The high rate of glycolysis was an essential tumor phenotype, and the tumorigenicity of the glycolytic enzyme‐deficient cells was severely diminished 13. The growth of a tumor could be repressed by restraining glycolytic enzyme activation, thus a potentially effective oncotherapy.
Over‐expression of PGK1 implied the increasing glycolysis in radioresistant astrocytomas was at the status of hypoxia. In a range of human tumor sites, the presence of hypoxia is a negative prognostic indicator for outcome following radiotherapy 17, 18, 19. Reportedly, the pretreatment tumor oxygenation status is prognostic of loco‐regional tumor control after primary radiation alone in advanced head and neck squamous cell carcinoma 20. The samples in our study were obtained before any adjunctive therapy. These pretreatment gliomas were supposed to be hypermetabolic and hypoxic, and the radioresistance was inherence of astrocytomas.
Phosphoglycerate kinase 1 has been reported to be involved in many pathophysiological mechanisms. It could induce a multidrug‐resistant (MDR) phenotype through an MDR‐1‐independent mechanism 21. Several studies show PGK1 could affect DNA replication and repair in cell nuclei and have linked its expression to tumor biology 22, 23, 24.
The metabolic alteration results in cell physiological changes correlating with biological features of malignant lesion. It has been reported that cofilin‐actin rod (bundles of cofilin‐saturated filaments) occurs when cells are energetically stressed 25. Glycolysis is a way to get energy quickly but releases less ATP. Abnormal levels of cofilin follow the release of chronophin from an inhibitory ATP–HSP90–chronophin complex when ATP drops 26. As an essential factor of actin dynamics, cofilin plays crucial roles in the actin‐based motility of cell.
Cofilin enhances the dynamics of filament remodeled by severing actin filaments. Cofilin‐1 is a predominant isoform in nonmuscle tissues such as brain and hepar 27, 28, 29. Several studies have disclosed that cofilin is gathering at the leading edge such as lamellipodia and ruffling membranes of moving cells, and it could set the direction of cell motility 30, 31, 32, 33. Activity of cofilin leads to actin filament turnover and, therefore, increases the rate of cell locomotion.
Motility of tumor cell is vital to invasive potential of malignancy. Cofilin is shown to be significantly higher in more invasive gastrointestinal endocrine cell tumors 34. High expression of cofilin has been reported in lots of tumors, including carcinomas from the liver, kidney, and oral squamous cell 35. Analysis by Nishimura demonstrated that cofilin‐1 expression was a significant predictor of progression‐free survival of patients with advanced epithelial ovarian cancer receiving standard therapy 36. Cofilin‐1 is known to be overexpressed in highly invasive C6 glioma cells 37.
As the functional node in cell biology, cofilin is modulated by almost any perturbation or fluctuation of cell physiology, and it has the potential to correct or dampen those fluctuations in turn 26, 38. The dysregulation of cofilin interaction with actin was suggested to underlie the immune deficiency prevalent in cancer 38. It has been reported that radiation‐induced DNA unwinding is influenced by cofilin 39. Over‐expression of cofilin‐1, causing cytoskeleton disruption, reduces glucocorticoid function through upregulation of c‐Jun 40. Cofilin‐1 would influence the development and maintenance of malignant diseases in various mechanisms. Radioresistance of astrocytomas could be influenced by several mechanisms promoted by cofilin, such as tumor cell motility enhancement and cellular homeostasis imbalance.
Though cofilin is closely correlated with cytoskeletal structure, the pathological sections of astrocytomas in this study had demonstrated no remarkable gross morphological change (whether tumor cell or their size) in radioresistant astrocytomas with over‐expression of cofilin. As a coincidence, Yap and coworkers showed there was no obvious difference in the morphology of U373 cell between wild‐type cells and those of which had been transfected to overexpress cofilin 33. Lack of significant character changes makes it harder to prognose the outcome of patients through classical histopathological examination alone. The expression level of cofilin‐1 not only influences glioma invasiveness 35, but also correlates with radioresistance. It might be a better choice to prognose the radioresponse of astrocytomas with combined pathological examination and expression of cofilin‐1. In addition, cofilin‐1 is the predominant isoform in the brain, and therefore, it has tissue specificity in prognosing radioresistance of intracranial tumor.
Phosphoglycerate kinase 1 and cofilin‐1 are involved in many tumor pathophysiological processes and affect each other. They could cooperatively improve the malignance of gliomas. They have also been founded to be abnormally expressed in gliomas by other studies. Odreman and co‐workers' research demonstrated cofilin‐1 and PGK1 were biomarkers for tumor classification, because they were up‐regulated in high‐grade gliomas represented by glioblastoma multiforme 41. Considering all the samples in our investigation being astrocytomas of grade II, the protein expression could be more closely related to radiosensitivity. On another note, the over‐expression of cofilin‐1 and PGK1 in high‐grade gliomas might explain the wide radioresistance in glioblastoma multiforme. It is also supposed that cofilin‐1 and PGK1 might be the biomarkers for unfavorable prognosis of gliomas.
More objective and comprehensive understanding of malignancy is expected, and combinations of biomarkers have been valued increasingly. The application of multiple biomarkers is considered preferable for increasing the sensitivity and specificity of prognosis. To gain a better understanding of radioresponse of astrocytomas, PGK1 and cofilin‐1 might be detected in combination with pathological examination.
In conclusion, 2D‐LC–MS/MS provided an efficient system for elucidation of various biological characteristics of the gliomas. PGK1 and cofilin‐1 were detected in the present study as potential predictive indicators for radioresistance. They play important roles in cell physiology through various mechanisms. However, the further explorations are still needed, especially on the interactions of proteins in dynamic processes, which are essential for a complete and clear determination of their value and validity.
Conflict of Interest
The authors declare no conflict of interest.
Supporting information
Table S1. The up‐regulate proteins in radioresistant astrocytomas.
Acknowledgments
We would like to thank Rong Zeng for her help with mass spectrometry data analysis. This study was supported by grant NSFC81172390 from the National Science Foundation of China and grant ZKX10021 from the Health Bureau of Nanjing.
References
- 1. Mahaley MS, Mettlin C, Natarajan N, Laws ER, Peace BB. National survey of patterns of care for brain‐tumour patients. J Neurosurg 1989;71: 826–836. [DOI] [PubMed] [Google Scholar]
- 2. Bello L, Giussani C, Carrabba G, et al. Suppression of malignant glioma recurrence in a newly developed animal model by endogenous inhibitors. Clin Cancer Res 2002;8: 3539–3548. [PubMed] [Google Scholar]
- 3. Schwartz SA, Weil RJ, Thompson RC, et al. Proteomic‐based prognosis of brain tumor patients using direct‐tissue matrix‐assisted laser desorption ionization mass spectrometry. Cancer Res 2005;65: 7674–7681. [DOI] [PubMed] [Google Scholar]
- 4. Iwadate Y, Sakaida T, Hiwasa T, et al. Molecular classification and survival prediction in human gliomas based on proteome analysis. Cancer Res 2004;64: 2496–2501. [DOI] [PubMed] [Google Scholar]
- 5. Boudreau CR, Yang I, Liau LM. Gliomas: Advances in molecular analysis and characterization. Surg Neurol 2005;64: 286–294. [DOI] [PubMed] [Google Scholar]
- 6. Wilkins MR, Sanchez JC, Gooley AA, et al. Progress with proteome projects: Why all proteins expressed by a genome should be identified and how to do it. Biotechnol Genet Eng Rev 1996;13: 19–50. [DOI] [PubMed] [Google Scholar]
- 7. Whittle IR, Short DM, Deighton RF, Kerr LE, Smith C, McCulloch J. Proteomic analysis of gliomas. Br J Neurosurg 2007;21: 576–582. [DOI] [PubMed] [Google Scholar]
- 8. Chakravarti A, Delaney MA, Noll E, et al. Prognostic and pathologic significance of quantitative protein expression profiling in human gliomas. Clin Cancer Res 2001;7: 2387–2395. [PubMed] [Google Scholar]
- 9. Chumbalkar V, Sawaya R, Bogler O. Proteomics: The new frontier also for brain tumor research. Curr Probl Cancer 2008;32: 143–154. [DOI] [PubMed] [Google Scholar]
- 10. Hajkova D, Imanishi Y, Palamalai V, et al. Proteomic changes in the photoreceptor outer segment upon intense light exposure. J Proteom Res 2010;9: 1173–1181. [DOI] [PMC free article] [PubMed] [Google Scholar]
- 11. Hwang TL, Liang Y, Chien KY, Yu JS. Overexpression and elevated serum levels of phosphoglycerate kinase 1 in pancreatic ductal adenocarcinoma. Proteomics 2006;6: 2259–2272. [DOI] [PubMed] [Google Scholar]
- 12. Chen G, Gharib TG, Wang H, et al. Protein profiles associated with survival in lung adenocarcinoma. Proc Natl Acad Sci USA 2003;100: 13537–13542. [DOI] [PMC free article] [PubMed] [Google Scholar]
- 13. Fantin VR, St‐Pierre J, Leder P. Attenuation of LDH‐A expression uncovers a link between glycolysis, mitochondrial physiology, and tumor maintenance. Cancer Cell 2006;9: 425–434. [DOI] [PubMed] [Google Scholar]
- 14. Zieker D, Königsrainer I, Tritschler I, et al. Phosphoglycerate kinase 1 a promoting enzyme for peritoneal dissemination in gastric cancer. Int J Cancer 2010;126: 1513–1520. [DOI] [PMC free article] [PubMed] [Google Scholar]
- 15. Wang JH, Wang JC, Dai JL, et al. A Glycolytic mechanism regulating an angiogenic switch in prostate cancer. Cancer Res 2007;67: 149–159. [DOI] [PubMed] [Google Scholar]
- 16. Romanuik TL, Ueda T, Le N, et al. Novel biomarkers for prostate cancer including noncoding transcripts. Am J Pathol 2009;175: 2264–2276. [DOI] [PMC free article] [PubMed] [Google Scholar]
- 17. Brizel DM, Dodge RK, Clough RW, Dewhirst MW. Oxygenation of head and neck cancer: Changes during radiotherapy and impact on treatment outcome. Radiother Oncol 1999;53: 113–117. [DOI] [PubMed] [Google Scholar]
- 18. Fyles AW, Milosevic M, Wong R, et al. Oxygenation predicts radiation response and survival in patients with cervix cancer. Radiother Oncol 1998;48: 149–156. [DOI] [PubMed] [Google Scholar]
- 19. Knocke TH, Weitmann HD, Feldmann HJ, Selzer E, Potter R. Intratumoral pO2‐measurements as predictive assay in the treatment of carcinoma of the uterine cervix. Radiother Oncol 1999;53: 99–104. [DOI] [PubMed] [Google Scholar]
- 20. Nordsmarka M, Overgaard J. A confirmatory prognostic study on oxygenation status and loco‐regional control in advanced head and neck squamous cell carcinoma treated by radiation therapy. Radiother Oncol 2000;57: 39–43. [DOI] [PubMed] [Google Scholar]
- 21. Duan Z, Lamendola DE, Yusuf RZ, Penson RT, Preffer FI, Seiden MV. Overexpression of human phosphoglycerate kinase 1 (PGK1) induces a multidrug resistance phenotype. Anticancer Res 2002;22: 1933–1941. [PubMed] [Google Scholar]
- 22. Vishwanatha JK, Jindal HK, Davis RG. The role of primer recognition proteins in DNA replication: Association with nuclear matrix in HeLa cells. J Cell Sci 1992;101: 25–34. [DOI] [PubMed] [Google Scholar]
- 23. Popanda O, Fox G, Thielman HW. Modulation of DNA polymerases alpha, delta and epsilon by lactate dehydrogenase and 3‐phosphoglycerate kinase. Biochim Biophys Acta 1998;1397: 102–117. [DOI] [PubMed] [Google Scholar]
- 24. Ronai Z. Glycolytic enzymes as DNA binding proteins. Int J Biochem 1993;25: 1073–1076. [DOI] [PubMed] [Google Scholar]
- 25. Bernstein BW, Bamburg JR. ADF/Cofilin: A functional node in cell biology. Trends Cell Biol 2010;20: 187–195. [DOI] [PMC free article] [PubMed] [Google Scholar]
- 26. Huang TY, Minamide LS, Bamburg JR, Bokoch GM. Chronophin mediates an ATP‐sensing mechanism for cofilin dephosphorylation and neuronal cofilin–actin rod formation. Dev Cell 2008;15: 691–703. [DOI] [PMC free article] [PubMed] [Google Scholar]
- 27. Pavlov D, Muhlrad A, Cooper J, Wear M, Reisler E. Actin Filament Severing by Cofilin. J Mol Biol 2007;365: 1350–1358. [DOI] [PMC free article] [PubMed] [Google Scholar]
- 28. Hotulainen P, Paunola E, Vartiainen MK, Lappalainen P. Actin‐depolymerizing factor and cofilin‐1 play overlapping roles in promoting rapid F‐Actin depolymerization in mammalian nonmuscle cells. Mol Biol Cell 2005;16: 649–664. [DOI] [PMC free article] [PubMed] [Google Scholar]
- 29. Vartiainen MK, Mustonen T, Mattila PK, et al. The three mouse actin‐depolymerizing factor/cofilins evolved to fulfill cell‐type‐specific requirements for actin dynamics. Mol Biol Cell 2002;13: 183–194. [DOI] [PMC free article] [PubMed] [Google Scholar]
- 30. Ghosh M, Song X, Mouneimne G, Sidani M, Lawrence DS, Condeelis JS. Cofilin promotes actin polymerization and defines the direction of cell motility. Science 2004;304: 743–746. [DOI] [PubMed] [Google Scholar]
- 31. Chan AY, Bailly M, Zebda N, Segall JE, Condeelis JS. Role of cofilin in epidermal growth factor‐stimulated actin polymerization and lamellipod protrusion. J Cell Biol 2000;148: 531–542. [DOI] [PMC free article] [PubMed] [Google Scholar]
- 32. Kuhn TB, Meberg PJ, Brown MD, et al. Regulating actin dynamics in neuronal growth cones by ADF/cofilin and rho family GTPases. J Neurobiol 2000;44: 126–144. [PubMed] [Google Scholar]
- 33. Yap CT, Simpson TI, Pratt T, et al. The motility of glioblastoma tumour cells is modulated by intracellular cofilin expression in a concentration‐dependent manner. Cell Motil Cytoskeleton 2005;60: 153–165. [DOI] [PubMed] [Google Scholar]
- 34. Yana B, Yapb CT, Wanga S, et al. Cofilin immunolabelling correlates with depth of invasion in gastrointestinal endocrine cell tumors. Acta Histochem 2010;112: 101–106. [DOI] [PubMed] [Google Scholar]
- 35. Kaczarek E, Zapf S, Bouterfa H, et al. Dissecting glioma invasion: Interrelation of adhesion, migration and intercellular contacts determine the invasive phenotype. Int J Dev Neurosci 1999;17: 625–641. [DOI] [PubMed] [Google Scholar]
- 36. Nishimura S, Tsuda H, Kataoka F, et al. Overexpression of cofilin 1 can predict progression‐free survival in patients with epithelial ovarian cancer receiving standard therapy. Hum Pathol 2011;42: 516–521. [DOI] [PubMed] [Google Scholar]
- 37. Gunersen JM, Spirkoska V, Smith PE, et al. Growth and migration markers of rat C6 glioma cells identified by serial analysis of gene expression. Glia 2000;32: 146–154. [PubMed] [Google Scholar]
- 38. Klemke M, Wabnitz GH, Funke F, et al. Oxidation of cofilin mediates T cell hyporesponsiveness under oxidative stress conditions. Immunity 2008;29: 404–413. [DOI] [PubMed] [Google Scholar]
- 39. Olive PL, MacPhail SH. Radiation‐induced DNA unwinding is influenced by cell shape and trypsin. Radiat Res 1992;130: 241–248. [PubMed] [Google Scholar]
- 40. Minamide LS, Striegl AM, Boyle JA, et al. Neurodegenerative stimuli induce persistent ADF/cofilin–actin rods that disrupt distal neurite function. Nat Cell Biol 2000;2: 628–636. [DOI] [PubMed] [Google Scholar]
- 41. Odreman F, Vindigni M, Gonzales ML, et al. Proteomic studies on low‐ and high‐grade human brain astrocytomas. J Proteome Res 2005;4: 698–708. [DOI] [PubMed] [Google Scholar]
Associated Data
This section collects any data citations, data availability statements, or supplementary materials included in this article.
Supplementary Materials
Table S1. The up‐regulate proteins in radioresistant astrocytomas.