SUMMARY
Aims: To investigate the mechanism behind cytotoxic edema formation following subarachnoid hemorrhage (SAH). Methods: We explored the role of aquaporin‐4 (AQP4), inwardly rectifying K+ 4.1 (Kir4.1) channels and their upstream orchestrators p53 and p38MAPK in this process. A p53 inhibitor, pifithrin‐α (PFT‐α) was administered intraperitoneally to rats undergoing SAH by endovascular perforation. Totally, 98 male SD rats were categorized into sham, SAH, SAH+ dimethyl sulfoxide (DMSO), SAH+ 0.2 or 2.0 mg/kg PFT‐α groups. At 24 h after SAH, MRI (diffusion‐weighted imaging [DWI]), immunohistochemistry, and Western blot were used. Results: MRI (DWI) showed a significant cytotoxic edema in the brain following SAH with PFT‐α therapy reducing it. Immunohistochemistry and Western blot showed an increased level of p53, phosphorylated‐p38MAPK and AQP4 and a reduced level of Kir4.1; all of which could be reversed following PFT‐α treatment. Treble labeling staining revealed colocalization of p53 with phosphorylated‐p38MAPK and unmatched expression of AQP4 and Kir4.1 within astrocyte cells. Conclusion: These results indicated p53 mediates the formation of cytotoxic edema in the brain following SAH; an uncoupling expression of AQP4 and Kir4.1 on astrocytic end feets orchestrated by p38MAPK was partly responsible.
Keywords: Astrocyte, Cytotoxic edema, p53, Rat, Subarachnoid hemorrhage
Introduction
Brain edema formation following subarachnoid hemorrhage (SAH) is a major cause of neurological deterioration and death in SAH patients [1]. In the past two decades, much emphasis has been placed on vasogenic edema that leads to accumulation of water in the brain following SAH [2, 3]. However, another important type of edema, cytotoxic edema has rarely been reported after SAH [4]. Although cytotoxic edema does not increase the net volume of water in the brain as does vasogenic edema, the swelling of glial cells and neurons can lead to their functional damage, which can alter neuronal excitability owing to the local disturbance of extracellular fluid and ion homeostasis, which is a major cause of neurological deterioration and complication in SAH patients. Hence, it becomes essential to explore the potential mechanism of cytotoxic edema in the brain following SAH.
Inwardly rectifying potassium channel 4.1 (Kir4.1) is a subset of potassium selective ion channels that are found in various cell types, including macrophages, astrocytes, and endothelial cells. Kir4.1 is normally located in the astrocyte end feet processes facing the blood vessels [5] where they generate a bidirectional movement of potassium ions [6, 7, 8]. In essence, this establishes an osmotic gradient that enables Kir4.1 to passively drive the movement of water through specific aquaporin protein channels, specifically aquaporin‐4 (AQP4). The imbalance in expression of this macromolecular complex (AQP4 and Kir4.1) can lead to their functional uncoupling that cause a local disturbance in potassium ions and water homeostasis, which consequently precipitates the development of cellular edema in the astrocytes [1, 9, 10]. This is important because not only are astrocytes the most abundant cell type in the brain, moreover, their swelling has been documented following various brain injuries including SAH, hypoxia–ischemia and traumatic brain injuries [11].
Accordingly, in this study, we investigated the role of Kir4.1 and AQP4 channels following SAH. Specifically, we hypothesized that the uncoupling expression of Kir4.1 and AQP4 channels could possibly be involved in the development of cerebral cytotoxic edema after SAH. Furthermore, we also hypothesized that this process could be modulated by p53 via p38 mitogen‐activated protein kinase (p38MAPK) pathway. We applied magnetic resonance imaging (MRI) examination and electron microscopy, the two most effective methods currently used in vivo, to detect the alteration of cytotoxic edema in the rat brain following SAH.
Material and Methods
The protocol was evaluated and approved by the Association of Medical Ethics of Peking University Health Science Center in Beijing, China.
Animals
Male Sprague‐Dawley rats (weight 300–350 g) were housed in a 12‐h light/dark cycle at a controlled temperature and humidity with free access to food and water. Totally, 139 rats were used in this study, after excluding mortality, 98 rats were divided into the following five groups: sham (n = 18), SAH (n = 21), SAH+ dimethyl sulfoxide (DMSO; n = 20), SAH treated with low‐dose pifithrin‐α (PFT‐α, 0.2 mg/kg; n = 20), and SAH treated with a high‐dose PFT‐α (2.0 mg/kg; n = 19).
SAH Rat Model
The endovascular perforation rat SAH model was used in this experiment, similar to what was previously described [12, 13]. In brief, rats were anesthetized with 4% isoflurane in a mixture of 60% medical air and 40% oxygen and then kept under anesthesia with 2% isoflurane. Subjects were then placed in the supine position on a heated operating table with body temperature maintained around 37 ± 0.5°C. The right external carotid artery was isolated and a 3–0 monofilament nylon suture was inserted through the internal carotid artery to perforate the junction of the middle and anterior cerebral artery to mimic an SAH model. SAH was confirmed at autopsy in each rat. Sham‐operated rats underwent the same procedure except that the suture was immediately withdrawn after the resistance was felt.
SAH Severity
The severity of SAH was blindly evaluated at each sacrifice as previously described [14]. The basal brain was divided into six segments, and each segment was allotted a grade from 0 to 3 depending on the amount of blood. The animals received a total score ranging from 0 to 18 by summing up the scores. In our study, we chose to work only with severe grade SAH rats (scores ranging from 14 to 18).
Drug Administration
PFT‐α, a small lipophilic compound p53 inhibitor, was purchased from BIOMOL Inc. (Plymouth meeting, PA, USA). It had been shown to have a higher permeability at the blood‐brain barrier (BBB). Following SAH injury, two doses of PFT‐α (0.2 and 2.0 mg/kg) were diluted in 1% DMSO to a final volume of 2 mL and administered by intraperitoneal injections immediately after SAH.
Neurobehavioral Deficits
Neurological outcomes were assessed by a blinded observer at 6 h and 24 h post‐SAH using the Modified Garcia Score [15], which is an 18‐point sensorimotor assessment system consisting of six tests with scores of 0–3 for each test (max score = 18). These six tests included: (1) spontaneous activity; (2) side stroking; (3) vibrissa touch; (4) limb symmetry; (5) climbing; (6) forelimb walking.
Diffusion‐Weighted Imaging (DWI)
MRI was performed using the protocols similar to those reported previously [16]. Because the brain underwent global ischemia following SAH and the hippocampus was sensitive to ischemia and edema injury, we chose the bilateral hippocampi as the region of interesting (ROI) with the aid of the stereotaxic maps of rat brain [17]. At 24 h after SAH, the anesthetized animals each group were placed supinely in a plastic half‐pipe frame, later introduced into an experimental 3.0‐Tesla MRI animal scanner (Magnetom Trio with TIM system; Siemens, Erlangen, Germany).
Baseline scanning with three‐dimensional (3D) pilot scans was performed to allow for accurate orientation of subsequent scans, and then the central voxel for DWI of a predefinitioned dimension was positioned. The conventional T1‐ and T2‐weighted spin echo imagings were applied. Then, the three‐dimensional reversed fast imaging with steady‐state precession (FISP) (3D‐PSIF) with diffusion‐weighted sequence was performed. Parameters were as follows: TR/TEeff= 15.30 ms/6.22 ms; flip angle = 30°; matrix size = 192 × 192, field of view = 80 × 80 mm, bandwidth = 130Hz, without fat suppression, effective spatial resolution = 0.5 × 0.5 × 0.5 mm, diffusion moment = 50 mT/m (*) ms, number of acquisitions = 1, acquisition time = 1 min, b factor = 100 s/mm2. The postprocessing techniques such as maximum intensity projection (MIP), thin slice MIP and multiplanar reformation were made to generate images of bilateral hippocampi by using the standard reformation software and an image workstation with graphic prescription.
All images were obtained by two independently experienced radiologists, the established standard of ROI in the hippocampus was extremely consistent. The apparent diffusion coefficient (ADC) value, a measure of water mobility, will be reduced in cytotoxic edema because of expansion of cell volume with encroachment upon and increased tortuosity of the extracellular space (ECS) [18]. ADC maps were calculated by using a linear two‐point fit. The ROIs were then overlaid onto corresponding ADC maps and the mean, standard deviation, number of pixels, and area for each ROI was extracted. The average ADC values of bilateral hippocampi were compared among each group.
Electronic Microscopy
The hippocampus of the sham, SAH and SAH + PFT‐α 2.0 mg/kg group rats were fixed in 3% glutaraldehyde for 24 h, then stained with 2% osmium tetroxide for 1 h, and dehydrated in graded alcohols. Tissues were then embedded in plastic. Semithin sections were examined and representative areas containing cerebral capillary were selected. Thin sections were made from these blocks and stained with uranyl acetate/lead citrate. The sections were placed on copper grids and imaged using a JEOL JEM‐100S electron microscope (n = 6 in each group).
Histology and Immunohistochemistry
Animals were sacrificed with deep anesthesia and perfused through the left ventricles with ice‐cold 0.1 mol/L PBS followed by 4% paraformaldehyde (pH 7.4). Brains were postfixed in the same fixative overnight. Following fixation, brains were embedded in paraffin and the coronal sections of 10 μm thick were cut (n = 6, 8, 7, 7, 6 in sham, SAH, SAH + DMSO, SAH + PFT‐α (0.2 mg/kg), and SAH + PFT‐α (2.0 mg/kg) groups, respectively).
For hematoxylin and eosin staining, the coronal brain sections were stained using hematoxylin (5 min) and eosin (2.5 min) and dehydrated in ethanol, cleared in xylenes, and then observed under a light microscope (Olympus BX51, Olympus, Tokyo, Japan).
Immunohistochemical staining was conducted as previously described [19]. In brief, five series of sections were used for the following primary polyclonal antibodies: (1) mouse anti‐phosphorylated‐p38MAPK (Cell signaling Technology, Boston, MA, USA); (2) goat anti‐p53; (3) rabbit anti‐glial fibrillary acidic protein (GFAP); (4) mouse anti‐AQP4; (5) goat anti‐Kir4.1 (Santa Cruz Biotechnology, Santa Cruz, CA, USA). Sections were treated with a different species ABC Kit (Santa Cruz Inc.). Peroxidase activity was revealed by dipping the sections for 5 min in a mixture containing 3‐diaminobenzidine and H2O2 at room temperature. The sections were dehydrated and cover slipped. Application of control serum, instead of the primary antibody, on another section of the same brain provided a negative control for each staining.
Fluorescence labeling was conducted as previously described [20]. Coronal brain sections were incubated overnight at 4°C by a primary antibody—goat anti‐p53, rabbit anti‐GFAP, goat anti‐Kir4.1, mouse anti‐AQP4 or mouse anti‐phosphorylated‐p38MAPK (1:200), respectively. Sections were then treated with secondary antibodies conjugated with fluorescent dyes—goat anti‐rabbit IgG (TRITC), goat antimouse IgG (TRITC), or donkey anti‐goat IgG (FITC) 1:200 (Santa Cruz Inc.) for 2 h. Then, the sections were treated with Hoeschst 33258 (15 min) or 1:200 rabbit anti‐mouse IgG‐AMCA (Jackson Immuno Research, West Grove, PA, USA) for 2 h. Sections were then cover slipped with 30% glycerin and observed under fluorescent microscope operating with a digital camera (Olympus BX51). FITC, TRITC, and AMCA were excited at 488, 557, and 450 nm, respectively. Digitalized microphotographs of immunofluorescent sections were saved. Merged images were generated by the Image Pro‐Plus software (Olympus, Tokyo, Japan).
Western Blot
Western blot analysis was performed as previously described [21]. The bilateral hippocampi were harvested under a microscope and homogenized. Equal amounts of protein samples (50 μg) were loaded on a Tris glycine gel, electrophoresed, and transferred to a nitrocellulose membrane. Membranes were blocked with a blocking solution, followed by incubation overnight at 4°C with polyclonal antibody for p53, phosphorylated‐p38MAPK, AQP4, and Kir4.1.Blot bands were detected with a chemiluminescence reagent kit (ECL Plus; Amersham Bioscience, Arlington Heights, IL, USA) and quantified by densitometry with Image J software (National Institutes of Health, Bethesda, MD, USA). The anti‐β‐actin antibody (1:1000, Santa Cruz Inc.) was blotted on the same membrane as a loading control (n = 6, 7, 7, 7, 7 in sham, SAH, SAH + DMSO, SAH + PFT‐α (0.2 mg/kg), and SAH + PFT‐α (2.0 mg/kg) groups, respectively).
Data Analysis
Statistical difference between two groups was analyzed using the t‐test. Multiple comparisons were statistically analyzed with one‐way analysis of variance (ANOVA) followed by Tukey multiple comparison post hoc analysis or Student–Newman–Keuls test on ranks. A P value of less than 0.05 was considered statistically significant.
Results
Inhibition of p53 Reduced Mortality and Neurobehavioral Deficits Following SAH
Rat mortality rate at 24 h after SAH is shown in Figure 1(A). There was a significant difference between the SAH (40.00%), SAH + DMSO (42.86%), and SAH + PFT‐α (2.0 mg/kg) groups (17.39%) (P < 0.05). However, no significant difference was observed between SAH, SAH + DMSO, and SAH + PFT‐α (0.2 mg/kg) groups (28.57%). In addition, the mortality of the PFT‐α (2.0 mg/kg) group was lower than that of PFT‐α (0.2 mg/kg) group (P < 0.05).
Figure 1.
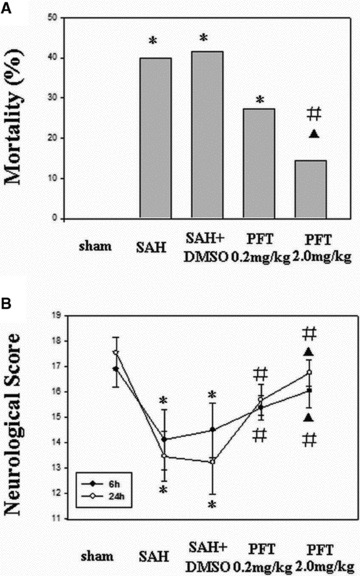
Effect of PFT‐α on mortality and neurobehavioral score after SAH. (A) The mortality of SAH and SAH + DMSO group were 40.00% and 42.86%, respectively; PFT‐α (2.0 mg/kg) had a stronger reducing effect on mortality than did PFT‐α (0.2 mg/kg; 17.39% vs. 28.57%). (B) Following SAH, all animals developed neurobehavioral deficits, which were significantly improved following PFT‐α therapy at 6 h and 24 h. *P < 0.05 versus sham group; #P < 0.05 versus SAH and SAH + DMSO group; ▴P < 0.05 versus PFT‐α (0.2 mg/kg) group.
The mean neurobehavioral scores are shown in Figure 1(B). No neurobehavioral deficit was observed in the sham‐operated rats. However, it was notable in the SAH and SAH + DMSO groups. Treatment with PFT‐α (both 2.0 and 0.2 mg/kg) significantly reversed the neurobehavioral deficits at 6 and 24 h following SAH (P < 0.05). Neurobehavioral score of the PFT‐α (2.0 mg/kg) group was higher than that of the PFT‐α (0.2 mg/kg) group (P < 0.05).
Inhibition of p53 Alleviated the Cytotoxic Edema following SAH (MRI, DWI)
The signal intensity of DWI images in the bilateral hippocampi was increased in the SAH and SAH + DMSO groups, which indicated the presence of cytotoxic edema in the hippocampus. Treatment with PFT‐α (both 0.2 and 2.0 mg/kg) decreased the signal intensity in the hippocampus (Figure 2B1–B5). The average ADC values of the bilateral hippocampi were markedly decreased in the SAH and SAH + DMSO groups (P < 0.05), which could be restored by PFT‐α treatment (P < 0.05; Figure 2C).
Figure 2.
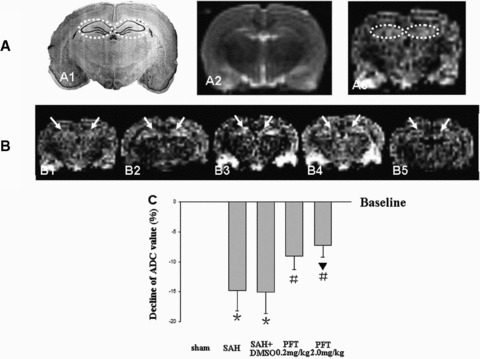
DWI and ADC value analysis. Figure A1 was a typical schematic figure of the rat hippocampus (interaural, 5.86 mm; Bregma, –3.14 mm; dotted circles). A2 and A3, same section level as A1, were the example images of T2WI and DWI in the sham rat to exclude the additional injury (Figure A2) and determine the bilateral hippocampi as the ROI (Figure A3, dotted circles). The DWI signal intensity of ROI was increased following SAH, which indicated that there was significant cytotoxic edema in the hippocampus (Figure B1–B3). The treatment with PFT‐α could markedly decrease the signal intensity (Figures B4 and B5). The average ADC value of ROI was markedly decreased following SAH compared with that of the sham group (baseline), which also indicated the development of cytotoxic edema. PFT‐α (2.0 mg/kg) showed more efficiency than 0.2 mg/kg dose on restoring the ADC values of the bilateral hippocampi (Figure C). The “arrows” in Figure B showed the bilateral hippocampus (ROI). In Figure C, *P < 0.05 versus sham group; #P < 0.05 versus SAH and SAH + DMSO groups; ▴P < 0.05 versus PFT‐α (0.2 mg/kg) group.
Inhibition of p53 Improved the Ultrastructure Alterations of Astrocytic End Feet after SAH
In the sham group, the mitochondria located at the astrocytic end feet had no significant morphological changes with the crests remaining intact .The distribution pattern of the organelles was comparatively compact and orderly (Figures 3A and A1 ). However, following SAH, the volume of the end feet around the microvessel was markedly increased, the wall of the microvessel was compressed by the swelling end feet. In addition, the organelles of the astrocyte were loosely distributed (Figure 3B). Specifically, the mitochondrial volumes were significantly extended with crest arrangements scattered irregularly (Figure 3B1 ). After PFT‐α (2.0 mg/kg) treatment, although the organelles of the astrocyte end feet were still loosely distributed, the volumes of the end feet and mitochondria were significantly decreased compared with those of SAH group (Figures 3C and C1 ).
Figure 3.
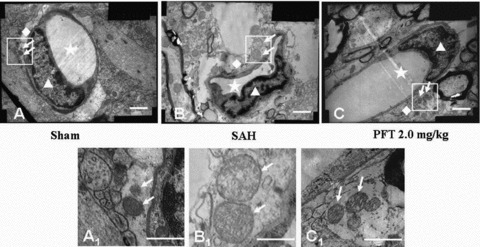
The ultrastructural alterations of the astrocyte end feet. The Figures A1, B1, and C1 were the magnification of the square area in Figures A, B, and C. In the sham group, the distribution of organelles was comparatively compact and the crests of the mitochondria in the astrocyte end feet were intact and orderly (Figures A and A1). Following SAH, the volume of the end feet was increased, the wall of the microvessel was compressed by the swelling end feet. The organelles in the end feet were distributed loosely and lost the regular morphology. The volume of mitochondria was significantly increased and the arrangement of the mitochondria crests was irregular, even broken down (Figures B and B1). After PFT‐α (2.0 mg/kg) treatment, although the organelles of the end feet were still loosely distributed, the volumes of the end feet and mitochondria were significantly decreased compared with those of SAH group (Figures C and C1). Scale bars = 1 μm in A, B, C; scale bars = 0.5 μm in A1, B1, C1. The “stars” indicated the lumens of microvessels; the “triangles” showed the endothelial cells; the “rhombuses” indicated the end feet of astrocytes terminated on the microvessel walls; the “arrows” showed the mitochondria in the end feet.
Increased Level of GFAP, p53, and Phosphorylated‐p38MAPK in the Astrocytes after SAH
Four sections were stained and two sections were assessed blindly for one protein expression per animal. In Figure 4, H&E staining failed to reveal any morphological alteration among the five groups (A1 to E1). The expressions of GFAP, p53, and phosphorylated‐p38MAPK in the astrocytes around the microvasculatures in the SAH, SAH + DMSO were significantly elevated (A2 to C4); PFT‐α treatment at the 2.0 mg/kg dose showed more efficiency than the 0.2 mg/kg dose on attenuating p53 and p38MAPK immunohistochemical staining (D3 to E4), and PFT‐α 0.2 mg/kg did not significantly decrease the level of phoshorylated‐p38MAPK. However, the expression of GFAP after SAH could not be attenuated by both doses of PFT‐α (D2 and E2). The expression of AQP4 and Kir4.1 were found along the blood vessel walls, which indicated they were both distributed on the end feet of astrocytes (A5 to E6). The level of AQP4 was significantly increased in the SAH and SAH + DMSO groups (A5 to C5) whereas PFT‐α treatment could attenuate the AQP4 expression (D5 and E5). The level of Kir4.1 protein was markedly decreased in the SAH and SAH + DMSO groups (A6 to C6), whereas PFT‐α could recover the expression of Kir4.1 (D6 and E6). In general, 2.0 mg/kg PFT‐α dose had more power than the 0.2 mg/kg dose on restoring the normal levels of AQP4 and Kir4.1 proteins (D5 and E5; D6 and E6).
Figure 4.
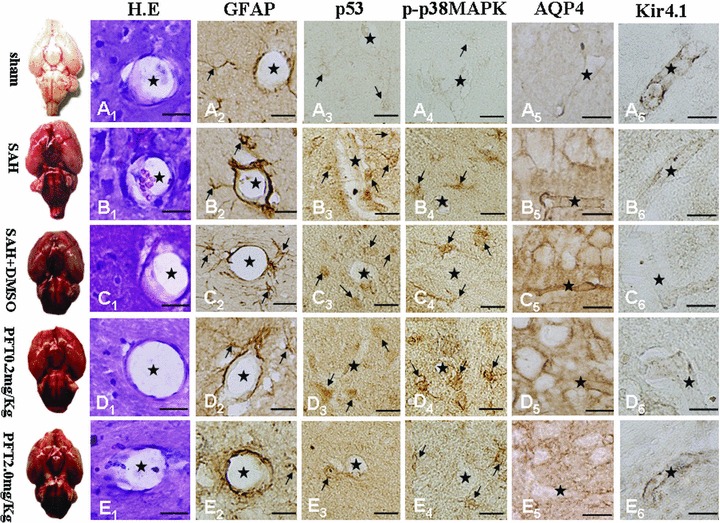
Immunohistochemical images of hippocampal microvasculature. H.E staining failed to demonstrate morphological changes among the five groups (Figure A1–E1). Expressions of GFAP, p53, and phosphorylated‐p38MAPK within the astrocytes lining the microvessels following SAH were significantly increased (Figure A2–D4); PFT‐α (2.0 mg/kg) attenuated the p53 and phosphorylated‐p38MAPK staining intensity more than PFT‐α (0.2 mg/kg) therapy (Figure D3–E4). Expression of GFAP could not be altered by PFT‐α (Figures D2 and E2). Expressions of both AQP4 and Kir4.1 were predominantly found on the blood vessel walls (Figure A5–E6). AQP4 levels were significantly increased (Figures B5 and C5) whereas Kir4.1 protein showed a marked decline (Figures B6 and C6) in the SAH and SAH + DMSO groups, which could be reversed by PFT‐α therapy (Figure D5–E6). Scale bars = 20μm. “Stars” indicated microvessels; “arrows” showed the astrocytes.
Uncoupling Expression of Kir4.1 and AQP4 Induced by p53 via Phosphorylated‐p38MAPK on the End Feet of Astrocytes after SAH
To observe the distribution pattern of AQP4 and Kir4.1 under physiological circumstance, we performed the GFAP, AQP4 and Hoechst 33258 (Figure 5A1–A4) and Kir4.1, GFAP and Hoechst 33258 (Figure 5B1–B4) and Kir4.1, AQP4 and Hoechst 33258 (Figure 5C1–C4) treble fluorescence labeling by using the slices of the sham‐operated animals. The results showed that both AQP4 and Kir4.1 were mainly distributed on the end feet of the astrocytes and along the walls of the microvessels (Figures 5A4, B4 and C4).
Figure 5.
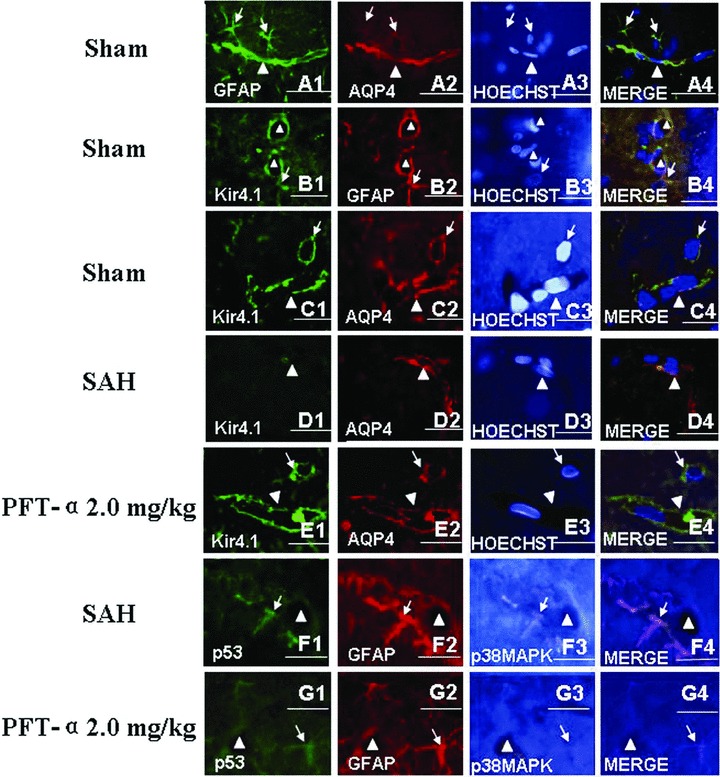
Treble immunofluorescence staining of the microvessels in rat hippocampus. In the sham‐operated animals, the treble fluorescence labeling of GFAP, AQP4 and Hoechst 33258 (for nuclear) (Figure A1–A4) and Kir4.1, GFAP and Hoechst 33258 (Figure B1–B4) and Kir4.1, AQP4 and Hoechst 33258 (Figure C1–C4) showed that both AQP4 and Kir4.1 were mainly distributed on the end feet of astrocytes and along the walls of the microvessels. Following SAH, the expression level of Kir4.1 was markedly declined and whereas AQP4 was elevated, which indicated that there was uncoupling expression between Kir4.1 and AQP4 in the astrocytes end feet (Figure D1–D4). In addition, activated p53 and phosphorylated‐p38MAPK were colocalized in the astrocytes whose end feet terminated on the wall of the microvessls (Figure F1–F4). Both tendencies in figures D, F after SAH could be reversed by PFT‐α 2.0 mg/kg treatment (Figures E and G). Scale bars = 40 μm in Figures C and E, scale bars = 20 μm in other figures. “Triangles” indicated microvessels; “arrows” showed the astrocytes.
However, following SAH, we found that the expression of Kir4.1 was significantly decreased (Figure 5D1) and the level of AQP4 was elevated (Figure 5D2). The AQP4 protein was dominantly distributed on the wall of the microvessls and the Kir4.1 protein was rare (Figure 5D4). In Figure 3F1–F4 , we observed that, following SAH, the activated p53 and phosphorylated‐p38MAPK proteins were colocalized in the astrocytes whose end feets were terminated on the wall of the abutting microvessls. Both tendencies after SAH in Figures D, F could be reversed by PFT‐α 2.0 mg/kg treatment (Figures E and G).
Differential Expression of AQP4 and Kir4.1 Channel Proteins Induced by p53 via Phosphorylated‐ p38MAPK in the Hippocampi after SAH
Western blot analysis showed a strong increment of p53 (Figure 6A), phosphorylated‐p38MAPK (Figure 6B), and AQP4 (Figure 6C) in the hippocampus of SAH and SAH + DMSO groups (P < 0.01), which could be significantly reduced by PFT‐α therapy (Figure 6A–C). However, a marked reduction of Kir4.1 protein was observed in SAH and SAH + DMSO groups (P < 0.01), which was significantly recovered following PFT‐α treatment (P < 0.05; Figure 6D).
Figure 6.
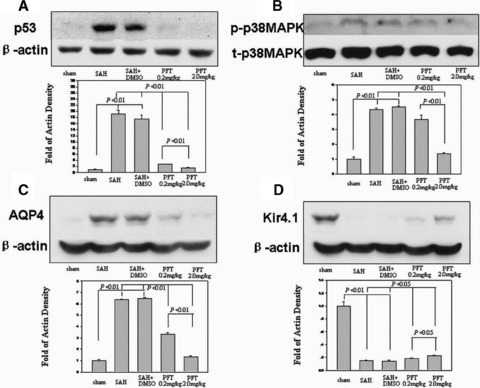
Western blot analysis. Increases in p53, phosphorylated‐p38MAPK, and AQP4 were detected in the hippocampus at 24 h following SAH injury; this could be reduced following PFT‐α treatment (Figure A–C). However, a marked reduction of Kir4.1 protein was observed in the SAH and SAH + DMSO groups, which was reversed following PFT‐α therapy (Figure D). In Figure B, “p‐p38MAPK” indicated the phosphorylated‐p38MAPK; “t‐p38MAPK” indicated the total‐p38MAPK.
Discussion
In our previous works, we had shown that p53‐induced endothelial cell apoptosis involved in BBB disruption and thus vasogenic edema formation [22]. In this study, we further investigated the potential role of p53 in the development of cytotoxic edema following SAH. With the help of a p53 inhibitor, PFT‐α, we demonstrated a marked reduction in cytotoxic edema accumulation in the brain and showed that uncoupling expression of AQP4 and Kir4.1 proteins within astrocytes was partly responsible for this process. These findings suggested that therapeutic interventions targeting the p53 system might be a novel strategy to prevent cytotoxic edema formation and thus reduce the structural and functional damage of the brain following SAH.
Cytotoxic Edema following SAH
In this study, the bilateral hippocampi were examined as representative anatomic structures because of their sensitivity to global and diffuse ischemia after SAH [23, 24]. We found a markedly decreased ADC values in the bilateral hippocampi at 24 h following SAH, which indicated there was in fact significant cytotoxic edema. Interestingly, we observed a reverse in ADC values and attenuated severity of cytotoxic edema after inhibiting p53 by using PFT‐α.
In addition, after SAH, the ultrastructure alterations indicated the presence of cytotoxic edema within astrocytic end feet were also observed, which could be recovered by using PFT‐α.
The Roles of AQP4 and Kir4.1 in Astrocytic Cytotoxic Edema
Astrocyte swelling is believed to be a key component of cytotoxic brain edema in a variety of diseases [25, 26]. At the neuron–astrocyte interface, the normal route for the constitutive water and potassium ion efflux from neurons is through the uptake by glial cells and then release into the blood or cerebrospinal fluid via their perivascular or subpial end feet. The successful performance of this process is dependent on, at least partly, the two molecular channels on the astrocyte membrane, AQP4 and Kir4.1.
In this study, the specific swelling of the pericapillary astrocyte processes was observed after SAH (Figure 3), as reported by others [27]. In addition, we found the level of AQP4 was significantly increased whereas Kir4.1 was decreased at 24 h (Figures 4 and 6). Based on these results, we inferred the mechanism of cytotoxic edema after SAH as follows. After SAH, even Kir4.1 channels were impaired, the neuronally released K+ ions could still be siphoned into astrocytes via some other inwardly rectifying K+ channels, for example, Kir2.1, a major kind of potassium ion uptake channels [28]. However, they could not be easily released back into ECS owing to injured Kir4.1 channel. Therefore, because of an accumulation of K+ in the astrocytes, the osmolarity of blood plasma and ECS was decreased compared to the glial cytoplasm, which in turn, passively drove water from the blood and ECS into the astrocytes through hyperfunctional AQP4 channels. This suggested that both protein channels played a significant role in cytotoxic edema formation.
p38MAPK and its Role in Regulation of AQP4 and Kir4.1
As a member of the mitogen‐activated protein kinase (MAPK) family, p38MAPK can regulate various extracellular signals, such as cell survival, growth, differentiation, and cell death [29, 30]. It has also been implicated in various inflammatory and apoptotic processes including transient global ischemia [31, 32] and focal cerebral ischemia [33]. However, the role of p38MAPK in regulating water homeostasis in the brain, specifically through regulation of AQP4 and Kir4.1, has not been explored in depth.
In this study, we found that with an increase in phosphorylated‐p38MAPK at 24 h after SAH, the expression of AQP4 was significantly elevated whereas Kir4.1 was decreased (Figures 4 and 6). These results suggested that following SAH injury, the activated p38MAPK could induce the expression of AQP4 but suppress the Kir4.1 in the end feet of astrocytes. This was somewhat similar to what was previously shown with regard to the relationship between p38MAPK and AQP4. In 2010, Rao et al. reported that inhibition of p38MAPK could effectively block the manganese‐induced increase in AQP4 protein content and swelling in astrocytes [34]. Furthermore, Hillaire et al. reported increased AQP4 expression through activation of the p38MAPK pathway [35].
In addition, we also found that inhibition of p53 significantly decreased the level of phosphorylated‐p38MAPK (Figures 4 and 6). Classically, it has been suggested that phosphorylated‐p38MAPK acts as an upstream regulator of p53 via the Ras protein [36, 37]. In this study, we found the activity of p38MAPK was dependent on p53 proteins in the hippocampal astrocytes. This data suggested that activated p53 in the astrocytes after SAH could regulate the expression of AQP4 and Kir4.1 through p38MAPK pathway and induce the development of cytotoxic edema.
The effect of PFT‐α on the expression of p53 target gene is still controversial. Although inhibiting the expression of p53 target gene is a widely holding concept [38, 39, 40], various caveats have been recently raised. For example, Walton et al. reported that some p53‐dependent genes were shown to be unaffected by PFT‐α[41]. Therefore, it seems that the effect of PFT‐α on the expression of p53 target gene depends on the species, cell type, injury mechanism, and experiment (in vitro or in vivo).
In conclusion, our findings suggested that activated p53 mediated the formation of cytotoxic edema in the brain following SAH; and that a functional uncoupling of AQP4 and Kir4.1 on the astrocytic end feets orchestrated by p38MAPKwas partly responsible. Inhibition of p53 by PFT‐α could restore the normal balance of AQP4 and Kir4.1 and reduce the severity of cellular edema and preserve the structional and functional integrity of the brain. Thus, studies targeting the p53 pathway may provide an alternative treatment to the brain injury following SAH.
Financial Support
This work was partially supported by the National Natural Science Foundation of China (30901548 and 30971527).
Conflict of Interest
The author has no conflicts of interest to declare.
Acknowledgments
We would like to also thank Dr. He Qingyuan for his excellent MRI support.
References
- 1. Papadopoulos MC, Verkman AS. Aquaporin‐4 and brain edema. Pediatr Nephrol 2007;22:778–784. [DOI] [PMC free article] [PubMed] [Google Scholar]
- 2. Park S, Yamaguchi M, Zhou C, Calvert JW, Tang J, Zhang JH. Neurovascular protection reduces early brain injury after subarachnoid hemorrhage. Stroke 2004;35:2412–2417. [DOI] [PubMed] [Google Scholar]
- 3. Sozen T, Tsuchiyama R, Hasegawa Y, et al Role of interleukin‐1beta in early brain injury after subarachnoid hemorrhage in mice. Stroke 2009;40:2519–2525. [DOI] [PMC free article] [PubMed] [Google Scholar]
- 4. Schubert GA, Poli S, Schilling L, Heiland S, Thomé C. Hypothermia reduces cytotoxic edema and metabolic alterations during the acute phase of massive SAH: A diffusion‐weighted imaging and spectroscopy study in rats. J Neurotrauma 2008;25:841–852. [DOI] [PubMed] [Google Scholar]
- 5. Hibino H, Fujita A, Iwai K, Yamada M, Kurachi Y. Differential assembly of inwardly rectifying K+ channel subunits, Kir4.1 and Kir5.1, in brain astrocytes. J Biol Chem 2004;79:44065–44073. [DOI] [PubMed] [Google Scholar]
- 6. Newman EA. Inward‐rectifying potassium channels in retinal glial (Müller) cells. J Neurosci 1993;13:3333–3345. [DOI] [PMC free article] [PubMed] [Google Scholar]
- 7. Pannicke T, Iandiev I, Uckermann O, et al A potassium channel‐linked mechanism of glial cell swelling in the postischemic retina. Mol Cell Neurosci 2004;26:493–502. [DOI] [PubMed] [Google Scholar]
- 8. Pannicke T, Uckermann O, Iandiev I, et al Altered membrane physiology in Müller glial cells after transient ischemia of the rat retina. Glia 2005;50:1–11. [DOI] [PubMed] [Google Scholar]
- 9. Manley GT, Fujimura M, Ma T, et al Aquaporin‐4 deletion in mice reduces brain edema after acute water intoxication and ischemic stroke. Nat Med 2000;6:159–163. [DOI] [PubMed] [Google Scholar]
- 10. Papadopoulos MC, Saadoun S, Davies DC, Bell BA. Emerging molecular mechanisms of brain tumour oedema. Br J Neurosurg 2001;15:101–108. [DOI] [PubMed] [Google Scholar]
- 11. Kimelberg HK. Astrocytic swelling in cerebral ischemia as a possible cause of injury and target for therapy. Glia 2005;50:389–397. [DOI] [PubMed] [Google Scholar]
- 12. Bederson JB, Germano IM, Guarino L. Cortical blood flow and cerebral perfusion pressure in a new noncraniotomy model of subarachnoid hemorrhage in the rat. Stroke 1995;26:1086–1091. [DOI] [PubMed] [Google Scholar]
- 13. Yan J, Chen C, Lei J, et al 2‐methoxyestradiol reduces cerebral vasospasm after 48 hours of experimental hemorrhage in rats. Exp Neurol 2006;202:348–356. [DOI] [PubMed] [Google Scholar]
- 14. Sugawara T, Ayer R, Jadhav V, Zhang JH. A new grading system evaluating bleeding scale in filament perforation subarachnoid hemorrhage rat model. J Neurosci Methods 2008;167:327–334. [DOI] [PMC free article] [PubMed] [Google Scholar]
- 15. Garcia JH, Wagner S, Liu KF, Hu XJ. Neurological deficit and extent of neuronal necrosis attributable to middle cerebral artery occlusion in rats. Statistical validation. Stroke 1995;26:627–634. [DOI] [PubMed] [Google Scholar]
- 16. Ashwal S, Tone B, Tian HR, Chong S, Obenaus A. Comparison of two neonatal ischemic injury models using magnetic resonance imaging. Pediatr Res 2007;61:9–14. [DOI] [PubMed] [Google Scholar]
- 17. Paxinos G, Watson C. The rat brain in stereotaxic coordinates. London : Academic Press, 1986. [DOI] [PubMed] [Google Scholar]
- 18. Rosenblum WI. Cytotoxic edema:monitoring its magnitude and contribution to brain swelling. J Neuropathol Exp Neurol 2007;66:771–778. [DOI] [PubMed] [Google Scholar]
- 19. Zhou C, Yamaguchi M, Kusaka G, Schonholz C, Nanda A, Zhang JH. Caspase inhibitors prevent endothelial apoptosis and cerebral vasospasm in dog model of experimental subarachnoid hemorrhage. J Cereb Blood Flow Metab 2004;24:419–431. [DOI] [PubMed] [Google Scholar]
- 20. Zhou C, Yamaguchi M, Colohan AR, Zhang JH. Role of p53 and apoptosis in cerebral vasospasm after experimental subarachnoid hemorrhage. J Cereb Blood Flow Metab 2005;25:572–582. [DOI] [PubMed] [Google Scholar]
- 21. Tang J, Liu J, Zhou C, et al Mmp‐9 deficiency enhances collagenase‐induced intracerebral hemorrhage and brain injury in mutant mice. J Cereb Blood Flow Metab 2004;24:1133–1145. [DOI] [PubMed] [Google Scholar]
- 22. Yan J, Chen C, Hu Q, et al The role of p53 in brain edema after 24 h of experimental subarachnoid hemorrhage in a rat model. Exp Neurol 2008;214:37–46. [DOI] [PubMed] [Google Scholar]
- 23. Back T, Hemmen T, Schuler OG. Lesion evolution in cerebral ischemia. J Neurol 2004;251:388–397. [DOI] [PubMed] [Google Scholar]
- 24. Gee CE, Benquet P, Raineteau O, Rietschin L, Kirbach SW, Gerber U. NMDA receptors and the differential ischemic vulnerability of hippocampal neurons. Eur J Neurosci 2006;23:2595–2603. [DOI] [PubMed] [Google Scholar]
- 25. Panickar KS, Jayakumar AR, Rao KV, Norenberg MD. Ammonia‐induced activation of p53 in cultured astrocytes: Role in cell swelling and glutamate uptake. Neurochem Int 2009;55:98–105. [DOI] [PubMed] [Google Scholar]
- 26. Blei AT. The pathophysiology of brain edema in acute liver failure. Neurochem Int 2005;47:71–77. [DOI] [PubMed] [Google Scholar]
- 27. Kimelberg HK. Current concepts of brain edema. Review of laboratory investigations. J Neurosurg 1995;83:1051–1059. [DOI] [PubMed] [Google Scholar]
- 28. Kang SJ, Cho SH, Park K, Yi J, Yoo SJ, Shin KS. Expression of Kir2.1 channels in astrocytes under pathophysiological conditions. Mol Cells 2008;25:124–130. [PubMed] [Google Scholar]
- 29. Marshall CJ. MAP kinase kinase kinase, MAP kinase kinase and MAP kinase. Curr Opin Genet Dev 1994;4:82–89. [DOI] [PubMed] [Google Scholar]
- 30. Davis RJ. The mitogen‐activated protein kinase signal transduction pathway. J Biol Chem 1993;268:14553–14556. [PubMed] [Google Scholar]
- 31. Sugino T, Nozaki K, Takagi Y, et al Activation of mitogen‐activated protein kinases after transient forebrain ischemia in gerbil hippocampus. J Neurosci 2000;20:4506–4514. [DOI] [PMC free article] [PubMed] [Google Scholar]
- 32. Walton KM, DiRocco R, Bartlett BA, et al Activation of p38 in microglia after ischemia. J Neurochem 1998;70:1764–1767. [DOI] [PubMed] [Google Scholar]
- 33. Irving EA, Barone FC, Reith AD, Hadingham SJ, Parsons AA. Differential activation of MAPK/ERK and p38/SAPK in neurons and glia following focal cerebral ischemia in the rat. Mol Brain Res 2000;77:65–75. [DOI] [PubMed] [Google Scholar]
- 34. Rao KV, Jayakumar AR, Reddy PV, Tong X, Curtis KM, Norenberg MD. Aquaporin‐4 in manganese‐treated cultured astrocytes. Glia 2010;58:1490–1499. [DOI] [PubMed] [Google Scholar]
- 35. St Hillaire C, Vargas D, Pardo CA, et al Aquaporin 4 is increased in association with human immunodeficiency virus dementia: Implications for disease pathogenesis. J Neurovirol 2005;11:535–543. [DOI] [PubMed] [Google Scholar]
- 36. Kishi H, Nakagawa K, Matsumoto M, et al Osmotic shock induces G1 arrest through p53 phosphorylation at Ser33 by activated p38MAPK without phosphorylation at Ser15 and Ser20. J Biol Chem 2001;276:39115–39122. [DOI] [PubMed] [Google Scholar]
- 37. Keller D, Zeng X, Li X, et al The p38MAPK inhibitor SB203580 alleviates ultraviolet‐induced phosphorylation at serine 389 but not serine 15 and activation of p53. Biochem Biophys Res Commun 1999;261:464–471. [DOI] [PubMed] [Google Scholar]
- 38. Luo Y, Kuo CC, Shen H, et al Delayed treatment with a p53 inhibitor enhances recovery in stroke brain. Ann Neurol 2009;65:520–530. [DOI] [PMC free article] [PubMed] [Google Scholar]
- 39. Leker RR, Aharonowiz M, Greig NH, et al The role of p53‐induced apoptosis in cerebral ischemia: Effects of the p53 inhibitor pifithrin alpha. Exp Neurol 2004;187:478–486. [DOI] [PubMed] [Google Scholar]
- 40. Niizuma K, Endo H, Nito C, et al Potential role of PUMA in delayed death of hippocampal CA1 neurons after transient global cerebral ischemia. Stroke 2009;40:618–625. [DOI] [PMC free article] [PubMed] [Google Scholar]
- 41. Walton MI, Wilson SC, Hardcastle IR, et al An evaluation of the ability of pifithrin‐alpha and ‐beta to inhibit p53 function in two wild‐type p53 human tumor cell lines. Mol Cancer Ther 2005;4:1369–1377. [DOI] [PubMed] [Google Scholar]


