Abstract
Medical device manufacturers using computational modeling to support their device designs have traditionally been guided by internally developed modeling best practices. A lack of consensus on the evidentiary bar for model validation has hindered broader acceptance, particularly in regulatory areas. This has motivated the US Food and Drug Administration and the American Society of Mechanical Engineers (ASME), in partnership with medical device companies and software providers, to develop a structured approach for establishing the credibility of computational models for a specific use. Charged with this mission, the ASME V&V 40 Subcommittee on Verification and Validation (V&V) in Computational Modeling of Medical Devices developed a risk-informed credibility assessment framework; the main tenet of the framework is that the credibility requirements of a computational model should be commensurate with the risk associated with model use. This article provides an overview of the ASME V&V 40 standard and an example of the framework applied to a generic centrifugal blood pump, emphasizing how experimental evidence from in vitro testing can support computational modeling for device evaluation. Two different contexts of use for the same model are presented, which illustrate how model risk impacts the requirements on the V&V activities and outcomes.
Keywords: computational fluid dynamics, model credibility, verification, validation, blood pumps
Background
The vision of the Center for Devices and Radiological Health (CDRH) at the Food and Drug Administration (FDA) is for U.S. patients to have first-in-the-world access to high quality, safe and effective medical devices, of public health importance. This requires stakeholders from across the regulatory science domain to work together to harness innovative technologies and methodologies that can enable the development of safer and more effective devices. Computational modeling continues to be a top regulatory science priority for CDRH1 for medical device evaluation. There is a broad range of computational disciplines used to investigate and support medical device designs, such as acoustics for therapeutic ultrasound, electromagnetism for magnetic resonance imaging simulation, fluid dynamics for flow characterization, heat transfer for ablation procedures, solid mechanics for fatigue assessment, and a host of statistical methods for clinical study evaluation. Morrison et al. has recently provided a comprehensive overview of regulatory science and review activities associated with computational modeling at CDRH,2 and previously provided a more detailed description of the uses of computational modeling for peripheral and vascular surgery medical devices.3
Moving beyond modeling for product development, CDRH is currently collaborating with the Medical Device Innovation Consortium (MDIC) and industry to develop and employ methodologies that can augment clinical studies with data from other sources, such as historical clinical data and even computer-based models in the form of virtual patients. The virtual-patient framework4,5 was piloted as a mock-submission for FDA’s review and approval, the details of which are available on the MDIC website.6 The concept is that “computer-based modeling can allow for much smaller clinical trials, such that some ‘clinical’ information comes from virtual patient simulations.7” The success of the virtual patient approach will rely on several key factors, but of utmost importance is the ability for industry to demonstrate adequate credibility such that computational models can be allowed to serve as “clinical” information.
The Oxford Dictionary8 defines credibility as the “quality of being trusted and believed in.” If the medical device community is going to rely on computational models to support regulatory decision-making, then it is vital to establish trust that the model outputs are sufficiently accurate and reliable for a given application. Trust is gained through the collection of evidence that supports the predictions provided by the model. Included in that evidence should be data from verification and validation (V&V) activities. However, the level of rigor of V&V activities needed to support a model is not clear at the outset, and thus guidance on this topic is critical for adoption. Therefore, the ASME V&V 40 Subcommittee on Verification and Validation in Computational Modeling for Medical Devices9 defines credibility as, “the trust, obtained through the collection of evidence, in the predictive capability of a computational model for a context of use (COU).” The COU is a statement that defines the specific role and scope of a computational model to inform a decision or to address a question. Currently, in FDA medical device submissions, computational models typically complement bench test data and rarely drive regulatory decision-making. To increase reliance on computational modeling evidence, practitioners need an approach to establish the evidentiary bar for different modeling applications, or COUs. Therefore, the ASME V&V 40 standard10 proposes a risk-based framework (henceforth referred to as the V&V40 framework) for establishing the credibility requirements of a computational model for a specific COU.
The main objectives of this article are to introduce the concepts of the ASME V&V 40 framework This is only true now, but not in 100 years when people are still reading this article. and to demonstrate the critical engineering judgment needed to apply that framework to different COUs for a computational model. A hypothetical example of a centrifugal blood pump that partially relies on the use of computational fluid dynamics (CFD) modeling11,12 to make hemolysis predictions to support the pump’s safety assessment is given to support these objectives.
Overview of the ASME V&V 40 Standard
The ASME V&V 40 standard presents a risk-informed credibility assessment framework to guide the development of credibility requirements for a computational modeling activity. The standard complements published V&V methodologies, such as the ASME standards for V&V for computational solid mechanics13,14and fluid dynamics and heat transfer,15 the NASA credibility assessment standard,16 and other relevant literature,17,18 by focusing on “how much” V&V is needed to support model credibility. The ASME V&V 40 standard contends that the level of evidence should be commensurate with the risk of using the computational model to inform a decision. Briefly, the steps for determining the evidentiary bar using the V&V 40 framework are:
Define the question of interest, which the computational model will play a role in addressing.
Define the COU, which is a detailed statement that defines the scope and specific role of the computational model in addressing the question of interest.
Assess the model risk, which is the possibility that the use of the computational model leads to a decision resulting in patient harm or other undesirable outcome(s). Model risk is defined as the combination of the influence of the computational model on the decision-making (model influence) and the consequence of an adverse outcome resulting from an incorrect decision based on the mode (decision consequence).
Establish goals for various elements of the V&V process, called credibility factors, shown in Table 1. Credibility goals are driven by the risk analysis. Details and discussion regarding the credibility factors are provided in Section 5.
Table 1.
The Credibility Factors as Presented in the ASME V&V 40 Standard
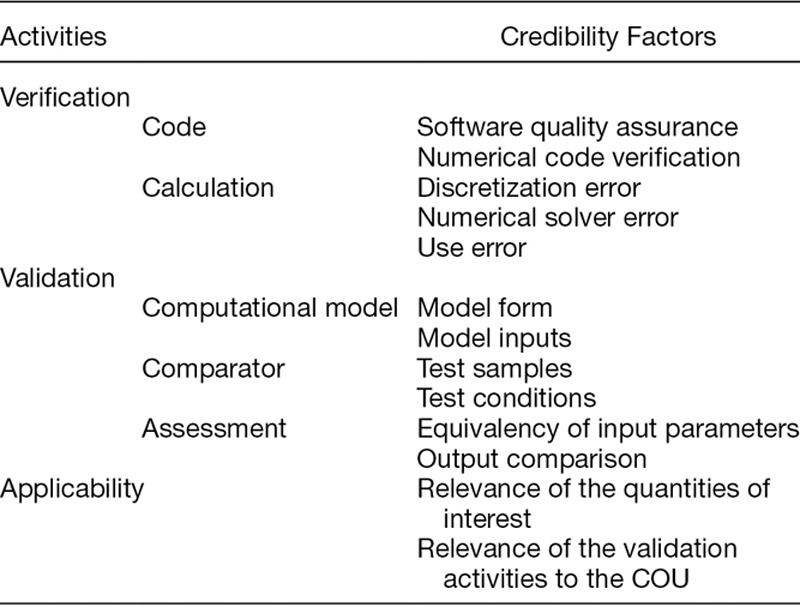
The remaining steps are to gather the V&V evidence and any other pertinent information that supports model credibility, such as historical evidence of the model’s predictive ability for other COUs,16 and to assess whether the credibility goals were met, i.e., that the model is sufficiently credible for the COU. This assessment is best performed with a team of people with adequate knowledge of the computational model, the available evidence that supports model credibility, and the requirements of the model for the COU. The final stage is to document the findings. Documentation should include the rationale supporting the credibility goals for applying the model in the proposed COU.
Centrifugal Blood Pump Example
A hypothetical example was developed to demonstrate the application of the V&V 40 framework to a medical device that is commonly evaluated using CFD. The framework is employed to determine the level of rigor needed to support using CFD to evaluate the hemolysis levels of a centrifugal blood pump. This example assesses model credibility requirements for two different COUs to demonstrate the importance of the COU in the credibility assessment.
Details provided in this section include: 1) a description of the pump geometry and operating conditions, 2) critical components of the V&V 40 framework used to establish credibility goals, 3) a description of the CFD models for predicting blood flow and hemolysis, 4) the two experimental comparators (particle image velocimetry and in vitro hemolysis testing), and 5) a discussion on translating the model risk into credibility goals.
It is important to note that the goal of this article is not to provide general approaches for CFD, hemolysis models, or experimental comparisons, but to demonstrate how to use engineering judgment and the V&V 40 framework to make decisions about what is needed to establish credibility. Therefore, specific recommendations about best practices for CFD and hemolysis modeling of blood pumps, experimental measurements, and acceptance criteria for model accuracy are out of scope.
Generic Centrifugal Blood Pump
The medical device in this hypothetical example is the FDA generic centrifugal blood pump,19 shown in Figure 1A. The intended pump flow rate ranges from 2.5 to 6 L per minute (lpm) and impeller rotation ranges from 2,500 to 3,500 revolutions per minute (rpm). For these operating conditions, the pressure increase achieved by the pump ranges from 50 mm Hg to 350 mm Hg.19 Although the pump was designed to provide the desired hydraulic performance (flow rate versus pressure rise) with clinically acceptable levels of hemolysis, this needs to be confirmed with additional analyses. During the product development phase, CFD simulations were performed over the pump’s intended operating range; shear stress calculations provided qualitative assessments of hemolysis, as shown in Figure 1B. Hemolysis, however, is not only a function of shear stress but also dependent on the local exposure time. Therefore, a quantitative assessment of hemolysis was performed based on the local shear stress and exposure time data derived from the velocity prediction of the CFD simulations.
Figure 1.

A: The geometry of centrifugal blood pump with arrows indicating the blood flow path—additional design details are provided in Malinauskas et al.19 B: Sample image of CFD results for the wall shear stress contours for a blood flow rate of 6 lpm and impeller rotation of 3,500 rpm. Note that the upper range of the scale was limited to 300 Pa to better highlight the high shear regions, which include the outer edges of the impeller blades, the regions behind the blades (downstream side of the blades, possibly due to flow separation off leading edge of blades), the cutwater, and the region entering the pump diffuser (as shown in red). C: A view of the finite volume mesh of the flow region within the pump housing, highlighting the presence of wall boundary layers.
Apply the ASME V&V 40 Framework
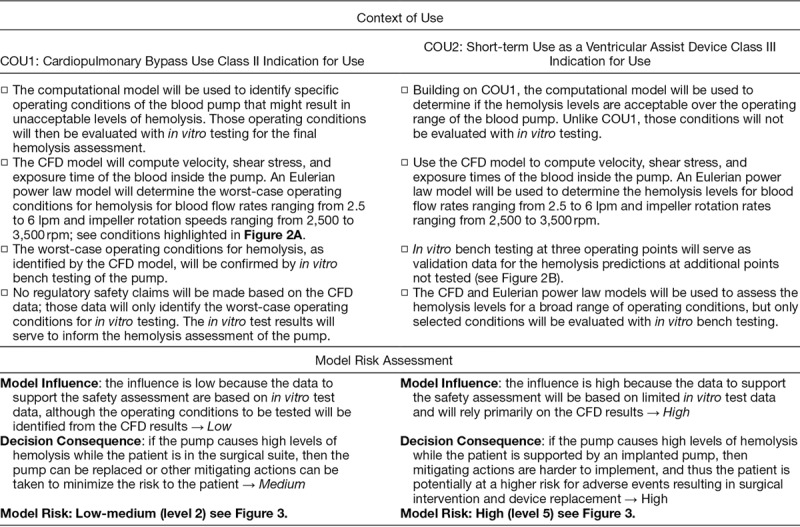
The question of interest addressed in this example is “Are the flow-induced hemolysis levels of the centrifugal pump acceptable for the intended use?” Two different COUs are considered for the blood pump based on the role of the computational model to assess the question of interest and the classification of the device: i) cardiopulmonary bypass (CPB) and ii) short-term use as a ventricular assist device (VAD). The COUs and the associated model-risk assessments are provided in Table 2 to facilitate a side-by-side comparison of these scenarios.
Table 2.
Comparison of the Model Risk Assessments for COU1 and COU2, to Address the Question of Interest: Are the Flow-Induced Hemolysis Levels of the Centrifugal Pump Acceptable for the Intended Use?
Computational Models
Blood flow model.
The pump geometry was generated using a commercial CAD software package (SolidWorks, Waltham, MA). A commercial CFD solver (ANSYS CFX v.15.0, ANSYS, Inc., Canonsburg, PA) was used to model blood flow through the pump. Nominal dimensions were used to create the CFD flow path from the CAD model. ANSYS meshing was used to obtain the finite volume representation of the pump internal flow path (see Figure 1C for the housing flow field). The velocity field and shear stresses inside the pump were obtained by solving the mass and momentum conservation equations. The SST k-ω model was used to model the turbulent nature of the fluid flow.20 Transient simulations were performed to capture the effect of impeller rotation on the fluid flow patterns and pressure generation. Blood was modeled using a constant density and viscosity (i.e., as a Newtonian fluid) to match the in vitro test conditions. The blood flow rate was prescribed at the pump inlet, an average static pressure of 0 Pa was applied at the pump outlet, and the walls were assumed no-slip. An Eulerian power-law hemolysis model (described in the next section) was incorporated into the CFD model to calculate the hemolysis index based upon an empirical expression that is a function of local shear stress and exposure time.
Power-law hemolysis model.
The power-law equation for the hemolysis index (HI) was developed from regression analysis of in vitro blood damage data collected in a constant shear Couette flow device,21 and is expressed as:
 |
where C,  ,
,  are constants obtained from curve fitting the hemolysis data,
  is the magnitude of the local shear stress, texp is the exposure time of blood cells to the local shear stress in the device,
  is the increase in plasma-free hemoglobin concentration, and
  is the blood hemoglobin concentration. An Eulerian form for the HI equation can be obtained by linearizing Equation 1 for t and introducing a new scalar variable HI’
 |
where  ,
,  and
and  is the velocity of the carrier fluid (blood). Note that the HI equation is sequentially coupled to the Navier-Stokes equation. The benefits of implementing the HI equation as a scalar variable have been outlined elsewhere.22
Role of the model for each COU.
As stated above, the blood flow and power-law hemolysis models were used to assess the hemolysis over a range of expected operating conditions for blood flow rate and impeller rotational speed. This section describes the prediction points and validation points for each COU, as depicted in Figure 2.
Figure 2.
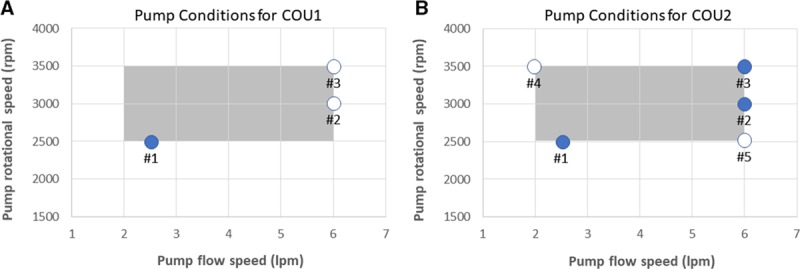
The pump condition maps for COU1 (A) and COU2 (B) that show the operating conditions for the pump—note the validation points (solid circles) and the select predictions points (open circles) for each COU. Disclaimer: data are only for illustrative purposes. The operating range of the pump encompass the grey box. The prediction points include the entire operating range of the pump. Only select prediction points are shown in the figure.
For COU1, the models were first used to assess the hemolysis levels at numerous operating points in the range from 2 lpm and 2,500 rpm to 6 lpm and 3,500 rpm, as shown by the grey box in Figure 2. A low flow/rotation condition 1 (2.5 lpm, 2,500 rpm) was selected as one validation point. Subsequently, the models were used to identify two potentially worst-case conditions for hemolysis, condition 2 (6 lpm, 3,000 rpm) and condition 3 (6 lpm and 3,500 rpm). The two conditions were then assessed via in vitro testing to ensure that worst-case hemolysis values remained within acceptable limits.
For COU2, the models were first validated at three operating points identified from COU1. Subsequently, the hemolysis levels at numerous conditions over the intended operating range from 2 lpm and 2,500 rpm to 6 lpm and 3,500 rpm were analyzed, including at condition 4 (2 lpm, 3,500 rpm) and condition 5 (6 lpm and 2,500 rpm), which are at the other extremes of the flow/rotation operating range. For both COUs (i.e., CPB use [COU1] and short-term VAD use [COU2]), the operating points were designed so that the device was able to pump against pressure heads ranging from 50 mm Hg to 350 mm Hg.19
Validation Comparators
Particle-image velocimetry experiments.
Particle-image velocimetry (PIV) experiments were conducted to obtain velocity data at multiple locations inside the pump using a Newtonian blood-analog fluid, which mimics the density and viscosity of blood. The PIV measurement system has been described elsewhere.19 The pressures at the pump inlet and exit were also measured for comparison to the blood in vitro hemolysis experiments and the CFD simulations. PIV experiments in the pump were repeated five times, after a previously established precedent.19
In vitro hemolysis experiments.
Experiments using the blood pump in a flow loop were conducted to measure hemolysis levels using porcine and human blood. Details about the hemolysis experiments are provided elsewhere.19,23
Acceptance criterion for hemolysis predictions.
For this example, the acceptance criterion for the question of interest was based on comparing the hemolysis levels of the subject device with previously cleared or approved devices (i.e., based on relative hemolysis). The definition for relative hemolysis (RH) is provided below:
 |
The goal (acceptance criterion) is to ensure that the RH value is below 1 for all pump operating conditions.
For COU1, the hemolysis levels for a commercially available predicate device for CPB were experimentally obtained and compared with the hemolysis levels of the subject device (i.e., the generic blood pump). For COU2, the acceptance criterion for the hemolysis levels was established by comparing the generic pump data to a commercial pump (class III device) known to cause low levels of hemolysis during use as a VAD.21 For simplicity, however, the same device was used in both comparisons.
Translate Model Risk into Credibility Goals
This section describes the selection of and rationale for credibility goals for a subset of the V&V 40 credibility factors; note that a complete assessment would require an evaluation of all credibility factors. Verification activities address whether the underlying mathematical model was solved correctly, which are the Navier-Stokes and HI equations in this example. Validation activities address whether the computational model is an appropriate representation of the reality of interest, which is the blood pump performance at selected operating conditions in this example. Additionally, the V&V 40 framework also identifies applicability as an important evaluation step, which assesses the relevance of the validation activities to the COU.
Tables 3 and 4 summarize the credibility factors being highlighted for this example. Associated with each credibility factor is an example list of activities presented at progressively increasing levels of rigor, where the goal for each credibility factor is dependent on the model risk. For example, a COU with higher risk would require a higher level of rigor, and thus a higher credibility goal, as compared to a COU with lower risk. Risk comparison levels are shown in Figure 3. For each COU, we present the proposed gradation of activities, the associated goal for each credibility factor, and a rationale that supports the selection of that goal. The assessment of each credibility factor and the overall credibility assessment of the model will be presented in the Results section. Note that definitions and descriptions of verification, validation, and applicability are provided in the footer of Table 4.
Table 3.
Goals and Rationale for Credibility Factors Associated with Verification*
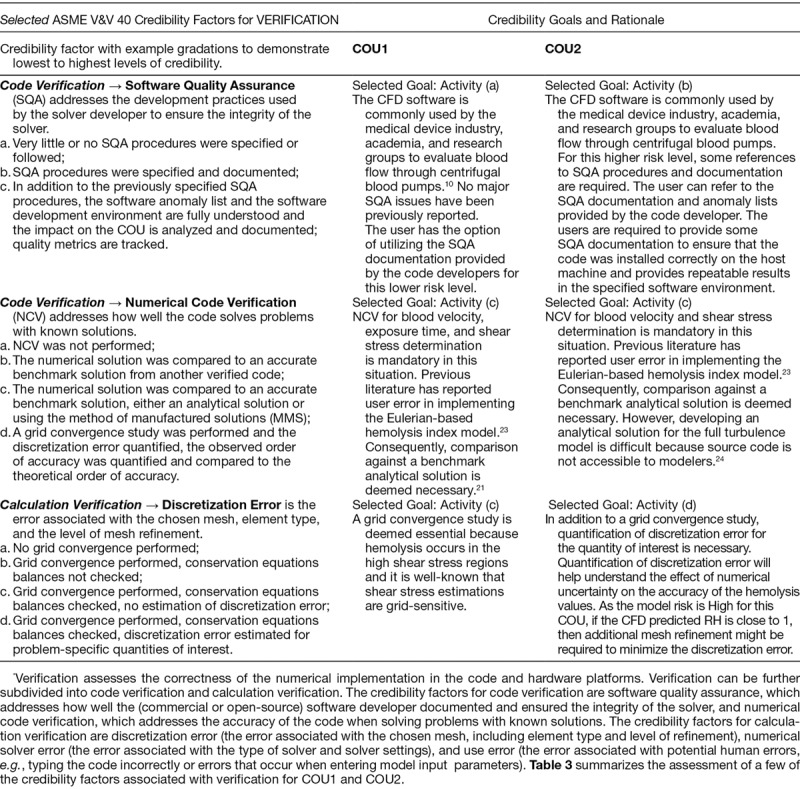
Table 4.
Goals and Rationale for Credibility Factors Associated with Validation and Applicability*
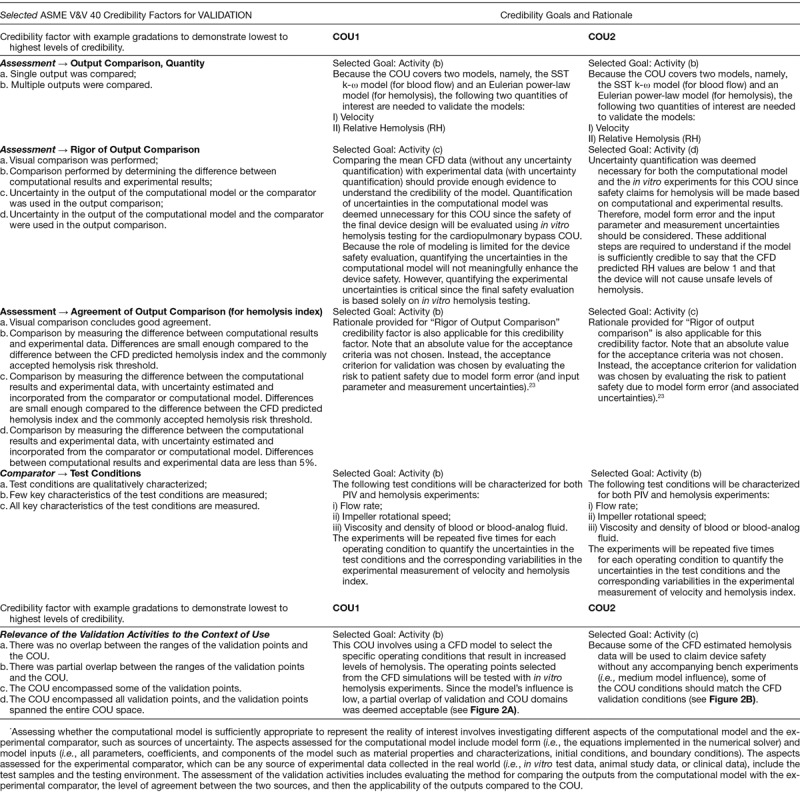
Figure 3.
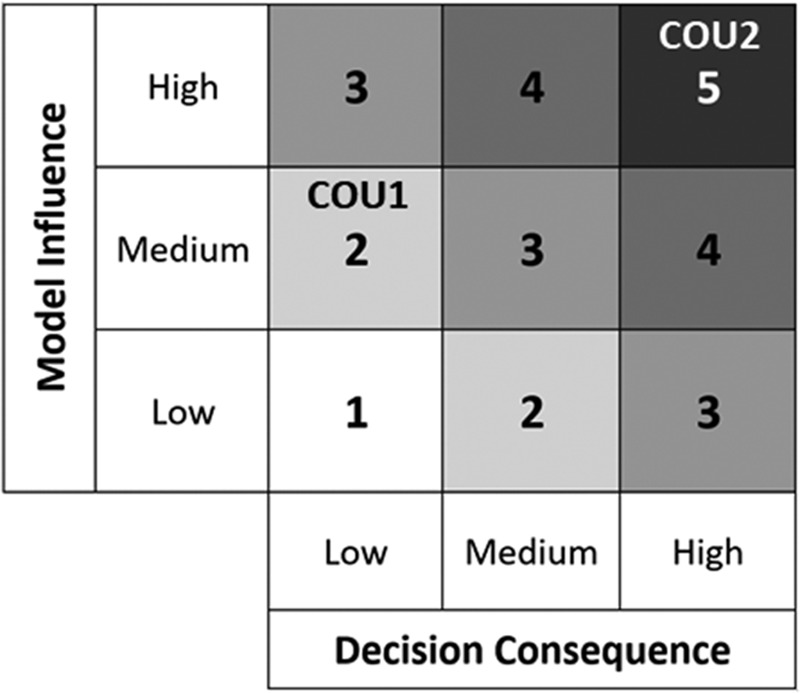
Model risk map indicating the risk for COU1 at a level 2 and COU2 at a level 5 based on our risk classification scheme.
Results
The last step in the risk-informed credibility assessment framework is to determine whether the computational model is credible for the COU. This is based on the totality of the information and evidence gathered during model development, from in vitro testing, and other V&V activities. The next two sections summarize how the selected credibility goals were achieved for each COU.
Credibility Assessment—COU1
Verification.
For code and calculation verification, all intended credibility goals listed in Table 3 were achieved. For numerical code verification, the Eulerian power-law model was compared with the verification benchmarks listed in Hariharan et al.22 For calculation verification, a grid convergence study was conducted using three different meshes and the results showed that the velocity and hemolysis index predictions changed by less than 1% as the mesh size was increased.
Validation.
For validation, all intended credibility goals listed in Table 4 were achieved.
Assessment → Output Comparison, Quantity
The targeted credibility goal was achieved by comparing the two quantities: velocity and RH.
Assessment → Rigor of Output Comparison
The targeted goal for this credibility factor was to quantify the uncertainty in the experimental measurements of velocity and HI and compare those findings with mean modeling results, which was achieved by repeating the tests five times for each operating condition and incorporating the method/instrument measurement uncertainty from their calibration or prior method validation studies. The results were then compared with the corresponding mean CFD data (a representative comparison is shown in Figure 4), and mean hemolysis data (shown in Figure 5).
Figure 4.
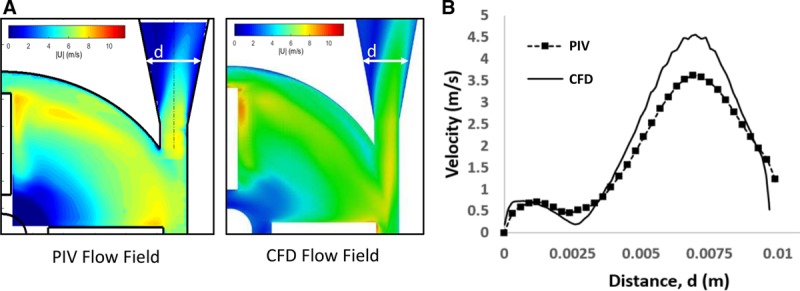
(A) Visual and (B) qualitative comparison of the velocity data from the PIV experiments and the CFD model. Data obtained from Malinauskas et al.19
Figure 5.
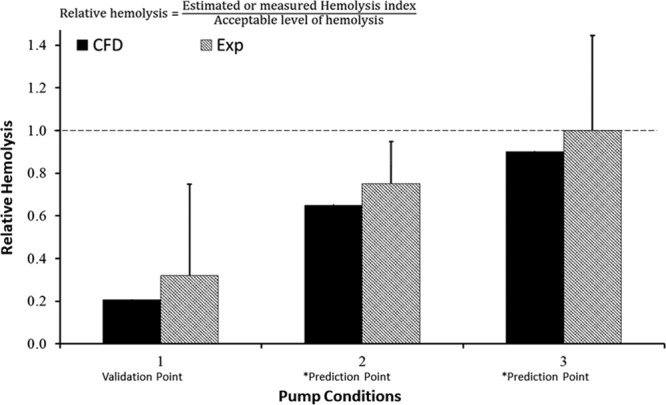
Hemolysis results for COU1 at the validation point and the two prediction points. As outlined in Figure 2A, the CFD results for pump conditions 2 and 3 are model predictions, as marked by the asterisk. The dashed line represents an RH of 1 based on a predicate comparison. Please note that the experimental and CFD data presented here are hypothetical and used only to demonstrate the credibility assessment process.
Assessment → Agreement of Output Comparison
Figure 4A presents the visual comparison between experimental and computational velocity contours for condition 1. A qualitative evaluation (Level (a) for “Rigor of Output Comparison”) shows that the velocity data match reasonably well between the two data sources: the regions of low and high flow are similar, the peak velocity magnitudes are comparable and occur near the blade-tip, and the exit fluid jet is asymmetrically skewed toward the outer wall of the pump. Figure 4B shows a comparison of the velocity profile at the exit diffuser region: the level of asymmetry was similar for both data sources and the peak CFD velocity matched the experimental data to within approximately 15% (Level (b) for “Rigor of Output Comparison”).
Figure 5 shows the comparison between the experimental and computational RH predictions. All hemolysis data are normalized with respect to the acceptable threshold level of hemolysis produced by the commercially available predicate blood pump. Therefore, a value of RH exceeding 1 indicates that the blood damage caused by the subject device exceeds the predicate device and thus may not be safe for patient use. For pump condition 1 (a low flow/speed validation point), the difference in RH between the mean computational model results and the experimental mean value for RH is approximately 40%. However, the CFD predicted RH value is fivefold lower than the established safety threshold for HI.25 Therefore, even after considering the error in the CFD model (approximately 40%) and the uncertainties in the hemolysis experiments, the model is sufficiently credible to show that the device does not cause higher levels of hemolysis at that validation flow condition (Level (c) for “Rigor of Output Comparison”).
Comparator →Test Conditions
The fluid viscosity and density were measured before every experiment using a rheometer and a densitometer, respectively. The flow rate was measured during the experiment using a calibrated ultrasound flow meter. A tachometer was used to measure the impeller rotational speed over the course of the experiments. Subsequently, the fluctuations in the flow rate, rotational speed, viscosity, and density during all experiments were quantified. By repeating the experiments five times and quantifying uncertainty in the test conditions of flow rate, impeller speed, and viscosity and density of the test fluids, the goal for the “validation comparator, test conditions” credibility factor was achieved.
Applicability.
Applicability is evaluated in terms of the relevance of the quantities of interest to the COU as well as the relevance of the validation activities.
Relevance of the Quantities of Interest
Hemolysis is a quantity of interest directly applicable to the question of interest. RH is a measure of the hemolysis relative to a reference value, which is an acceptable validation metric.
Relevance of the Validation Activities to the COU
App licability is assessed as the amount of “overlap” between the validation space and the COU conditions. The goal for this credibility factor only requires partial overlap between the validation point (condition 1) and the prediction points. To achieve this, the impeller rpm and flow rate for the validation point (condition 1) lie within the COU and the potential range of operation of the pump.
Apply the model to the COU.
After determining that the model was credible for the COU at the low flow/speed condition, additional CFD simulations were performed for impeller rotational speeds ranging from 2,500 to 3,500 rpm and flow rates ranging from 2.5 to 6 lpm. Results from the CFD study indicated that the relative hemolysis levels were close to or above the acceptance criteria for high flow/speed conditions 2 and 3. As per the COU, subsequent in vitro hemolysis testing was conducted at these operating conditions to evaluate HI.
Credibility Assessment—COU2
Verification.
All verification activities listed for COU1 are applicable for COU2. Supplementing code verification for this higher risk COU, the software quality assurance documents were requested from the software vendor and further evaluated to ensure that no known bugs were present in the software related to solving the SST k-ω turbulence model equations. For calculation verification, numerical uncertainty due to mesh discretization was estimated following the Richardson extrapolation approach.15 Taken together, these additional activities were sufficient to achieve the increased rigor required for COU2.
Validation.
Assessment, output comparison → quantity.
Mirroring COU1, two quantities were compared: velocity and hemolysis data.
Assessment → rigor of output comparison.
Both velocity and hemolysis experiments were repeated five times for each operating condition to quantify the uncertainty in the computational model outputs and experimental measurements. Uncertainty and fluctuations were quantified for the following input parameters of the PIV and hemolysis experiments: flow rate, impeller rotational speed, and viscosity and density of blood or blood-analog fluid. The flow rate was measured during the entire experiment using a calibrated ultrasound flow meter. The fluid viscosity and density were measured before every experiment using a rheometer and a densitometer, respectively. A tachometer was used to measure the pump speed over the course of the experiments. A Monte Carlo-based uncertainty quantification method15 was used to obtain a total uncertainty in velocity and hemolysis predictions due to uncertainties from multiple input parameters. Estimating the uncertainties for both CFD and experiments meets the appropriate level of rigor for this credibility factor.
Assessment → agreement of output comparison.
For velocity comparison, the validation discussion provided for COU1 is applicable for COU2.
Figure 6 shows the comparison between the experimental results and computational hemolysis predictions. Unlike COU1, there are three validation points for COU2. This was necessary because the model has a greater influence on the decision. The additional hemolysis experiments conducted for COU1 were used to support COU2 model validation.
Figure 6.
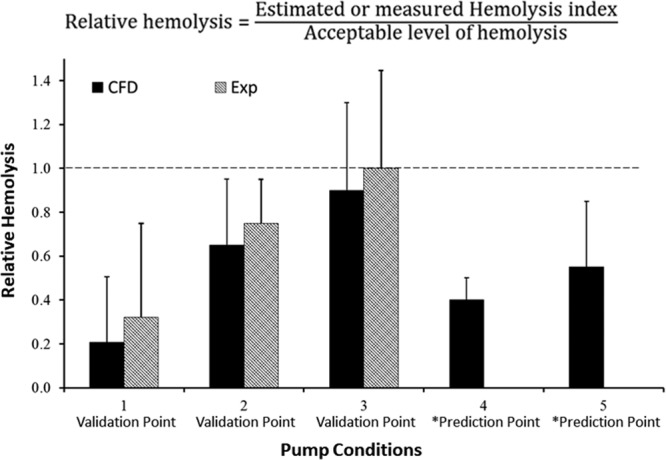
Hemolysis results for COU2 at the three validation points and the two prediction points, as marked by the asterisk. As outlined in Figure 2B, the CFD results for pump conditions 4 and 5 are model predictions. The dashed line represents the RH of 1, which is based on a comparison to an approved pump with adequate performance. Please note that the experimental and CFD data presented here are hypothetical and used only to demonstrate the credibility assessment process.
For condition 1, the conclusion drawn for COU1 is applicable to COU2. The main difference between the two COUs for the validation assessment is the estimation of uncertainties for the CFD output. For COU2, as stated in the credibility goal, the uncertainties in the CFD output were obtained in addition to the experimental uncertainties. For condition 1, the uncertainty in the CFD output does not change the interpretation of the results from COU1. Even when the CFD uncertainties are accounted for, the RH value is significantly lower than the potential level for hemolysis. However, for conditions 2 and 3, the inclusion of the numerical and input parameter uncertainties means that the RH value predicted by the CFD model could exceed 1 if all relevant uncertainties (i.e., CFD and experimental error bars) are considered. Therefore, the goal for “Agreement of Output Comparison” was not achieved and thus the model cannot be used to assess the potential hemolysis index for conditions 2 and 3.
Applicability.
Relevance of the quantities of interest.
Hemolysis is a quantity of interest directly applicable to the question of interest. RH is a measure of the hemolysis relative to a reference value, which is an acceptable validation metric.
Relevance of the validation activities to the COU.
Considering the model risk for COU2, the goal was to ensure that the CFD output for some of the operating conditions with increased potential for generating hemolysis was validated with bench experiments. This credibility goal was achieved because all three validation points were clinically-relevant operating conditions for the pump.
Apply the Model to the COU
Our credibility assessment showed that the CFD model is credible for condition 1 but not conditions 2 and 3. Subsequently, the model was applied to a broad range of conditions within the operating range; data are shown for two additional predictions points for discussion purposes (Figure 6). For condition 4, the CFD predicted RH was 0.4 ± 0.1. Assuming i) the mean comparison error between the CFD results and the experimental data from condition 1 (= 0.1) and ii) the experimental uncertainty (= ± 0.4) from condition 1 was applicable to condition 4, the CFD predicted RH will remain below 1 even after accounting for the comparison error and the experimental uncertainty. In other words, accounting for model form error and all uncertainties in experimental data and the CFD results, the model can be considered credible enough to conclude that the pump will not cause unacceptable levels of hemolysis for condition 1 and condition 4. However, for condition 5, the CFD model predicted RH is 0.55 ± 0.25. If the comparison error for condition 5 is on the order of the comparison error as determined for other conditions, then the RH values exceed 1. In other words, the uncertainties in the model form and other sources result in insufficient credibility to reliably predict hemolysis at condition 5.
For condition 5, the mean RH values are significantly below 1. However, inclusion of the uncertainties in the experiments and the model form makes the results not sufficiently credible to evaluate the pump safety for this condition. If the experimental and numerical uncertainties can be reduced, then the model may be deemed sufficiently credible to predict hemolysis for this condition.
Overall, for COU2, the CFD model was not sufficiently credible to predict hemolysis over the entire operating range of the pump. Consequently, data from additional sources, such as animal testing, might be required to ensure low hemolysis levels in the pump.
Reporting of Computational Model and Credibility Assessment Results
The V&V 40 standard recommends providing a final report of the complete study summarizing the model credibility activities, regardless of the credibility outcome. The final report should include key details and rationales regarding the question of interest, COU, model risk, credibility goals, V&V activities, applicability, and credibility assessment. The FDA guidance on computational model reporting in device submissions26 is recommended if the results from computational modeling studies are provided in a regulatory submission.
Discussion
Computational fluid dynamics and other modeling modalities have the potential to greatly influence the process of designing and evaluating medical devices, including life-supporting devices for patients in critical need. One of the major hurdles that has limited the use of modeling in regulatory submissions has been a lack of consensus on the level of validation required to establish that a model has sufficient credibility for decision-making. The ASME V&V 40 standard helps to elucidate the credibility requirements of a computational model based on risk.
The main objectives of this article were to introduce the concepts of the V&V 40 risk-informed credibility assessment framework and to demonstrate its application with an example relevant to the artificial organ community. The data presented were collected as part of the FDA Blood Pump Round Robin19 and modified for this example; the data are used for demonstration purposes only. And while the results and conclusions are hypothetical, two realistic scenarios were outlined to illustrate the thought processes behind the V&V 40 framework. For example, the scenarios demonstrated how different COUs can apply to the same CFD model and how risk guides the credibility requirements of each V&V activity. The example also illustrated the engineering, and potentially clinical, judgment required to determine rationale and assess credibility. This was exemplified by using the same device geometry, same operating conditions, and same data to support two different COUs: one where the computational model was deemed sufficiently credible (COU1) and the other where it was not (COU2). And while the intent was to present a comprehensive example of the V&V 40 standard, due to space constraints, only a limited number of credibility factors were presented and evaluated. The reader is referred to the V&V 40 standard for further details, which includes six device-related examples in its appendix.
Both COUs required the use of two different computational models: the CFD model for predicting velocity and shear stress, and the HI model to predict hemolytic blood damage caused by the pump. The accuracy requirements for the two models will be different and need to be justified based on the COU. For example, a sufficiently accurate velocity and shear stress prediction from a credible CFD model could still lead to inaccurate HI predictions if the credibility of the hemolysis model is not appropriately established. This was the case for COU2 where the credibility of the hemolysis model was deemed insufficient for assessing the safety of the blood pump even though the velocity (from the CFD model) was deemed credible for COU1.
One theme between the two blood pump scenarios presented was how the risk associated with the COU may be impacted by the device classification. It is worth noting that device classification may not necessarily have a direct link to the decision consequence. For example, micromotion in the socket between the stem and acetabular cup of a hip implant can cause serious infections, which can lead to hospitalization and revision surgeries. Therefore, the risk for models designed to predict micromotion might be high even though this is a moderate risk device.
With respect to V&V, it is worth considering a few additional points. FDA has received inquiries regarding the requirements for code verification of open-source software as compared to commercial software. The FDA guidance26 on reporting states that “Code verification is important, regardless of the software type” and allows companies to reference available documentation and verification results from the software developer.
With respect to validation comparators, for other engineering disciplines, the comparator is typically a physical experiment or bench test. In biomedical models, or models with COUs that might impact patient outcomes or patient care, the validation comparator might be an animal, imaging, or a human clinical study. The details regarding the “test sample” and the “test conditions” remain relevant regardless of the data type; the goal of these factors is to elucidate the uncertainty associated with both types of input.
For computational models supporting medical devices, or more generally in bioengineering, the COU is often related to patient outcomes or device performance in a clinical setting. Therefore, capturing the relevant aspects of the reality of interest, i.e., clinical use, with a validation comparator, such as a bench test, might seem insufficient. The credibility factor for applicability assesses the relevance of the validation setting compared to the use setting. (Note that applicability was demonstrated only for the overlap of the operating conditions; similar analysis would be needed for other factors such as blood viscosity, density, and fragility to understand if the predictions made based on animal blood are applicable under clinical conditions.) Assessing the “distance” between the validation setting and the use setting is not straightforward, especially for complex models with dozens of parameters and a broad range of conditions. Pathmanathan et al. developed an applicability analysis framework to systematically identify the relevant differences between the two settings and qualitatively assess the relevance of the validation evidence.27
Once a model has been deemed credible for the COU, it is contingent upon the analyst to employ the simulation best practices established during the validation process for the problem at hand (e.g., mesh convergence, quantification of model input uncertainties) when making predictions with the model in the COU. Additionally, the model use should not deviate from the COU that motivated the credibility activities without further consideration.
Validation is an iterative process in practice because the ability to develop and validate each aspect of a computational model evolves throughout the validation process. The V&V 40 standard provides options for revisiting various aspects of the validation process in situations where the model is deemed not sufficiently credible for the COU. Examples include revisiting the gradation levels for each credibility factor to identify additional credibility activities that could elevate model credibility, changing the form of the computational model to better match the physical responses of the comparator, modifying the COU to limit the reliance on the computational model, or reducing the influence of the model on the decision-making, which will inherently lower the model risk and thus the credibility goals. The user has the option to use one or a combination of these to develop a model with sufficient credibility.
In conclusion, the V&V 40 standard provides a framework for establishing the credibility requirements of a computational model based on risk. It also provides the user with a means to justify “how much” rigor is required, while the other ASME standards and V&V references provide information on “how to” conduct various V&V processes. These documents, along with the FDA guidance on reporting computational modeling studies, provide formal support for the use of computational modeling as scientific evidence in regulatory applications. Future work includes the development of other examples, including an effort by the FDA and a team of industry partners who are generating “regulatory-grade” evidence to support the initiation of a clinical study for a cardiovascular implant with computational equivalents of bench tests.28 The computational evidence will undergo independent FDA review in a mock regulatory submission. Upon completion, the results from the effort will be made publicly available.
Footnotes
Disclosure: The authors have no conflicts of interest to report.
References
- 1.FDA Website CDRH Regulatory Science Report, http://www.fda.gov/downloads/MedicalDevices/ScienceandResearch/UCM521503.pdf, Accessed March 2018.
- 2.Morrison TM, Pathmanathan P, Adwan M, Margerrison E. Advancing regulatory science with computational modeling for medical devices at the FDA’s office of science and engineering laboratories. Front Med (Lausanne) 20185: 241. [DOI] [PMC free article] [PubMed] [Google Scholar]
- 3.Morrison TM, Dreher ML, Nagaraja S, Angelone LM, Kainz W. The role of computational modeling and simulation in the total product life cycle of peripheral vascular devices. J Med Device 201711: 024503. [DOI] [PMC free article] [PubMed] [Google Scholar]
- 4.Himes A, Haddad T, Bardot D. Augmenting a clinical study with virtual patient models: Food and Drug Administration and industry collaboration. J Med Device 201610: 030947. [Google Scholar]
- 5.Haddad T, Himes A, Thompson L, Irony T, Nair R; MDIC Computer Modeling and Simulation Working Group Participants: Incor poration of stochastic engineering models as prior information in Bayesian medical device trials. J Biopharm Stat 201727: 1089–1103. [DOI] [PubMed] [Google Scholar]
- 6.Medical Device Innovation Consortium, Virtual Patient Website, http://archive.mdic.org/cts/vp/.
- 7.Faris O, Shuren J. An FDA viewpoint on unique considerations for medical-device clinical trials. N Engl J Med 2017376: 1350–1357. [DOI] [PubMed] [Google Scholar]
- 8.Oxford English Dictionary. “credibility, n.1.” OED Online.
- 9.ASME Standard Subcommittee V&V 40, Verification and Vali dation for Computational Modeling of Medical Devices, http://go.asme.org/VnV40Committee.
- 10.ASME Standard, V&V 40–2018, Assessing Credibility of Com putational Modeling through Verification and Validation: Application to Medical Devices.
- 11.Fraser KH, Taskin ME, Griffith BP, Wu ZJ. The use of computational fluid dynamics in the development of ventricular assist devices. Med Eng Phys 201133: 263–280. [DOI] [PMC free article] [PubMed] [Google Scholar]
- 12.Zhang T, Taskin ME, Fang HB, et al. Study of flow-induced hemolysis using novel Couette-type blood-shearing devices. Artif Organs 201135: 1180–1186. [DOI] [PubMed] [Google Scholar]
- 13.ASME Standard, V&V 10–2006, Guide for Verification and Vali dation in Computational Solid Mechanics.
- 14.ASME Standard, V&V 10.1–2012, An Illustration of the Concepts of Verification and Validation in Computational Solid Mechanics.
- 15.ASME Standard, V&V 20–2009, Standard for Verification and Validation in Computational Fluid Dynamics and Heat Transfer.
- 16.NASA Standard, NASA-STD-7009, Standard for Models and Simulations.
- 17.Oberkampf WL, Pilch M, Trucano TG.Predictive capability maturity model for computational modeling and simulation, SANDIA REPORT, SAND2007-5948.
- 18.Oberkampf WL, Roy CJ. Verification and Validation in Scientific Computing, 20101st ed Cambridge University Press. [Google Scholar]
- 19.Malinauskas RA, Hariharan P, Day SW, et al. FDA benchmark medical device flow models for CFD validation. ASAIO J 201763: 150–160. [DOI] [PubMed] [Google Scholar]
- 20.Stewart SF, Paterson EG, Burgreen GW, Hariharan P, Giarra M, Reddy V, Myers MR. Assessment of CFD performance in simulations of an idealized medical device: results of FDA’s first computational interlaboratory study. Cardiovascular Engineering and Technology 20123: 139–160. [Google Scholar]
- 21.Giersiepen M, Wurzinger LJ, Opitz R, Reul H. Estimation of shear stress-related blood damage in heart valve prostheses–in vitro comparison of 25 aortic valves. Int J Artif Organs 199013: 300–306. [PubMed] [Google Scholar]
- 22.Hariharan P, D’Souza G, Horner M, Malinauskas RA, Myers MR. Verification benchmarks to assess the implementation of computational fluid dynamics based hemolysis prediction models. J Biomech Eng 2015137 (9): 094501-1-094501-10. [DOI] [PubMed] [Google Scholar]
- 23.Herbertson LH, Olia SE, Daly A, et al. Multilaboratory study of flow-induced hemolysis using the FDA benchmark nozzle model. Artif Organs 201539: 237–248. [DOI] [PMC free article] [PubMed] [Google Scholar]
- 24.Freeman JA, Roy CJ. Verification and Validation of RANS Turbulent Models in Commercial Flow Solvers. 50th AIAA Aerospace Sciences Meeting, January 2012. [Google Scholar]
- 25.Hariharan P, D’Souza GA, Horner M, Morrison TM, Malinauskas RA, Myers MR. Use of the FDA nozzle model to illustrate validation techniques in computational fluid dynamics (CFD) simulations. PLoS One 201712: e0178749. [DOI] [PMC free article] [PubMed] [Google Scholar]
- 26.Morrison TM; FDA Guidance, Reporting of Computational Modeling Studies in Medical Device Submissions, September 21, 2016.
- 27.Pathmanathan P, Gray RA, Romero VJ, Morrison TM. Applicability analysis of validation evidence for biomedical computational models. J. Verif. Valid. Uncert 20172:021005–02100511. [Google Scholar]
- 28.Morrison TM, Aycock K, Weaver JD, Craven B. A Mock Submission to Initiate a Clinical Trial in the U.S. with Modeling and Simulation, Proceedings of the 2018 VPH Institute Conference, Zaragoza, Spain, 10.6084/m9.figshare.7338923. [DOI] [Google Scholar]


