SUMMARY
Aims: To examine the role of increased oxidative stress in the pathogenesis of cerebral infarction in stroke in stroke‐prone spontaneously hypertensive rats (SHR‐SP). Methods: The differentially expressed brain protein profile was examined in spontaneously hypertensive rats (SHR) (control group) and SHR‐SP using two‐dimensional fluorescent difference gel electrophoresis (2D‐DIGE). In addition, oxidative stress indicators including total antioxidation capacity (TAC), glutathione peroxidase (GPx) activity, and maleic dialdehyde (MDA) were also measured. Lastly, SHR‐SP were randomly divided into untreated and treated (vitamins C (200 mg/kg/day) and E (100 mg/kg/day)) groups. After treatment for 4 weeks, half of the animals were sacrificed for detection of TAC, GPx, and MDA. The remaining rats underwent middle cerebral artery occlusion (MCAO) and the infarct areas were measured. Results: Compared with SHR, the infarct area of SHR‐SP was larger (P < 0.01), and the antioxidative proteins including glutathione S‐transferase (GST) Pi2 and GST A5 were lower; TAC and GPx activities were decreased and MDA levels. Treatment with vitamins C and E decreased MDA, and increased TAC and GPx activity significantly in SHR‐SP, while also decreasing the infarct area (P < 0.01). Conclusions: Our findings indicate that oxidative stress plays an important role in the pathogenesis of cerebral ischemia.
Keywords: Stroke, Two‐dimensional fluorescent difference gel electrophoresis, Oxidative stress, Spontaneously hypertensive rats, Stroke‐prone spontaneously hypertensive rats, Pathogenesis
Introduction
The recent advances in diagnosis of stroke have not been matched by improved therapeutic outcomes. Stroke remains the primary cause of adult disability, and ranks only behind cancer and cardiac disease as a cause of death worldwide [1, 2]. Ischemic stroke was the most frequently occurring type of stroke, accounting for ∼70% of all stroke events in China and 80–85% in Western countries [3, 4]. Apart from death, the greatest burden of stroke on the health care system is the cost of long‐term care and mental disability. According to the World Health Organization, about 15 million people per year fall victim to stroke worldwide, of these, 5 million die within 1 year of diagnosis and another 5 million will be left permanently disabled. Once a stroke has occurred, effective treatments are limited; thus, prevention is considered the most effective strategy to curb the stroke pandemic [5].
Stroke is associated with a combination of multiple risk factors including hypertension [6, 7, 8], diabetes [9], oxidative stress [10], atrial fibrillation [11, 12, 13], obesity [14], etc., of which hypertension is the most prevalent and powerful, across age, sex, and geographic regions [15, 16]. Individual susceptibility to stroke varies greatly among hypertensive patients. Interestingly, a similar variation in susceptibility to stroke occurs in spontaneously hypertensive rats (SHR), and thus a substrain of SHR was developed based on their susceptibility to stroke and named stroke‐prone spontaneously hypertensive rats (SHR‐SP) [17]. SHR‐SP is a commonly used animal model for studying the pathogenesis of stroke. These rats develop a stroke at a mean age of 10 (males) to 14 months (females) in our laboratory [18, 19]. We speculated that since both strains (SHR and SHR‐SP) were hypertensive, a comparison of SHR‐SP with SHR would provide new insights into the pathogenesis and development of stroke beyond hypertension.
Traditionally, studies of stroke have focused on blood plasma/serum or tissue factors [20, 21]. However, as a means of unbiased global screening of physiological perturbations, these approaches are limited. This means that detection of unexpected or novel mechanistic phenomena or markers are difficult to obtain. An integrated multiple systems biology approach is more likely to be an efficient approach for improving our understanding of multiple changes in tissue/organ pathology [22, 23].
This study examines differentially expressed protein profiles in the brains of SHR‐SP and SHR by using two‐dimensional fluorescent difference gel electrophoresis (2D‐DIGE), a hypothesis‐free high‐through strategy capable of resolving a large number of protein spots on a single gel [24, 25, 26]. Our results show that some antioxidative proteins were significantly downregulated in SHR‐SP. Based on these findings; we also investigated the pathological importance of oxidative stress including in the pathogenesis of stroke in SHR‐SP. Maleic dialdehyde (MDA) is a lipid peroxidation product and levels of MDA correlate with the size of ischemic stroke and the clinical outcome, while total antioxidation capacity (TAC) and glutathione peroxidase (GPx) are useful tools for estimating the antioxidant activity in clinical settings [27, 28]. Measurements of oxidative stress indicators including TAC, GPx activity, and MDA in stroke could be useful in our understanding of stroke. Furthermore, antioxidant vitamins are one of the main defense mechanisms of the body's nonenzymatic antioxidant systems. Vitamins C and E are the most studied natural antioxidants, to further confirm the influence of oxidative stress on the infarct area in SHR‐SP, animals were treated with vitamins C and E (200 + 100 mg/kg/day) [29, 30].
Materials and Methods
Materials
Cy2, Cy3, Cy5, 2D‐Clean Up Kit, 2D‐Quant kit, Immobilized PH Gradient (IPG) Buffer PH 3–10 NL, Urea, Thiourea, dithiothreitol (DTT), Iodoacetamide, Mineral Oil, Agarose and molecular weight markers (Amersham Biosciences); N, N‐dimethylformamide (DMF), Chaps and AgNO3 stain (Sigma); ammonium persulfate (AP), TEMED, Tris Base and Glycine (Amresco); sodium dodecyl sulfate (SDS) (Calbiochem); ReadyStripTM IPG strip 17 cm pH 3–10NL and 40% Acrylamide/Bis Solution (29:1) (Bio‐Rad Laboratories, Hercules, CA, USA); TAC and MDA assay kits (Nanjing Jiancheng Bioengineering Inc., Nanjing, China); GPx activity assay kit (Calbiochem); TTC stain (China National Medicines Corporation, China).
Animals
Male SHR‐SP and SHR were provided by the Animal Center of the Second Military Medical University (Shanghai, China) and were housed under controlled temperature (23–25°C) and lighting (8:00–20:00 light, 20:00–8:00 dark) conditions with free access to standard rat chow and drinking water. All the animals used in this study received humane care in compliance with the institutional guidelines for health and care of experimental animals.
Proteomic Analysis
Protein Extraction
Brain tissue was homogenized in lysis buffer containing 7 M urea, 2 M thiourea, 4% CHAPS, and the protease and phosphatase inhibitor cocktails. The lysate was cleared by centrifugation at 4°C, and the supernatant protein (100–300 ug) was precipitated with 2D‐Cleanup kit and resuspended in rehydration buffer containing 8 M urea, 4% CHAPS. The protein concentration was determined using the 2D‐Quant kit. The protein sample was stored in the −80°C aliquots.
Labeling of Proteins with CyDyes
The pH of the protein sample was adjusted to 8.5. The sample was minimally labeled with CyDye DIGE fluors according to the manufacturer's protocol [31]. Briefly, 50 μg protein was labeled at 0°C in the dark for 30 min with 400 pmol cyanine dye (Cy2, Cy3, and Cy5, dissolved in 99.8% DMF). The reaction was quenched by addition of 1 μl 10 mM L‐lysine solution and left on ice for 10 min in the dark.
2D‐Gel Electrophoresis
Two‐dimensional gel electrophoresis was performed as previously described [24]. Briefly, the three 50 μg aliquots of Cy2‐, Cy3‐, and Cy5‐labeled proteins were mixed and loaded on a 17 cm pH 3–10 NL IPG strip. Isoelectric focusing was carried out in the dark using an Ettan™ IPGphorII™ to a total of 64495Vhr (30 V for 6 h and 60 V for 6 h followed by isoelectric focusing at 200 V step for 1 h, 1000 V step for 1 h, and then 8000 V gradient for 30 min). After reduction and alkylation of disulfide bonds with 10 mg/ml DTT for 15 min and 25 mg/ml iodoacetamide for 15 min, the second‐dimension separation was performed by 12.5% SDS‐polyacrylamide gel electrophoresis (SDS‐PAGE).
Image Acquisition and Analysis
2D‐gels were scanned on a Typhoon TRIO imager. Excitation and emission wavelengths were chosen specifically for each of the dyes according to the manufacturer's recommendations [24]. Scans were acquired at 100 μm resolution. Statistical analysis was performed using DeCyder Software v6.5. The ratios between the volumes of individual spots in the SHR‐SP gels versus the corresponding spots in SHR were calculated automatically. The differentially expressed protein ratio was calculated using DeCyder to show the fold change of the expression.
Poststaining and Spot Picking
A picking gel was created using 400 μg total protein pooled from each of the five SHR‐SP and SHR samples and run under the conditions similar to analytical gels except that it was unlabeled. Picking gels were poststained using AgNO3 stain as described [32]. Briefly, after being fixed and washed, the gels were sensitized using 6.8% sodium thiosulfate and impregnated with 0.25% AgNO3 at room temperature for 20 min. Development of the gel was performed using 2.5% sodium carbonate, 0.04% formalin.
Mass Spectrum and Database Search
Protein spots were excised from the gels and detained with 15 mM potassium ferricyanide solution and 50 mM sodium thiosulfate (1:1) for 20 min at room temperature. Then they were washed twice with deionized water, and shrunk by dehydration in ACN. Then the samples were swollen in a digestion buffer containing 20 mM ammonium bicarbonate and 12.5 ng/l trypsin at 4°C. After 30 min incubation, the gels were digested for more than 12 h at 37°C. Peptides were then extracted twice using 0.1% TFA in 50% ACN. Data from MALDI‐TOF/TOF MS were analyzed using MASCOT (Matrix Science, London) search software [31, 33].
2D‐Western Blot
Proteins were electrotransferred to polyvinylidene difluoride filter (PVDF) membrane, and then the PVDF was incubated with specific antibodies for glutathione S‐transferase (GST) pi2/A5 (1:3000, Abcam) after blocked for 2 h, incubated with horseradish peroxidase conjugated antigoat (Kangcheng, China) antibody diluted at 1:5000. As an internal control, the same PVDF was incubated with an antibody specifically for β‐actin (Kangcheng, China, 1:5000). The band optical density was determined by a computerized image analysis system (Tanon, Shanghai, China).
Detection of TAC, GPx, and MDA
TAC measurement was based on the bleaching of the characteristic color of a more stable 2, 20‐azino‐bis (3‐ethylbenz‐thiazoline‐6‐sulfonic acid) (ABTS) radical cation by antioxidants. Many antioxidants can deoxidize Fe3+ to Fe2+, and TAC was determined by colorimetry at 520 nm [34]. GPx activity was based on enzymatic reduction of hydroperoxide by GPx under consumption of reduced glutathione GSH that was restored from oxidized glutathione GSSG in a coupled enzymatic reaction by GR. GR reduces GSSG to GSH under consumption of NADPH as reducing equivalents [35]. Lipid peroxidation thiobarbituric acid‐reactive species (TBARS) were determined according to Uchiyama and Mihara, in which MDA, an end‐product of fatty acid peroxidation, reacts with thiobarbituric acid (TBA) to form a colored complex. The amount of TBARS was measured at 532 nm [36].
MCAO and Morphological Examination
SHR‐SP and SHR underwent middle cerebral artery occlusion (MCAO) by electrocoagulation. The animals were euthanized 24 h after MCAO. The brain was removed and placed into cold 0.1 mol/L phosphate buffer (PBS, pH 7.4, −20°C) for a few minutes, sliced transversely into six 2 mm sections from the anterior to the posterior extremity, stained with 2% 2,3,5‐triphenyl tetrazolium chloride (TTC) for 30 min in the dark, and fixed in 4% paraformaldehyde for more than 1 h. The infarct area of each section was measured by a computerized image analysis system, and the total infarct area of one brain was estimated by adding the infarct area of each section.
Protocols
2D‐DIGE for Differentially Expressed Proteins of the Brain from SHR‐SP and SHR
Male SHR‐SP and SHR aged 5 months were used in this experiment (n= 5 in each group). The brain was removed after the rat was anesthetized with a combination of ketamine and diazepam. The protein sample was separated by 2D‐DIGE, identified by MALDI‐TOF/TOF MS, and verified by western blotting.
Detection of Oxidative Stress Levels in SHR‐SP and SHR
Male SHR‐SP and SHR aged 5 months were used in this experiment. The brain and serum were obtained after the rat was deeply anesthetized. Brain and serum TAC, GPx, and MDA were assayed according to the instructions of the TAC, GPx, and MDA assay kits (n= 10 in each group).
Measurement of the Cerebral Infarct Area in SHR‐SP and SHR
Male SHR‐SP and SHR aged 5 months were subjected to MCAO and the infarct area was measured (n= 10 in each group).
Detection of Oxidative Stress Levels and Measurement of the Cerebral Infarct Area in SHR‐SP Treated with Vitamins C and E
The experiment was performed in 4‐month‐old male SHR‐SP. Forty rats were equally randomized into two groups: control group (the same group of the formerly SHR‐SP), where the animals received distilled water, and VCE group, where the animals were treated with vitamins E and C (100 + 200 mg /kg/day) by gavage for 4 weeks. After 4‐week treatment, 10 rats from either group were sacrificed for detection of TAC, GPx, and MDA. The remaining rats were used for MCAO and measurement of the infarct area.
Statistical Analysis
Data for statistical analysis were expressed as mean ± SD. Comparison between the groups was made by unpaired t‐tests. P < 0.05 was considered statistically significant.
Results
Differential Expression Protein Profiles of SHR‐SP and SHR
2D‐DIGE Mapping of Protein Expression in the Brain of SHR‐SP and SHR
Using 2D‐DIGE, three images corresponding to three samples labeled with three different CyDyes were generated in one gel. Protein extractions of the brain obtained from five different animals per group were run in 2D gels. More than 2000 spots were detected in the CyDye‐stained gels using DeCyder software, most of which were reproducible (Figure 1).
Figure 1.
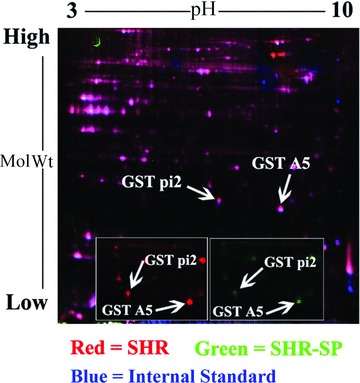
A representative 2D‐DIGE gel image of the brain in SHR‐SP and SHR. The proteins were separated using first‐dimensional isoelectric focusing (IPG:17 cm, nonlinearly covering a pH of 3–10), and 12% SDS‐PAGE gel in the second dimension (n = 5). Gels were scanned by Typhoon TRIO. Two differentially expressed protein spots with P < 0.05 between the SHR‐SP and SHR are marked with arrows. A close‐up image of the region of 2D gels shows the downregulation of protein GST pi 2 and GST A5 in brain of SHR‐SP (right with green) when compared with SHR (left with red).
2D‐DIGE Analysis of the Brain in SHR‐SP and SHR
The overall spot patterns were largely similar between the two groups. The mean ratio and t‐test value for a given spot between SHR‐SP and SHR were generated and shown in Table 1. Twenty‐five proteins were downregulated in SHR‐SP, and 18 protein spots were upregulated in SHR‐SP. Unpaired t‐test was performed for every matched spot‐set, comparing the mean value and SD of protein abundance for a given spot. Pixel values from images of a small area of fluorescent stained gels were converted into 3D representations to illustrate the differential quantification between the two groups (Figure 2).
Table 1.
Identification of the differentially expressed proteins between the brains of SHR‐SP and SHR
| Protein name | NCBInr index code | Score | Coverage) (%) | Best ion score | Ratio | Mol. Wt. (kD) /pI. | Peptides identified |
|---|---|---|---|---|---|---|---|
| Glutathione S‐transferase pi 2 | gi|25453412 | 136 | 20 | 59 | −1.28 | 23.4/6.89 | PPYTIVYFPVR, FEDGDLTLYQSNAILR |
| Glutathione S‐transferase A5 | gi|13928688 | 154 | 18 | 51 | −1.14 | 25.3/8.78 | PGKPVLHYFDGR, NRYFPAFEK, SHGQDYLVGNR, FLQPGSQR |
Note: In the DeCyder output, an increase in protein abundance was expressed as a positive value (e.g., a 2‐fold increase = 2), while a decrease in protein abundance was expressed as a negative value (e.g., a 2‐fold decrease =−2).
Score: It was considered confident that the score of the identified protein was more than 56 according to the calculation of Mascot. Higher score means higher confidence.
Figure 2.
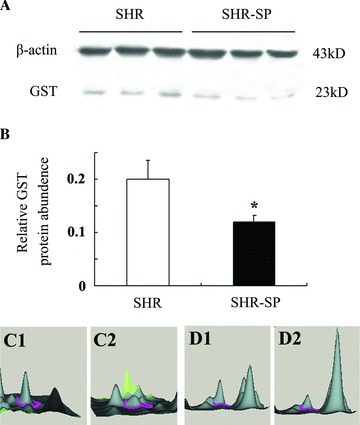
A representative result of western blotting. (A) The expression level of GST protein is examined by western blotting in the brain of SHR and SHR‐SP. The positions of the molecular weight standards are indicated on the right. (B) The relative abundance of GST in the brain of SHR and SHR‐SP. *P < 0.05 versus SHR. n = 3. (C) 3D view of GST pi2 (C1, SHR; C2, SHR‐SP) with Typhoon TRIO. (D) 3D view of GST A5 (D1, SHR; D2, SHR‐SP) with Typhoon TRIO.
Antioxidative Proteins Are Significantly Downregulated in SHR‐SP
To identify and classify differentially expressed proteins, all the proteins were identified with peptide mass fingerprint (PMF) and confirmed by MALDI‐TOF/TOF MS sequencing of selected peptides (Figure 3). A total of 20 proteins were identified and classified into four classes: oxidative stress‐related proteins, metabolism‐related proteins, signal transduction‐related molecules, and other proteins. Antioxidative proteins including glutathione S‐transferase pi 2 (GST pi 2, gi|25453412, −1.28‐fold, score 136) and GST A5 (gi|13928688, −1.14‐fold, score 154) were significantly downregulated in SHR‐SP, which were validated by Western blotting (Table 1, Figure 2).
Figure 3.
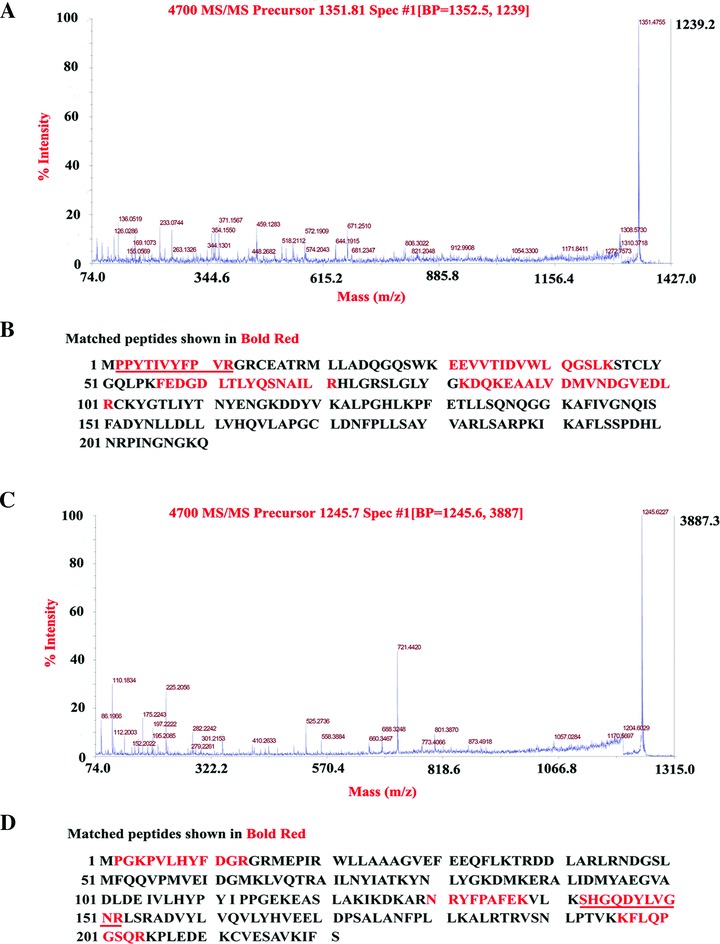
MALDI TOF/TOF MS analysis of differentially expressed protein. (A) GST pi 2 is identified with MALDI TOF/TOF MS according to the matched peaks. MS signals were derived from the parent ion at m/z 1351.81, for which the amino acid sequence, PPYTIVYFPVR, was deduced based upon these b‐ions and y‐ions in MALDI‐TOF/TOF MS. (B) Protein sequence of GST pi 2 is shown and matched peptides are underlined. (C) GST A5 is identified with MALDI TOF/TOF MS according to the matched peaks. MS signals were derived from the parent ion at m/z 1245.7, for which the amino acid sequence, SHGQDYLVGNR, was deduced based upon these b‐ions and y‐ions in MALDI‐TOF/TOF MS. (D) Protein sequence of GST A5 is shown and matched peptides are underlined.
The Oxidative Stress Level in SHR‐SP Is Significantly Higher Than That in SHR
To compare the oxidative stress level between SHR‐SP and SHR, TAC, GPx, and MDA were detected. Figure 4 shows that TAC level and GPx activity in SHR‐SP were significantly lower than those in SHR, while MDA level in SHR‐SP was significantly higher than that in SHR. The results were the same in the brain (TAC: 22.73 ± 3.0 vs. 12.47 ± 3.02; GPx: 1124.4 ± 160.06 vs. 891.81 ± 108.93; MDA: 0.82 ± 0.11 vs. 1.11 ± 0.11) and serum (TAC: 123.66 ± 32.39 vs. 61.29 ± 15.16; GPx: 18.59 ± 2.42 vs. 12.14 ± 1.77; MDA: 5.89 ± 1.21 vs. 13.33 ± 2.9).
Figure 4.
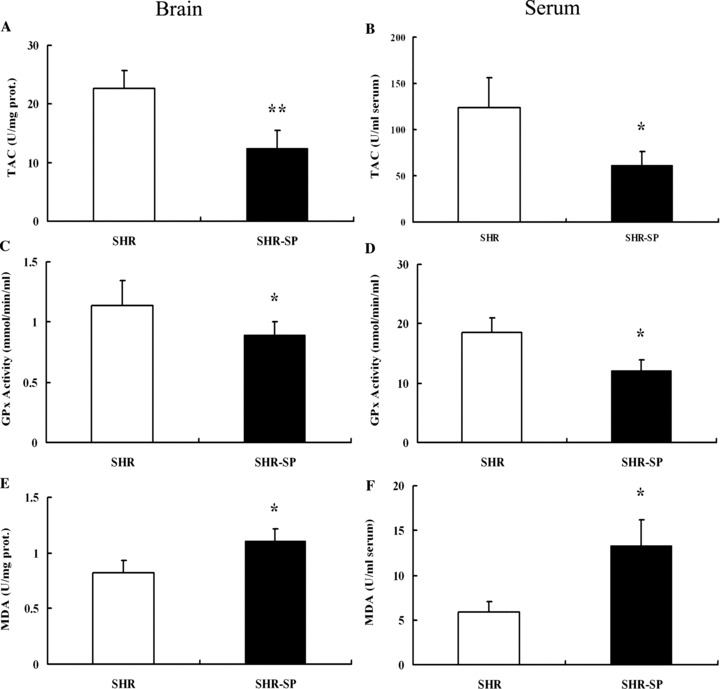
The expression of oxidative stress indicators between SHR‐SP and SHR. (A, C, E) Detection of TAC, GPx, and MDA in the brain. (B, D, F) Detection of TAC, GPx, and MDA in the Serum. TAC, Total antioxidation capacity; GPx, Glutathione peroxidase; MDA, Maleic Dialdehyde. *P < 0.05, **P < 0.01 versus SHR. n = 10.
The Cerebral Infarct Area in SHR‐SP Is Significantly Larger Than That in SHR
TTC staining of the infarct area in SHR‐SP and SHR is shown in Figure 5A. The infarct area in SHR‐SP was lager than that in SHR. Using the computerized image analysis system, the mean infarct area of SHR‐SP and SHR was 31.6 ± 5.4% and 23.0 ± 3.3%, respectively. Unpaired t‐test showed that the mean infarct area of SHR‐SP was significantly larger than that of SHR (P= 0.004) (Figure 5B).
Figure 5.
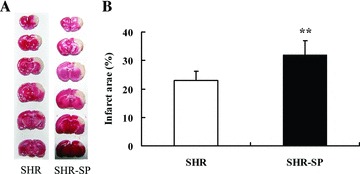
Detection of the infarct area in SHR and SHR‐SP. (A) TTC staining of SHR and SHR‐SP. (B) The infarct area (%) between SHR and SHR‐SP. **P < 0.01 versus SHR. n = 10.
Oxidative Stress and Cerebral Infarction in SHR‐SP Control Group Are Significantly Severer Than Those in VCE Group
Vitamins C and E Significantly Decreased the Oxidative Stress Level of SHR‐SP
To further confirm the influence of oxidative stress on the infarct area in SHR‐SP, animals were treated with antioxidatant vitamins C and E. Figure 6 shows that TAC level and GPx activity were significantly higher in VCE group than those in control group, and that MDA level was significantly lower. The results were the same in the brain (TAC: 25.57 ± 6.68 vs. 12.47 ± 3.02; GPx: 1453.11 ± 126.98 vs. 891.81 ± 108.93; MDA: 0.80 ± 0.05 vs. 1.11 ± 0.11) and serum (TAC: 124.75 ± 28.43 vs. 61.29 ± 15.16; GPx: 19.63 ± 4.85 vs. 12.14 ± 1.77; MDA: 7.31 ± 0.86 vs. 13.33 ± 2.9).
Figure 6.
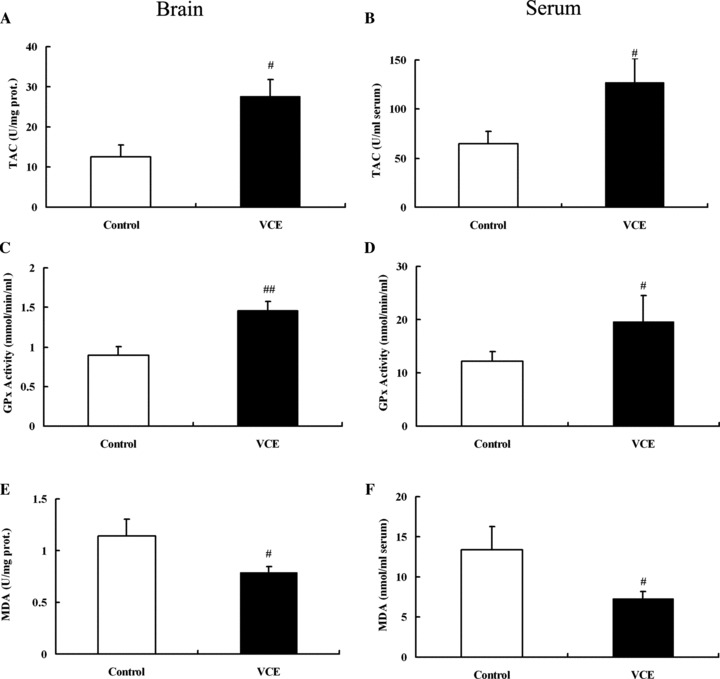
The expression of oxidative stress indicators in SHR‐SP between control and VCE group. (A, C, E) Detection of TAC, GPx, and MDA in the brain. (B, D, F) Detection of TAC, GPx, and MDA in the Serum. TAC, Total antioxidation capacity; GPx, Glutathione peroxidase; MDA, Maleic Dialdehyde. # P < 0.05, ## P < 0.01 versus control. n = 10.
Decreased Oxidative Stress Resulted in a Decrease in the Infarct Area in SHR‐SP
A further study was performed with TTC staining to demonstrate the relationship between the oxidative stress level and the infarct area size in SHR‐SP. Figure 7 shows that the infarct area of SHR‐SP control and VCE group was 32.0 ± 4.9% and 20.8 ± 3.8%, respectively. Unpaired t‐test showed that the infarct area of VCE group was significantly smaller than that of control group (P= 0.003) (Figure 7).
Figure 7.
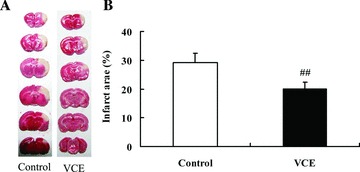
Detection of the infarct area in control and VCE group of SHR‐SP. (A) TTC staining of control and VCE group in SHR‐SP. (B) The infarct area (%) in SHR‐SP between control and VCE group. ## P < 0.01 versus control. n = 10.
Discussion
Comparative proteomics studies mostly rely on traditional two‐dimensional polyacrylamide gel electrophoresis (2D PAGE) following silver or Coomassie Blue staining. Limitations of this method regarding sensitivity, dynamic range, and reproducibility of protein quantification could be improved significantly by introducing DIGE technology employing spectrally resolvable fluorescent dyes to differentially label proteins prior to separation by 2D PAGE [24, 25, 37]. Analysis of the protein expression profile with 2D‐DIGE in the present study indicate differential expression of several proteins, including those involved in oxidative stress, glucose metabolism, in the brains of SHR‐SP. Our study suggests that 25 proteins were downregulated and 18 proteins were upregulated in the brains of SHR‐SP; of these antioxidative proteins (GST pi 2 and GST A5) were identified by MALDI‐TOF/TOF MS. This suggests that oxidative stress may be involved in the pathogenesis and development of stroke. As SHR and SHR‐SP are both hypertensive, the differential expression of proteins in the brains of SHR‐SP and SHR could suggest mechanisms underlying the development of stroke beyond hypertension, despite the low ratio (GST pi 2, −1.28‐fold, score 136; GST A5, −1.14‐fold, score 154) of the difference between SHR‐SP and SHR.
Increasing evidence implicate oxidative stress in the pathogenesis of ischemic brain injury [38, 39, 40]. Oxidative stress, caused by an imbalance between oxidant generation and antioxidant defenses, plays an important role in brain aging, neurodegenerative diseases, and other related adverse conditions such as ischemia [41]. The brain is particularly vulnerable to oxidative stress‐induced damage due to the large numbers of mitochondria, a high degree of polyunsaturated fatty acids (PUFA), and metals; the brain also has a greater oxygen consumption and lower antioxidant capacity than other tissues, making oxidative stress a likely contributor to ischemic damage [1, 42, 43, 44]. Measurements of oxidative stress in stroke could be useful in our understanding of stroke. MDA is a lipid peroxidation product and levels of MDA correlate with the size of ischemic stroke and the clinical outcome, while TAC and GPx are useful tools for estimating the antioxidant activity in clinical settings [27, 28]. In the present work, MDA level of SHR‐SP was significantly higher than that of SHR in both brain and serum, suggesting that oxidative damage to membrane lipids was greater in SHR‐SP than that in SHR. The antioxidant defense system was likely damaged in SHR‐SP as indicated by the significantly lower levels of TAC levels and GPx activities in SHR‐SP. These results suggest that increased lipid peroxidation products and a decreased antioxidant defense system may lead to increased oxidative stress levels in the SHR‐SP.
The generation of free radicals leading to oxidative stress plays an important role in the pathogenesis of ischemic brain injury. Studies in animals and humans demonstrate that oxidative damage to membrane lipids and proteins is increased during cerebral ischemia [45]. The infarct area of SHR‐SP in our work was significantly larger than that of SHR, suggesting that the increase in the cerebral ischemia infarct area may be associated with a higher level of oxidative stress in SHR‐SP. To confirm the association between high oxidative stress and the increased infarct area of SHR‐SP, some animals were treated with the antioxidants vitamins C and E. After 4‐weeks of treatment, the vitamins significantly decreased MDA levels and increased TAC levels and GPx activities in both the brain and serum of SHR‐SP.
Our results indicate treatment with antioxidants significantly reduced oxidative stress and cerebral infarct areas of SHR‐SP, suggesting that the extent of ischemic damage in the brain may be related to the level of oxidative stress level in SHR‐SP. We conclude that increased levels of oxidative stress may lead to more severe cerebral infarction in SHR‐SP.
Author Contributions
Dr. Zhang and Lei designed the study, developed the study protocol, gained and analyzed data. Dr. Zhang produced the draft of the manuscript. Dr. Liu and Zou assist Dr. Zhang with the data collection and analysis. Professor Shen and Su provided conceptual oversight over the entire project and interpretation of the results and preparation of the manuscript. All authors contributed to and approved to the manuscript which has not been published before and is not under consideration for publication elsewhere.
Conflict of Interest
The authors have no conflict of interest.
Acknowledgment
This study was supported by grants from the National Basic Research Program of China (973 Program, 2009CB521900), the National Natural Science Foundation of China (30730106), and the Science and Technology Development Foundation of Shanghai (07JC14065).
See editorial commentary on page 585
The first two authors contributed equally to this work.
References
- 1. Doyle KP, Simon RP, Stenzel‐Poore MP. Mechanisms of ischemic brain damage. Neuropharmacology 2008;55:310–318. [DOI] [PMC free article] [PubMed] [Google Scholar]
- 2. Flynn RW, MacWalter RS, Doney AS. The cost of cerebral ischaemia. Neuropharmacology 2008;55:250–256. [DOI] [PubMed] [Google Scholar]
- 3. Rosamond W, Flegal K, Furie K, et al AHA STATISTICAL UPDATE: Heart Disease and Stroke Statistics — 2008 Update: A report from the American Heart Association Statistics Committee and Stroke Statistics Subcommittee. Circulation 2008;117:e25–e146. [DOI] [PubMed] [Google Scholar]
- 4. Palmer AJ, Valentine WJ, Roze S, Lammert M, Spiesser J, Gabriel S. Overview of costs of stroke from published, incidence‐based studies spanning 16 industrialized countries. Curr Med Res Opin 2005;21:19–26. [DOI] [PubMed] [Google Scholar]
- 5. Pedelty L, Gorelick PB. Management of hypertension and cerebrovascular disease in the elderly. Am J Med 2008;121:S23–S31. [DOI] [PubMed] [Google Scholar]
- 6. Sacco RL, Adams R, Albers G, et al Guidelines for prevention of stroke in patients with ischemic stroke or transient ischemic attack: A statement for healthcare professionals from the American Heart Association/American Stroke Association Council on stroke: Co‐Sponsored by the council on cardiovascular radiology and intervention: The American Academy of Neurology affirms the value of this guideline. Circulation 2006;113:e409–e449. [PubMed] [Google Scholar]
- 7. Lewington S, Clarke R, Qizilbash N, Peto R, Collins R, Prospective Studies Collaboration . Age‐specific relevance of usual blood pressure to vascular mortality: A meta‐analysis of individual data for one million adults in 61 prospective studies. Lancet 2002;360:1903–1913. [DOI] [PubMed] [Google Scholar]
- 8. Bensley JG, Stacy VK, Matteo RD. Cardiac remodeling as a result of pre‐term birth: Implications for future cardiovascular disease. Eur Heart J 2010;31:2058–2066. [DOI] [PubMed] [Google Scholar]
- 9. Rietbrock S, Heeley E, Plumb J, Staa T. Chronic atrial fibrillation: Incidence, prevalence, and prediction of stroke using the congestive heart failure, hypertension, age >75, diabetes mellitus, and prior stroke or transient ischemic attack (CHADS2) risk stratification scheme. Am Heart J 2008;156:57–64. [DOI] [PubMed] [Google Scholar]
- 10. Münzel1 T, Gori1 T, Bruno RM, Taddei S. Translational medicine: Is oxidative stress a therapeutic target in cardiovascular disease? Eur Heart J 2010;31:2741–2748. [DOI] [PubMed] [Google Scholar]
- 11. Lubitz SA, Rosen AB, Ellinor PT, Benjamin EJ. Stroke risk in AF: Do AF patterns matter? Eur Heart J 2010;31:908–910. [DOI] [PMC free article] [PubMed] [Google Scholar]
- 12. Friberg L, Hammar N, Rosenqvist M. Stroke in paroxysmal atrial fibrillation: Report from the Stockholm Cohort of Atrial Fibrillation. Eur Heart J 2010;31:967–975. [DOI] [PubMed] [Google Scholar]
- 13. Camm AJ, Kirchhof P, Lip GY, et al Guidelines for the management of atrial fibrillation: The task force for the management of atrial fibrillation of the European Society of Cardiology (ESC). Eur Heart J 2010;31:2369–2429. [DOI] [PubMed] [Google Scholar]
- 14. Romero‐Corral A, Somers1 VK, Sierra‐Johnson J, et al Normal weight obesity: A risk factor for cardiometabolic dysregulation and cardiovascular mortality. Eur Heart J 2010;31:737–746. [DOI] [PMC free article] [PubMed] [Google Scholar]
- 15. Andersen ZJ, Olsen TS, Andersen KK, Loft S, Ketzel M, Raaschou‐Nielsen O. Association between short‐term exposure to ultrafine particles and hospital admissions for stroke in Copenhagen, Denmark. Eur Heart J 2010;31:2034–2040. [DOI] [PubMed] [Google Scholar]
- 16. Ducrocq G, Wallace JS, Baron G, et al Risk score to predict serious bleeding in stable outpatients with or at risk of atherothrombosis. Eur Heart J 2010;31:1257–1265. [DOI] [PMC free article] [PubMed] [Google Scholar]
- 17. Okamoto K, Yamori Y, Nagaoka A. Establishment of the stroke‐prone spontaneously hypertensive rats (SHR). Circ Res 1974;34:I‐143–I‐145. [Google Scholar]
- 18. Zhang W, Liu AJ, Yi‐Ming W, Liu JG, Shen FM, Su DF. Pressor and non‐pressor effects of sodium loading on stroke in stroke‐prone spontaneously hypertensive rats. Clin Exp Pharmacol Physiol 2008;35:83–88. [DOI] [PubMed] [Google Scholar]
- 19. Liu AJ, Ma XJ, Shen FM, Liu JG, Chen H, Su DF. Arterial baroreflex. A novel target for preventing stroke in rat hypertension. Stroke 2007;38:1916–1923. [DOI] [PubMed] [Google Scholar]
- 20. Zaremba J, Skrobanski P, Losy J. Tumour necrosis factor‐alpha is increased in the cerebrospinal fluid and serum of ischaemic stroke patients and correlates with the volume of evolving brain infarct. Biomed Pharmacother 2001;55:258–263. [DOI] [PubMed] [Google Scholar]
- 21. Yang TH, Chang CY, Hu ML. Various forms of homocysteine and oxidative status in the plasma of ischemic‐stroke patients as compared to healthy controls. Clin Biochem 2004;37:494–499. [DOI] [PubMed] [Google Scholar]
- 22. Weeks ME, Sinclair J, Butt A, et al A parallel proteomic and metabolomic analysis of the hydrogen peroxide‐ and Sty1p‐dependent stress response in Schizosaccharomyces pombe. Proteomics 2006;6:2772–2796. [DOI] [PubMed] [Google Scholar]
- 23. Craig A, Sidaway J, Holmes E, et al Systems toxicology: Integrated genomic, proteomic and metabonomic analysis of methapyrilene induced hepatotoxicity in the rat. J Proteome Res 2006;5:1586–1601. [DOI] [PubMed] [Google Scholar]
- 24. Alban A, David SO, Bjorkesten L, et al A novel experimental design for comparative two‐dimensional gel analysis: Two‐dimensional difference gel electrophoresis incorporating a pooled internal standard. Proteomics 2003;3:36–44. [DOI] [PubMed] [Google Scholar]
- 25. Bredemeyer AJ, Lewis RM, Malone JP, et al MEDICAL SCIENCES: A proteomic approach for the discovery of protease substrates. PNAS 2004;101:11785–11790. [DOI] [PMC free article] [PubMed] [Google Scholar]
- 26. Kaski JC. C‐reactive protein improves risk prediction in patients with acute coronary syndrome, or does it? Eur Heart J 2010;31:274–277. [DOI] [PubMed] [Google Scholar]
- 27. El‐Kossi MM, Zakhary MM. Oxidative stress in the context of acute cerebrovascular stroke. Stroke 2000;31:1889–1892. [DOI] [PubMed] [Google Scholar]
- 28. Catalá A. Lipid peroxidation of membrane phospholipids generates hydroxy‐alkenals and oxidized phospholipids active in physiological and/or pathological conditions. Chem Phys Lipids 2009;157:1–11. [DOI] [PubMed] [Google Scholar]
- 29. Charakida M, Masi S, Lüscher TF. Assessment of atherosclerosis: The role of flow‐mediated dilatation. Eur Heart J 2010;31:2854–2861. [DOI] [PubMed] [Google Scholar]
- 30. Heiss C, Keen CL, Kelm M. Flavanols and cardiovascular disease prevention. Eur Heart J 2010;31:2583–2592. [DOI] [PubMed] [Google Scholar]
- 31. Daniel YA, Turner C, Haynes RM, Hunt BJ, Dalton RN. HEMATOLOGY: Quantification of hemoglobin A2 by tandem mass spectrometry. Clin Chem 2007;53:1448–1454. [DOI] [PubMed] [Google Scholar]
- 32. Merril CR, Harrington MG. “Ultrasensitive” silver stains: Their use exemplified in the study of normal human cerebrospinal fluid proteins separated by two‐dimensional electrophoresis. Clin Chem 1984;30:1938–1942. [PubMed] [Google Scholar]
- 33. Brakch N, Dormond O, Bekri S. Evidence for a role of sphingosine‐1 phosphate in cardiovascular remodelling in Fabry disease. Eur Heart J 2010;31:67–76. [DOI] [PubMed] [Google Scholar]
- 34. Erel O. A novel automated method to measure total antioxidant response against potent free radical reactions. Clin Biochem 2004;37:112–119. [DOI] [PubMed] [Google Scholar]
- 35. Schuessel K, Schafer S, Bayer TA, et al Impaired Cu/Zn‐SOD activity contributes to increased oxidative damage in APP transgenic mice. Neurobiol Dis 2005;18:89–99. [DOI] [PubMed] [Google Scholar]
- 36. Mihara M, Uchiyama M. Determination of malonaldehyde precursor in tissues by thiobarbituric acid test. Anal Biochem 1978;86:271–278. [DOI] [PubMed] [Google Scholar]
- 37. Tonge R, Shaw J, Middleton B, et al Validation and development of fluorescence two‐dimensional differential gel electrophoresis proteomics technology. Proteomics 2001;1:377–396. [DOI] [PubMed] [Google Scholar]
- 38. Yousuf S, Atif F, Ahmad M, et al Selenium plays a modulatory role against cerebral ischemia‐induced neuronal damage in rat hippocampus. Brain Res 2007;1147:218–225. [DOI] [PubMed] [Google Scholar]
- 39. Saleem S, Ahmad M, Ahmad AS, et al Behavioral and histologic neuroprotection of aqueous garlic extract after reversible focal cerebral ischemia. J Med Food 2006;9:537–544. [DOI] [PubMed] [Google Scholar]
- 40. Sun M, Zhao Y, Gu Y, Xu C. Inhibition of nNOS reduces ischemic cell death through down‐regulating calpain and caspase‐3 after experimental stroke. Neurochem Int 2009;54:339–346. [DOI] [PubMed] [Google Scholar]
- 41. Wang X, Michaelis EK. Selective neuronal vulnerability to oxidative stress in the brain. Front Aging Neurosci 2010;2:12–25. [DOI] [PMC free article] [PubMed] [Google Scholar]
- 42. Khan MM, Ishrat T, Ahmad A, et al Sesamin attenuates behavioral, biochemical and histological alterations induced by reversible middle cerebral artery occlusion in the rats. Chem Biol Interact 2010;183:255–263. [DOI] [PubMed] [Google Scholar]
- 43. Reiter RJ, Tan DX, Leon J, Kilic U, Kilic E. When melatonin gets on your nerves: its beneficial actions in experimental models of stroke. Exp Biol Med (Maywood) 2005;230:104–117. [DOI] [PubMed] [Google Scholar]
- 44. Niizuma K, Endo H, Chan PH. Oxidative stress and mitochondrial dysfunction as determinants of ischemic neuronal death and survival. J Neurochem 2009;109:133–138. [DOI] [PMC free article] [PubMed] [Google Scholar]
- 45. Cherubini A, Ruggiero C, Polidori MC, Mecocci P. Potential markers of oxidative stress in stroke. Free Radic Biol Med 2005;39:841–852. [DOI] [PubMed] [Google Scholar]


