

Abstract
The increasing rate of failure of antidepressant clinical trials has led to the assertion that antidepressants do not have meaningful clinical benefits. Our hypothesis was that the decrease in antidepressant–placebo differences in antidepressant clinical trials over the past three decades could be explained by changes in research design features rather than a lack of potency of the antidepressants being tested. We collected data from 130 double blind placebo controlled antidepressant clinical trials conducted between 1981 and 2008 that included 35,122 depressed patients with 23,157 patients assigned to antidepressants and 11,965 assigned to placebo. We conducted a hierarchical regression analysis of change in HAM‐D scores in antidepressant and placebo groups separately with year of publication, and research design features as independent variables. We found that antidepressant–placebo differences in antidepressant clinical trials have declined markedly over the past three decades. Decline in change scores in the antidepressant group was related to mean total baseline HAM‐D scores in the trial, the version of HAM‐D used, and duration of trial. Similarly, decline in change scores in the placebo group was related to mean total baseline HAM‐D scores, duration of trial, and year of publication. Overall, we found that antidepressant–placebo differences were statistically significantly higher in trials that used HAM‐D 21 rather than HAM‐D 17 and in trials that lasted 6 weeks or less. These data suggest that, apart from the efficacy of the antidepressant being tested, factors such as baseline HAM‐D scores, version of HAM‐D used and duration of trial have a significant impact on outcome. As such a clinician's assessment of the usefulness of antidepressants should not be based solely on the results of such clinical trials. In the meantime there is a need for continuing research to improve the methodology of antidepressant clinical trials. These data suggest that many aspects of the design of antidepressant trials have a significant impact on outcome. Further, these data suggest that the results of more recent placebo controlled trials do not adequately inform clinicians about the potential utility of antidepressants.
Keywords: Antidepressant, Clinical trials, Placebo
Introduction
Although the suggestion that antidepressants have limited utility [1] has been refuted by recent reviews [2], there still exists a concern that antidepressants may not be as effective as has been accepted. This concern is based on the inability to demonstrate significant differences between antidepressants and placebo in recent clinical trials.
It has been suggested that placebo response in antidepressant clinical trials has been growing in the past few decades and that this phenomenon has led to a higher frequency of failed trials [3]. However, little attention has been paid to changes in other features of clinical trials over time that might influence response to antidepressants or antidepressant–placebo differences.
We hypothesized that the decrease in antidepressant–placebo difference in antidepressant trials over time may be related to research trial design features such as severity of symptoms at the start of the trial, duration of the trial, and dosing schedule (fixed vs. flexible dosing schedules, which also may be a surrogate for number of treatment arms in a study). We have previously found, based on data from FDA SBA reports [4, 5], that greater severity of depressive symptoms before patient randomization and more frequent use of flexible dosing schedule were associated with significantly greater differences in response to antidepressants versus placebo, whereas the duration of the trial, number of patients per treatment arm and mean age of patients were not.
There are other possible explanations for the increasing failure rate of trials. For e.g., some investigators have suggested that differences exist among various antidepressants that may influence results of antidepressant clinical trials [6]. Also, the most commonly used measurement tool of Hamilton Depression scale – HAM‐D [7] has not been applied uniformly among the various antidepressant clinical trials, i.e., several versions of HAM‐D are in use depending upon the number of items included in calculating the final score – 16, 17, 19, 21, and 24 [8]. This in turn may affect the range of depressive symptoms evaluated as well as magnitude of change with antidepressants and placebo. Further, the choice of measurement tool may also change mean total prerandomization (baseline) scores and as such an increase in severity of symptoms may affect antidepressant–placebo differences.
Hence we decided to evaluate the change in antidepressant–placebo differences in HAM‐D scores in antidepressant clinical trials over the past three decades. An ideal analysis would include unpublished trials as well, as it has been shown that negative trials are very seldom published [9], however, the SBA reports and other databases do not include detailed information such as the year of conduct of the trials. Also, FDA SBA reports do not include any data from antidepressants not approved for sale in the US, nor those antidepressants approved in the 1950s to 1980s.
Accordingly we decided to use the data from all published antidepressant trials to obtain the largest possible database, being cognizant of the fact that failed or negative trials are unlikely to be represented in the published literature as published literature yields mostly results of successful antidepressant trials.
We decided to utilize antidepressant–placebo differences in HAM‐D using the last observation carried forward (LOCF) technique rather than response rates as our primary dependent variable, for several reasons. First, most regulatory agencies including US FDA use this variable in their own evaluations of antidepressant efficacy data. Second, response rates influenced by baseline HAMD scores. For example, a depressed patient scoring eighteen points on a 17‐item HAM‐D scale at baseline will be a responder if the final score changes by ten points (at least 50% reduction in score [10]). On the other hand, a baseline seventeen item HAM‐D scale of 28 would require a change in score of 14 points in order for the patient to be termed a responder.
We hypothesized that the magnitude of antidepressant–placebo differences may have decreased over time and that this change may be related to changes in the several factors listed above. In order to verify our hypothesis we evaluated the relationship of these factors in relation to symptom reduction with antidepressant and placebo using hierarchical multiple regression, followed by additional exploratory analyses.
Methods
Identifying the Trials
Our analysis included randomized controlled clinical trials comparing antidepressants to placebo in adult outpatients with unipolar major depressive disorder (MDD) published between 1981 and 2008. As mentioned earlier, although it would have been desirable to include unpublished trials as well, we were unable to do so owing to the limitations of the FDA database.
To obtain articles published between 1981 and 2008, we conducted multiple computer searches on Medline using the key words placebo and generic names of all putative antidepressants. We used the following limits/restrictions: English language, publication year from 1981 to 2008, age group ≥18, publication type clinical trials, controlled clinical trials, multi center study, randomized controlled trial.
Two of the authors (Author 1 and Author 2) reviewed titles, abstracts and finally full text of the qualifying articles to determine whether they met inclusion/exclusion criteria. The inclusion criteria we used were: enrolled patients with major depressive disorder; outpatient study; employed random assignment; included a placebo control group; reported in English; published between January 1981 and October 2008; duration of trial between 4 and 12 weeks; reported HAM‐D scores as a measure of efficacy, and either reported both baseline and end or LOCF (last observation carried forward – in which patients prematurely terminating from a trial are assumed to experience no further improvement, and the last measured scores are considered end of trial) HAM‐D scores for antidepressant and placebo groups, or change in HAM‐D scores in antidepressant and placebo groups. We did not include reports of trials in which the HAM‐D was not used as either a primary or a secondary efficacy measure.
We also retrieved relevant articles using citations from bibliographies of the articles we obtained from our initial search. Consistent with Quorum guidelines [11], Supplemental Figure 1 depicts the process for inclusion of articles in the analysis. Of the 125 articles (Supplement 2) selected by this process, one (Golden et al, 2002) was a report of two trials and one (Robinson and Rickels, 1990) was a report of five trials. Thus, we included a total of 130 trials for the analysis. Of these trials, 49 had one active treatment arm (only the investigational medication), 68 had two active treatment arms – investigational and comparator, 4 trials had 3 active treatment arms – 1 investigational and 2 comparator arms each, 3 trials had 2 active treatment arms – 2 different doses of the same investigational medication. Additionally, 5 of the trials had 3 active treatment arms – 2 different doses of the investigational medication and 1 comparator arm, and 1 trial had 4 active treatment arms – 3 different doses of the investigational medication, and 1 comparator arm.
Figure 1.
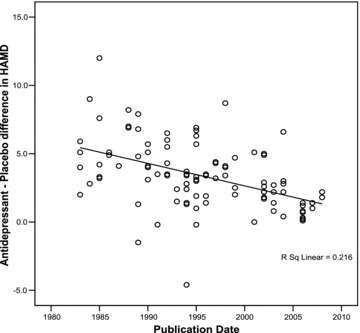
Correlation of antidepressant–placebo differences (difference between antidepressant and placebo groups in change in mean total HAMD scores) with year of publication.
Hence, we compiled the results of 130 antidepressant clinical trials published between 1981 and 2008 that included 35,122 depressed patients with 23,157 patients assigned to antidepressants and 11,965 assigned to placebo.
Computation of the Dependent Variables
All analyses were performed using SPSS (version 12) for the total of 130 trials.
First, we computed the dependent variables (change in HAM‐D score in antidepressant and placebo groups and antidepressant–placebo difference scores) as follows: for studies which reported baseline and end or LOCF HAM‐D scores in the antidepressant and placebo groups, we calculated the change in HAM‐D scores for each group, and then the difference between the two to obtain antidepressant–placebo differences. These scores were used as the dependent variables in the regression analyses run separately for the antidepressant and placebo groups. This antidepressant–placebo difference score served as the dependent variable in our exploratory analyses. Some studies directly reported the actual change in HAM‐D scores, and we used this information in our analysis.
To obtain composite HAM‐D scores in trials with more than one active medication arm, we calculated the mean change in HAM‐D score for all the active arms in the trial. For example, in the Nierenberg, Greist et al. (Supplement 2) trial (which compared duloxetine and escitalopram to placebo), the mean change in HAM‐D scores were 7.6 and 7.2 respectively in the duloxetine and escitalopram groups. Hence, for the purposes of our analysis, the mean change in HAM‐D score in the antidepressant group was obtained by averaging the scores of the duloxetine and escitalopram groups, i.e., 7.4.
Evaluating Changes with Antidepressants and Placebo using a Hierarchical Multiple Regression Test
As the database contained results from treatment arms including medications not approved by the FDA as antidepressants (and this nonapproval could be reflective of a lack of efficacy), we next evaluated whether there were significant differences between the antidepressant–placebo differences in the group of US FDA approved antidepressants compared to the antidepressants not approved by the FDA. The mean antidepressant–placebo difference in the US FDA approved group of antidepressants (n = 117) was 11.4 ± 2.6 and that in the group of antidepressants not approved by the US FDA (n = 41) was 10.8 ± 3.8. As we had expected, there appeared to be a slightly larger antidepressant–placebo difference among antidepressants that had achieved US FDA approval compared to antidepressants that had not achieved US FDA approval. However, this difference did not reach statistical significance (t{df = 156}= 1.09, p= 0.28). Hence we felt it acceptable to use the entire dataset (i.e., USFDA approved and nonapproved antidepressants) in the analysis.
First, we evaluated the magnitude of antidepressant–placebo differences over the last three decades as shown in Figure 1. These data confirmed the hypothesis that antidepressant–placebo differences have significantly declined in the past three decades (r=−0.46, n = 102, p < 0.001). This analysis supported our primary assumption and warranted further evaluation of factors that may be related to changes in antidepressant–placebo differences.
However, based on the fact that the number of treatment arms for the antidepressant group was not the same as the placebo treatment arms, we could not simply evaluate the antidepressant–placebo differences. In other words, not all antidepressant treated groups had an individual control placebo group. This specifically relates to antidepressant trials that had more than one active treatment, besides placebo (82 of the 130 trials). Using the same control group to calculate antidepressant–placebo difference scores across multiple trials would violate the assumptions of hierarchical multiple regression analysis that residuals be independent.
Given this fact, we decided to conduct the hierarchical multiple regression analysis separately in the antidepressant treated group and the placebo treated group. In order to conduct such an analysis, we first correlated the changes in the mean total HAM‐D scores separately among depressed patients assigned to antidepressants (see Figure 2A) and depressed patients assigned to placebo (see Figure 2B) with year of publication.
Figure 2.
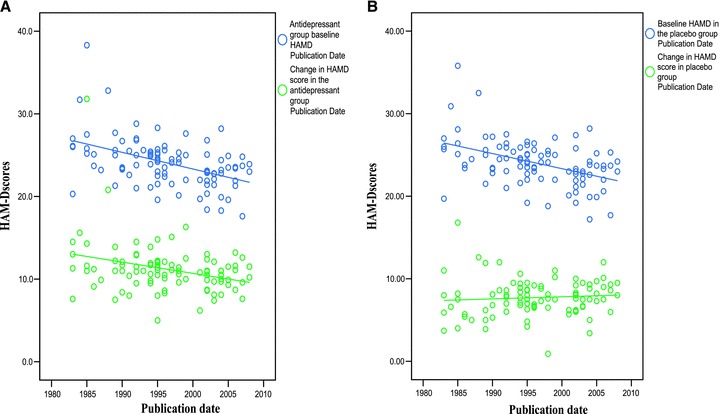
(A) Mean total baseline HAMD scores and change in mean total HAMD scores in the antidepressant group correlated with year of publication. (B) Mean total baseline HAMD scores and change in mean total HAMD scores in the placebo group correlated with year of publication.
In addition, we computed the mean total baseline HAM‐D score among depressed patients assigned to antidepressants (see Figure 2A) and placebo (see Figure 2B) over the past three decades. The results of this computation follow the pattern seen in an earlier analysis including unpublished antidepressant clinical trial data [4].
These findings support the suggestion that we could conduct a hierarchical multiple regression test separately for antidepressant and placebo groups with the assumption that the results of the analysis may not be identical among the two separate groups as the factors associated with outcome with antidepressants are not identical to the factors associated with outcome with placebo.
We next conducted several steps of preliminary analysis prior to conducting a hierarchical multiple regression analysis. These steps are detailed in Supplement 3. Based on these preliminary analyses, we included the following variables as independent variables in the hierarchical multiple regression: year of approval/appearance on the market (based on a review by Author 1); version of HAM‐D scale used (coded dummy variables for HAM‐D 16, HAM‐D 17, HAM‐D 21, and HAM‐D 24); mean total baseline HAM‐D scores; duration of trial; dosing schedule (fixed versus flexible); and year of publication.
Post Hoc Exploratory Analysis
Following this regression analysis, we found that certain factors had significant associations with the change score in mean total HAM‐D score, either with antidepressants or placebo.
These significant associations by themselves do not provide information on the quantitative and qualitative relationship between these factors and the dependent measures. Hence, we conducted detailed post hoc analyses to assess the specific relationship between the outcome measures and the research design features. This was done in order to identify if there were any possible changes that could be made to design features that may help to assure a successful outcome in a trial or at least help to minimize type II errors.
Results
For our analysis we included 130 antidepressant trials, with a total of 35,122 patients, of whom 23,157 patients were assigned to antidepressants and 11,965 patients were assigned to placebo.
1, 2, were part of the methods to set up the hierarchical multiple regression analysis. They illustrate the striking decline in antidepressant–placebo differences in HAM‐D in the past three decades (r=−0.46, n = 102, p < 0.001); and change in HAM‐D scores in the antidepressant and placebo groups as well as the mean total baseline HAM‐D scores in both groups. Based on these analyses we ran the regression analysis in the antidepressant treated group of depressed patients and placebo treated depressed patients separately.
Results of the Hierarchical Multiple Regressions
Tables 1 and 2 summarize the results of hierarchical multiple regression tests conducted for depressed patients assigned to antidepressants and placebo separately. In the hierarchical multiple regression tests conducted for the depressed patients assigned to antidepressants (Table 1), three independent variables appeared to be related to the changes in mean total HAM‐D score in the antidepressant group: HAM‐D baseline score, HAM‐D version used in the trial and duration of trial.
Table 1.
Hierarchical regression of change in HAMD score in the antidepressant group as dependent variable and FDA approval, HAMD version used, baseline HAMD score in the antidepressant group, duration of trial, dosing schedule (fixed or flexible) and year of publication as independent variables
| Model summary | |||||||||
|---|---|---|---|---|---|---|---|---|---|
| Model | R | R square | Adjusted R square | Std. error of the estimate | Change statistics | ||||
| R square change | F change | df1 | df2 | Sig. F change | |||||
| 1 | 0.088 | 0.008 | 0.001 | 3.0014 | 0.008 | 1.153 | 1 | 149 | 0.285 |
| 2 | 0.303 | 0.092 | 0.080 | 2.8809 | 0.084 | 13.725 | 1 | 148 | 0.000 |
| 3 | 0.713 | 0.509 | 0.499 | 2.1262 | 0.417 | 124.721 | 1 | 147 | 0.000 |
| 4 | 0.728 | 0.530 | 0.517 | 2.0871 | 0.021 | 6.550 | 1 | 146 | 0.012 |
| 5 | 0.728 | 0.530 | 0.514 | 2.0943 | 0.000 | 0.002 | 1 | 145 | 0.969 |
| 6 | 0.730 | 0.533 | 0.513 | 2.0955 | 0.003 | 0.831 | 1 | 144 | 0.364 |
Model 1: Predictors: (Constant), Antidepressants approved by FDA in chronological order.
Model 2: Predictors: (Constant), Antidepressants approved by FDA in chronological order, HAMD version dummy variable.
Model 3: Predictors: (Constant), Antidepressants approved by FDA in chronological order, HAMD version dummy variable, Antidepressant group baseline HAMD.
Model 4: Predictors: (Constant), Antidepressants approved by FDA in chronological order, HAMD version dummy variable, Antidepressant group baseline HAMD, Duration of trial in weeks.
Model 5: Predictors: (Constant), Antidepressants approved by FDA in chronological order, HAMD version dummy variable, Antidepressant group baseline HAMD, Duration of trial in weeks, Fix versus flexible dosing.
Model 6: Predictors: (Constant), Antidepressants approved by FDA in chronological order, HAMD version dummy variable, Antidepressant group baseline HAMD, Duration of trial in weeks, Fix versus flexible dosing, Publication Date.
Overall Fs for all individual steps beyond step 1 in the regression model were significant at the P= 0.001 level or better.
Table 2.
Hierarchical regression of change in HAMD score in the placebo group as dependent variable and HAMD version used, baseline HAMD score in the placebo group, duration of trial, dosing schedule (fixed or flexible) and year of publication as independent variables
| Model summary | |||||||||
|---|---|---|---|---|---|---|---|---|---|
| Model | R | R square | Adjusted R square | Std. error of the estimate | Change statistics | ||||
| R square change | F change | df1 | df2 | Sig. F change | |||||
| 1 | 0.169 | 0.028 | 0.017 | 2.20454 | 0.028 | 2.549 | 1 | 87 | 0.114 |
| 2 | 0.491 | 0.241 | 0.224 | 1.95926 | 0.213 | 24.146 | 1 | 86 | 0.000 |
| 3 | 0.554 | 0.307 | 0.283 | 1.88320 | 0.066 | 8.088 | 1 | 85 | 0.006 |
| 4 | 0.557 | 0.311 | 0.278 | 1.88994 | 0.003 | .394 | 1 | 84 | 0.532 |
| 5 | 0.588 | 0.346 | 0.307 | 1.85186 | 0.035 | 4.491 | 1 | 83 | 0.037 |
Model 1: Predictors: (Constant), HAMD version dummy variable.
Model 2: Predictors: (Constant), HAMD version dummy variable, Baseline HAMD in the placebo group.
Model 3: Predictors: (Constant), HAMD version dummy variable, Baseline HAMD in the placebo group, Duration of trial in weeks.
Model 4: Predictors: (Constant), HAMD version dummy variable, Baseline HAMD in the placebo group, Duration of trial in weeks, Fix versus flexible dosing.
Model 5: Predictors: (Constant), HAMD version dummy variable, Baseline HAMD in the placebo group, Duration of trial in weeks, Fix versus flexible dosing, Publication Date.
Overall Fs for all individual steps beyond step 1 in the regression model were significant at the P= 0.001 level or better.
The largest association was with the mean total baseline HAM‐D score (R 2 change of 0.42) and a smaller association with version of HAM‐D scale used (R 2 change of 0.08), with these two items accounting for more than 50% of the variance. In other words, the higher the mean total baseline HAM‐D score, greater the change in mean total HAM‐D scores (or symptom reduction) in the antidepressant group. Similarly, the HAM‐D versions assessing more symptoms (say HAM‐D 21 compared to HAM‐D 17 version), seemed to be related to a greater change in mean total HAM‐D scores (symptom reduction) in the antidepressant treated group. Duration of trial also showed an association with symptom reduction in the antidepressant treated group (larger change in HAMD scores in the antidepressant group in shorter trials) with an R 2 change of 0.02. None of the other factors including the year of publication or dosing schedule were statistically significantly associated with changes in mean total HAM‐D score in the antidepressant treated group.
As shown in Table 2, three independent variables appeared to be significantly related to change in mean total HAM‐D score among the placebo treated depressed patients. As was the case with antidepressants, the higher the mean total baseline HAM‐D score, the greater the change in mean total HAM‐D score (symptom reduction) among placebo treated patients as well (R 2 change 0.21). In addition, the longer the duration of the antidepressant trial, greater the changes in mean total HAM‐D score (symptom reduction) among placebo treated patients (R 2 change of 0.07). Further, year of publication was also significantly associated with change in mean total HAM‐D score i.e., more recent antidepressant trials had a greater change in mean total HAM‐D scores (R 2 change of 0.04).
Results of the Post Hoc Analyses
Based on the results of the hierarchical multiple regression analysis, we identified three factors that were associated with changes with either antidepressants or placebo.
For the dependent measure consisting of changes in mean total HAM‐D score in both the antidepressant and placebo treated groups, mean total baseline HAM‐D scores and duration of the trials appeared to have significant association. In addition, the version of HAM‐D used seemed to be significantly associated with changes in the antidepressant group (although a similar trend was seen in the placebo treated group, the association did not reach statistical significance). Besides these two variables, the year of publication was associated with changes seen with mean total HAM‐D score in the placebo group.
We examined individually each of the factors that we found to be significantly associated with HAM‐D change scores, especially as we had not been able to explore the role they played in the combined group for antidepressant–placebo differences (owing to the restrictions imposed by the assumptions underlying regression analysis).
Factor 1. As baseline HAM‐D scores showed the greatest association with change scores in HAM‐D in both the antidepressant and the placebo treated groups, we decided to first examine the role of this factor, especially for antidepressant–placebo differences. The specific aim was to assess whether a specific score on mean total HAM‐D score could be identified that would either suggest a greater likelihood of success or increase the possibility of type II error.
We considered two methods of exploration. The first evaluation consisted of bifurcating the sample of trials into two based on mean baseline total HAM‐D score (of 24.3) and assessing whether there were any differences in antidepressant–placebo differences in the two samples. By an unpaired t test, there were no significant differences between the two groups of HAM‐D ≥ 24.3 and HAM‐D < 24.3 (Mean1= 3.0 Mean2= 3.3 t(113) = 0.7, p= 0.5). The median HAM‐D score for the dataset was similar (24.1).
In addition, we decided to assess whether there was any significant difference between the mean baseline HAM‐D scores in two groups of “less successful” (antidepressant–placebo difference less than 3) and “more successful” (antidepressant–placebo difference of more than or equal to 3) trials. We first ran a bivariate correlational analysis. We found that success of trial was significantly correlated with baseline HAM‐D scores (r= 0.2, n = 115, p < 0.05). As the baseline score could be influenced by version of HAM‐D used, we conducted a partial correlational analysis, this time controlling for version of HAM‐D. Baseline HAM‐D scores continued to be significantly associated with success of the trial (r= 0.2, n = 102, p < 0.05). In other words, while trials with higher antidepressant–placebo difference seemed to have significantly higher baseline HAM‐D scores than trials with lower antidepressant–placebo differences, this did not seem to be influenced by version of HAM‐D used.
Factor 2. Next, as the version of HAM‐D used was also found to be significantly associated with change scores in both the antidepressant treated group and the placebo treated group, we tried to find the exact contribution of this factor in determining change scores in HAM‐D and antidepressant–placebo differences.
Of all the versions of HAM‐D used—HAM‐D 16, HAM‐D 17, HAM‐D 21, and HAM‐D 24; HAM‐D 17 and HAM‐D 21 were the most frequently used (in 117 and 62 trial arms respectively). As HAM‐D 16, 19, and 24 were used in very few trials (3, 1, and 5 trials respectively), we decided to analyze only trial arms using HAM‐D 17 (n = 117) and HAM‐D 21 (n = 62). Specifically, we compared the mean total baseline HAM‐D score, the change in HAM‐D score in each of antidepressant and placebo groups, and the antidepressant–placebo difference in trials using HAM‐D 17 and HAM‐D 21.
Figure 3A and 3B show the antidepressant–placebo differences obtained in trials using HAM‐D 17 and HAM‐D 21 respectively, by year of publication. As can be seen, in trials using the HAM‐D 17 as an efficacy measure, antidepressant–placebo differences have decreased from around 5 points in 1985 to around 1.8 in 2008. This decrease was statistically significant (p < 0.001, r=−0.5, n = 64). On the other hand, in trials using HAM‐D 21 as an efficacy measure, the antidepressant–placebo difference was around 5 points in 1982, and around 4.8 in 2005 (not a statistically significant decrease r=−0.24, p= 0.17, n = 33).
Figure 3.
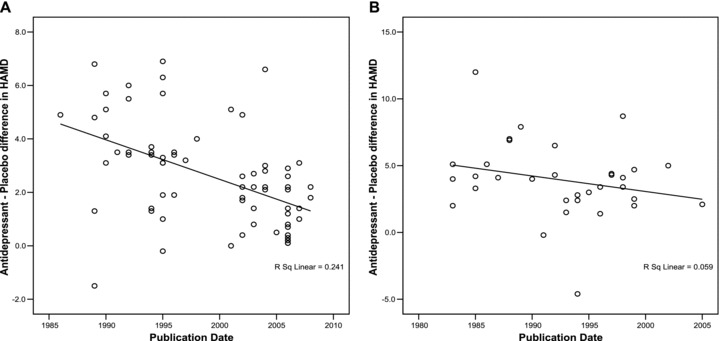
(A) Mean antidepressant–placebo difference in HAM‐D scores in trials using HAMD 17 correlated with year of publication. (B) Mean antidepressant–placebo difference in HAM‐D scores in trials using HAMD 21 correlated with year of publication.
We also compared baseline HAM‐D scores, change in HAM‐D scores (in each of antidepressant and placebo groups) and antidepressant–placebo differences in trials using HAM‐D 17 and trials using HAM‐D 21 (Table 3) using unpaired t tests. As can be seen, mean total baseline HAM‐D scores were significantly higher in trial arms using HAM‐D 21 (25.7) compared to trial arms using HAM‐D 17 (23.5). Similarly, the mean change in HAM‐D scores in the antidepressant group and the antidepressant–placebo differences were significantly higher in trial arms using HAM‐D 21. However, there was no significant difference in the change in HAM‐D in the placebo group between trials using HAM‐D 17 and trials using HAM‐D 21.
Table 3.
Comparison of baseline HAMD scores, change in HAMD scores in antidepressant and placebo groups and antidepressant–placebo differences in HAMD by version of HAMD used
| HAMD 17 | HAMD 21 | Unpaired T‐test | |
|---|---|---|---|
| Mean total baseline HAMD ± SD | 23.5 ± 2.4 | 25.7 ± 2.6 | t (100) = 4.3, P < 0.001 |
| Mean change in AD group HAMD ± SD | 10.6 ± 1.9 | 12.2 ± 4.0 | t (142) = 3.3, P < 0.001 |
| Mean change in placebo group HAMD ± SD | 7.9 ± 1.8 | 8.3 ± 2.8 | t (143) = 1.0, P= 0.3 |
| Antidepressant–placebo difference in HAMD score ± SD | 2.5 ± 1.9 | 4.0 ± 2.9 | t (153) = 3.8, P < 0.001 |
Factor 3: Finally as longer duration of trial seemed to be associated with greater change in HAM‐D scores especially for patients assigned to placebo treatment, but also in patients receiving antidepressants, we analyzed this factor further. The trials had variable durations: 4 weeks, 5 weeks, 6 weeks, 7 weeks, 8 weeks, 9 weeks, 10 weeks, and 12 weeks. Based on this distribution, we bifurcated the sample into those trial arms with a duration of ≤6 weeks (4 weeks, 5 weeks, and 6 weeks, n of antidepressant trials = 76, n of treatment arms = 127) and those with a duration of >6 weeks (8 weeks, 10 weeks, and 12 weeks, n of antidepressant trials = 50 and n of treatment arms = 92) and compared the two groups using a t test (using distribution based on treatment arms).
As can be seen in Table 4, among the antidepressant trial arms of longer duration (>6 weeks), the antidepressant–placebo differences were significantly smaller than among the antidepressant trial arms of shorter duration (≤6 weeks, 3.9 vs. 2.3, t(167) = 4.5, p < 0.001).
Table 4.
Comparison of change in HAMD scores in antidepressant and placebo groups and antidepressant–placebo differences in HAMD by duration of trial
| ≤6 weeks (n = 127) | >6 weeks (n = 92) | Unpaired T‐test | |
|---|---|---|---|
| Mean change in AD group HAMD ± SD | 11.5 ± 3.4 | 10.8 ± 2.2 | t (156) = 1.4, P= 0.16 |
| Mean change in placebo group HAMD ± SD | 7.6 ± 2.6 | 8.3 ± 1.6 | t (159) = 2.0, P= 0.05 |
| Antidepressant–placebo difference in HAMD score ± SD | 3.9 ± 2.9 | 2.3 ± 1.6 | t (167) = 4.5, P < 0.001 |
Other factors such as year of approval of the antidepressant as well as dosing schedule (fixed vs. flexible) did not show up as significant in either of the regression analyses, we did not evaluate this further. There was a small, but significant association between year of publication and change in mean total HAM‐D score among depressed patients assigned to placebo, although such an association was not seen among depressed patients assigned to antidepressants. No specific analysis was conducted to evaluate this further.
Discussion
The aim of this study was to assess the change in antidepressant–placebo differences in HAM‐D scores among 130 published antidepressant trials conducted between 1981 and 2008. Further, we assessed if any research design factor was associated with this change. Lastly, we examined if we could identify specific changes in antidepressant design factors that may provide an optimal antidepressant clinical trial model as well as provide insights into reducing type II error.
We found that antidepressant–placebo differences have decreased alarmingly over the past three decades. The average antidepressant–placebo difference was approximately six points using the HAM‐D scale in 1982 compared to only an average of about three points in 2008, among published antidepressant trials. We could not estimate the change for all antidepressant trials conducted in this time period, as a significant number are neither published (failed or negative antidepressant trials) nor available in any public domain databases. This was a limitation of our study; however, as it has been shown that negative trials (meaning lower antidepressant–placebo differences) are more likely to remain unpublished, we can only surmise that including these unpublished trials would further reduce the mean antidepressant–placebo difference across all trials.
In our analysis, the research design features that we studied were associated with the difference in response to antidepressants and placebo over the past three decades. It appears that depressed patients participating in more recent antidepressant clinical trials seem to have lower severity as measured by the HAM‐D. Having said that, it is important to note that fewer symptoms are being evaluated in more recent trials because of changes in the version of HAM‐D being used compared to earlier trials.
As shown in Figure 3A and 3B, the lower magnitude of response to antidepressant in more recent antidepressant trials is most evident in the trials using the 17‐item version of the HAM‐D. The fact that longer versions of HAM‐D seem to discriminate better between antidepressant and placebo could be due to the fact that a longer scale allows one to capture depressive symptoms across patient types – i.e., the manifestations of depression vary from person to person, and although probably most depressed patients have the “core” symptoms of depression, the other symptoms have variable expression. Another possible explanation is that measuring more symptoms simply allows for more statistical variability. As we have shown, the mean baseline severity at entry into an antidepressant clinical trial has decreased, introducing a relative restriction in range that would tend to reduce observed antidepressant–placebo differences. It is possible that the better discriminating ability of longer HAM‐D versions may be due to the fact that having a few more HAM‐D items would introduce more variability to work with, thus widening the range and counteracting the effect of declining severity at entry.
For the clinician, these findings suggest that improving the methodology to assess the efficacy of antidepressants is still work in progress. In this context, it is important to note that varying results of antidepressant trials may be related to the methodology and the conduct of the antidepressant trials and not to the antidepressants themselves. It is misleading to suggest that antidepressants may not be useful when our methods to fully assess the effects of antidepressants are less than ideal, given the current state of knowledge.
Besides the clinical implications, our analysis has implications for the design and conduct of antidepressant trials. There needs to be broader based research on better methods to evaluate the efficacy and effectiveness of antidepressants. The desire to identify the effects of antidepressants on core symptoms of depression [12] as a method to assess efficacy may need to be re‐examined, as our results suggest that a more comprehensive evaluation of the depressive syndrome may be a better method to evaluate antidepressant efficacy as an illness as heterogeneous as depression is better assessed by a broader, more inclusive symptom measure.
The results of our analysis suggest that power calculations for future antidepressant trials may need to be revised, until a better methodology to detect‐antidepressant–placebo differences has been developed. It is also important to note that symptom reduction with placebo seems to increase with duration of trial, and may lead to underestimation of antidepressant–placebo differences.
It is important to note that, for several reasons, our analyses suggest lines of further inquiry rather than firm conclusions. First, this analysis does not include data from unpublished antidepressant trials, most of which have failed to show superiority over placebo and thus, may be more informative on design features. Second, our multi‐factorial analysis is not comprehensive. We could not assess the role of raters used in the trials. “Rater inflation” has often been cited a one of the reasons for inability of antidepressants to separate from placebo [13]. Similarly, we could not assess the role of numbers of trial centers used (which has been shown to influence placebo response rates –[14]), results from individual patients, or possible change in patient populations participating in clinical trials across the years. Lastly, we only evaluated antidepressant trials that used HAM‐D. It is also possible that although it is critical to use the double‐blind, parallel, placebo control method to detect acute effects of antidepressant (this is the primary method advocated by the US FDA to assess the efficacy of antidepressants), the full utility of antidepressants are better measured by randomized withdrawal (relapse prevention) study designs.
In conclusion, the results of our analysis suggest that antidepressant–placebo differences have markedly declined in the past three decades. Interestingly, much of the decline is associated with research design features such as mean total HAM‐D scores, versions of the HAM‐D scale used and the duration of the trial. These results suggest that research is needed to improve the methodology of antidepressant trials. Also, until such research is complete, power calculations for future antidepressants should be made expecting more modest effect sizes than current models.
Disclosures
Dr. Khan is the principal investigator of over 300 trials sponsored by more than 57 pharmaceutical companies and 23 CROs. He has done no consulting or speaking on their behalf.
Drs. Bhat and Kolts have no competing interests to report.
Dr. Thase is a consultant for AstraZeneca, Bristol‐Myers Squibb Company, Cephalon, Inc., Cyberonics, Inc., Eli Lilly & Co., Forest Laboratories, Glaxo‐SmithKline, Janssen Pharmaceutical, MedAvante, Inc., Neuronetics, Inc., Novartis, Organon International, Sepracor, Inc., Shire US Inc., Supernus Pharmaceuticals, and Wyeth Pharmaceuticals; and has received research grants from Eli Lilly and Company and Sepracor, Inc. He is on the speaker's bureau for AstraZeneca, Bristol‐Myers Squibb Company, Cyberonics, Inc., Eli Lilly & Co., Glaxo‐SmithKline, Sanofi Aventis, Schering Plough (formerly Organon, Inc.), and Wyeth Pharmaceuticals.
Dr. Brown is a co‐owner and CEO of Clinical Research Centers International, a company that sets up and manages clinical trials sites outside the United States that conduct research for both drug companies and nonprofit entities.
Supporting information
Figure S1 Quorum checklist for selection of studies conducted between 1981 and 2008.
Supplement 2 Bibliography of studies included in the analysis.
Supplement 3 Steps in determining the pathway to the final hierarchical multiple regression analysis.
Please note: Wiley‐Blackwell are not responsible for the content or functionality of any supporting materials supplied by the authors. Any queries (other than missingmaterial) should be directed to the corresponding author for the article.
Supporting info item
References
- 1. Kirsch I, Deacon BJ, Huedo‐Medina TB, et al Initial severity and antidepressant benefits: A meta‐analysis of data submitted to the Food and Drug Administration. PLoS Med 2008;5:e45. doi: 10.1371/journal.pmed.0050045. [DOI] [PMC free article] [PubMed] [Google Scholar]
- 2. Broich K. Committee for medicinal products for human use (CHMP) assessment on efficacy of antidepressants. Eur Neuropsychopharmacol 2009;19:305–308. [DOI] [PubMed] [Google Scholar]
- 3. Walsh BT, Seidman S, Sysko R, et al Placebo response in studies of major depression: Variable, substantial, and growing. JAMA 2002;287:840–1847. [DOI] [PubMed] [Google Scholar]
- 4. Khan A, Leventhal S, Khan S, et al Severity of depression and response to antidepressants and placebo: An analysis of the FDA database. J Clin Psychopharmacol 2002;22:40–45. [DOI] [PubMed] [Google Scholar]
- 5. Khan A, Kolts RL, Thase ME, et al Research design features and patient characteristics associated with the outcome of antidepressant clinical trials. Am J Psychiatry 2004;161:2045–2049. [DOI] [PubMed] [Google Scholar]
- 6. Cipriani A, Furukawa T, Salanti G, et al Comparative efficacy and acceptability of 12 new‐generation antidepressants: A multiple‐treatments meta‐analysis Lancet 2009;373:746–758. [DOI] [PubMed] [Google Scholar]
- 7. Hamilton M. A rating scale for depression. J Neurol Neurosurg Psychiatry 1960;23:56–62. [DOI] [PMC free article] [PubMed] [Google Scholar]
- 8. Zitman FG, Mennen MFG, Griez E, et al The different versions of the Hamilton depression rating scale In: Bech P, Coppen A, editors. The Hamilton scales (Psychopharmacology series 9), Berlin , Heidelberg : Springer–Verlag, 2000;28–34. [DOI] [PubMed] [Google Scholar]
- 9. Turner E, Matthews A, Linardatos E, et al Selective publication of antidepressant trials and its influence on apparent efficacy. N Engl J Med 2008;358:252–260. [DOI] [PubMed] [Google Scholar]
- 10. Prien RF, Carpenter LL, Kupfer DJ. The definition and operational criteria for treatment outcome of major depressive disorder. A review of the current research literature. Arch Gen Psychiatry 1991;48:796–800. [DOI] [PubMed] [Google Scholar]
- 11. Moher D, Cook DJ, Eastwood S, et al. for the Quorum Group . Improving the quality of reports of meta‐analyses of randomized controlled trials: The QUOROM statement. Lancet 1999;354:1896–1900. [DOI] [PubMed] [Google Scholar]
- 12. Bech P, Allerup P, Gram LF, et al The Hamilton depression scale: Evaluation of objectivity using logistic models. Acta Psychiatr Scand 1981;63:290–299. [DOI] [PubMed] [Google Scholar]
- 13. Mundt JC, Greist JH, Jefferson JW, et al Is it easier to find what you are looking for if you know what it looks like?. J Clin Psychopharm 2007;27:121–125. [DOI] [PubMed] [Google Scholar]
- 14. Bridge JA, Birmaher B, Iyengar S, et al Placebo response in randomized controlled trials of antidepressants for pediatric major depressive disorder. Am J Psychiatry 2009;166:42–49. [DOI] [PubMed] [Google Scholar]
Associated Data
This section collects any data citations, data availability statements, or supplementary materials included in this article.
Supplementary Materials
Figure S1 Quorum checklist for selection of studies conducted between 1981 and 2008.
Supplement 2 Bibliography of studies included in the analysis.
Supplement 3 Steps in determining the pathway to the final hierarchical multiple regression analysis.
Please note: Wiley‐Blackwell are not responsible for the content or functionality of any supporting materials supplied by the authors. Any queries (other than missingmaterial) should be directed to the corresponding author for the article.
Supporting info item